| Param | Original file | Final file |
|---|---|---|
| Filename | modeM0/AS1A04_199T01_9000002040_13784cztM0_level2.evt | modeM0/AS1A04_199T01_9000002040_13784cztM0_level2_quad_clean.evt |
| Size (bytes) | 631,163,520 | 90,262,080 |
| Size | 601.9 MB | 86.1 MB |
| Events in quadrant A | 4,184,164 | 545,585 |
| Events in quadrant B | 4,499,841 | 551,653 |
| Events in quadrant C | 4,200,738 | 542,097 |
| Events in quadrant D | 5,650,130 | 500,575 |
| Mode M9 | |||
|---|---|---|---|
| Quadrant | BADHDUFLAG | Total packets | Discarded packets |
| A | 0 | 2 | 0 |
| B | 0 | 2 | 0 |
| C | 0 | 2 | 0 |
| D | 0 | 2 | 0 |
| Mode SS | |||
|---|---|---|---|
| Quadrant | BADHDUFLAG | Total packets | Discarded packets |
| A | 0 | 176 | 0 |
| B | 0 | 176 | 0 |
| C | 0 | 176 | 0 |
| D | 0 | 176 | 0 |
| Mode M0 | |||
|---|---|---|---|
| Quadrant | BADHDUFLAG | Total packets | Discarded packets |
| A | 0 | 18015 | 5 |
| B | 0 | 18770 | 4 |
| C | 0 | 18006 | 4 |
| D | 0 | 22395 | 4 |
| Quadrant | Total seconds | Saturated seconds | Saturation percentage |
|---|---|---|---|
| A | 8532 | 524 | 6.141585% |
| B | 8532 | 578 | 6.774496% |
| C | 8532 | 386 | 4.524144% |
| D | 8532 | 718 | 8.415377% |
Noise dominated data is calculated using 1-second bins in cleaned event files. If a bin has >2000 counts, and if more than 50% of those come from <1% of pixels, then it is considered to be noise-dominated and hence unusable.
| Quadrant | # 1 sec bins | Bins with >0 counts | Bins with >2000 counts | High rate bins dominated by noise | Noise dominated (total time) | Noise dominated (detector-on time) | Marked lightcurve |
|---|---|---|---|---|---|---|---|
| A | 8823 | 8536 | 0 | 0 | 0.00% | 0.00% | 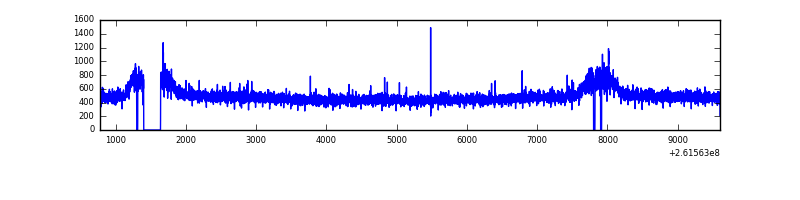 |
| B | 8823 | 8536 | 25 | 25 | 0.28% | 0.29% | 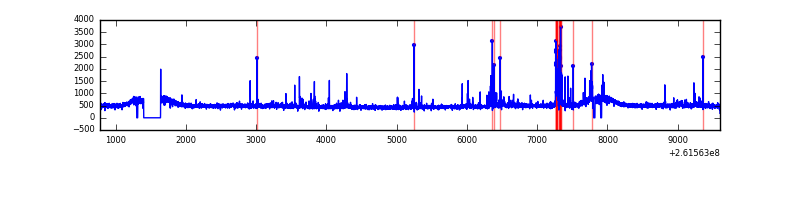 |
| C | 8823 | 8536 | 0 | 0 | 0.00% | 0.00% | 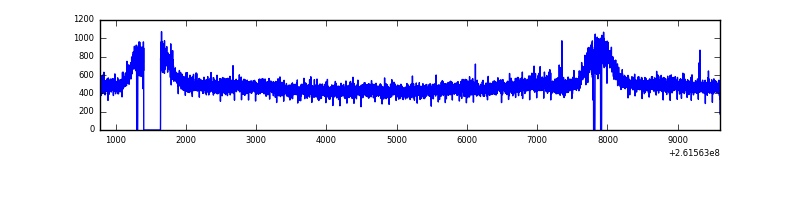 |
| D | 8823 | 8537 | 258 | 258 | 2.92% | 3.02% | 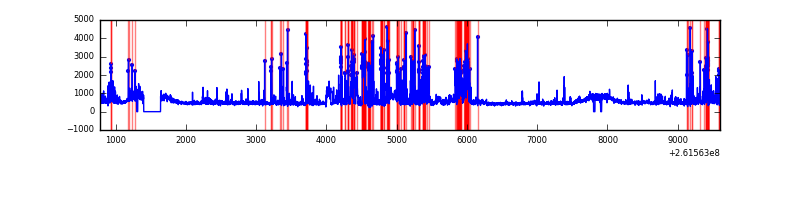 |
Top three noisy pixels from each quadrant. If the there are fewer than three noisy pixels in the level2.evt file, extra rows are filled as -1
| Pixel properties | Quadrant properties | ||||||
|---|---|---|---|---|---|---|---|
| Quadrant | DetID | PixID | Counts | Sigma | Mean | Median | Sigma |
| A | 8 | 15 | 34872 | 154.83 | 1069 | 1043 | 218.5 |
| A | 0 | 23 | 13126 | 55.3 | 1069 | 1043 | 218.5 |
| A | 1 | 162 | 12608 | 52.93 | 1069 | 1043 | 218.5 |
| B | 3 | 64 | 179512 | 862.47 | 1064 | 1033 | 206.9 |
| B | 8 | 250 | 64663 | 307.48 | 1064 | 1033 | 206.9 |
| B | 4 | 80 | 34220 | 160.37 | 1064 | 1033 | 206.9 |
| C | 3 | 233 | 111473 | 450.62 | 1049 | 1052 | 245.0 |
| C | 13 | 61 | 7363 | 25.75 | 1049 | 1052 | 245.0 |
| C | 0 | 207 | 2892 | 7.51 | 1049 | 1052 | 245.0 |
| D | 13 | 249 | 917295 | 3673.62 | 1032 | 1002 | 249.4 |
| D | 1 | 52 | 587672 | 2352.09 | 1032 | 1002 | 249.4 |
| D | 5 | 222 | 88890 | 352.36 | 1032 | 1002 | 249.4 |
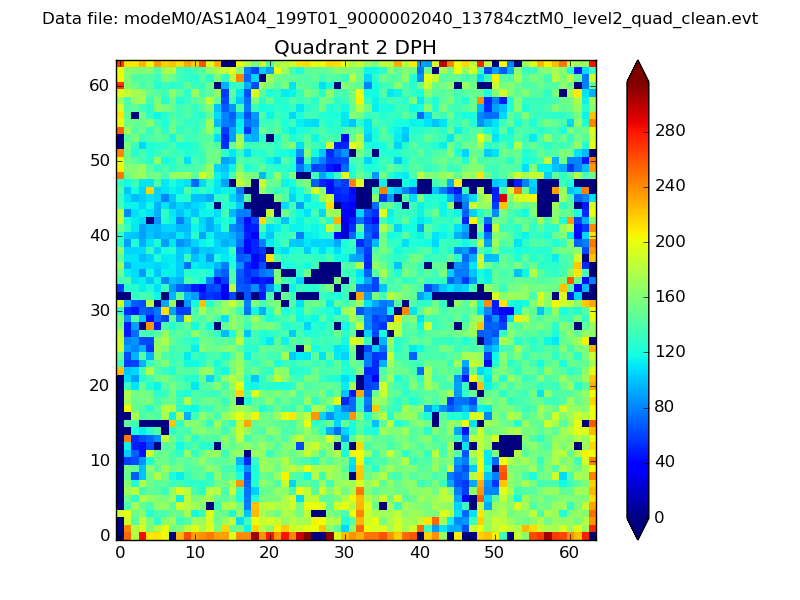
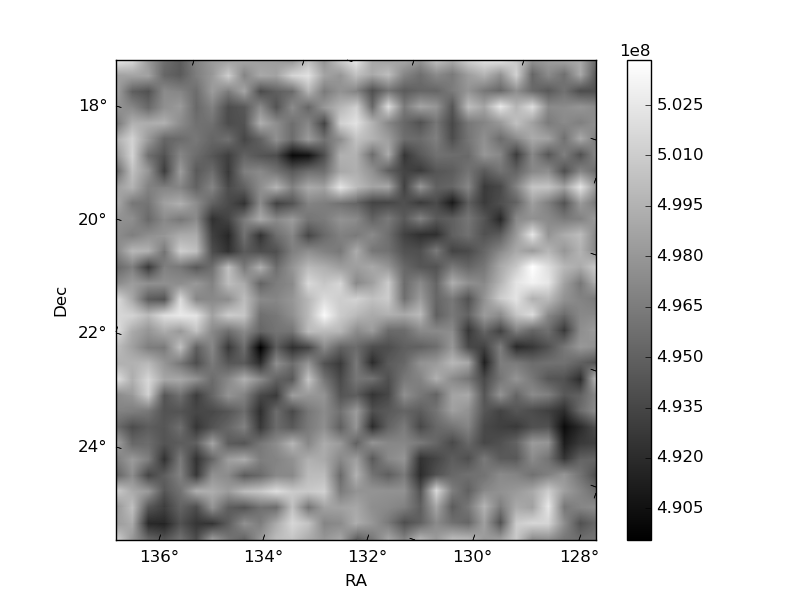
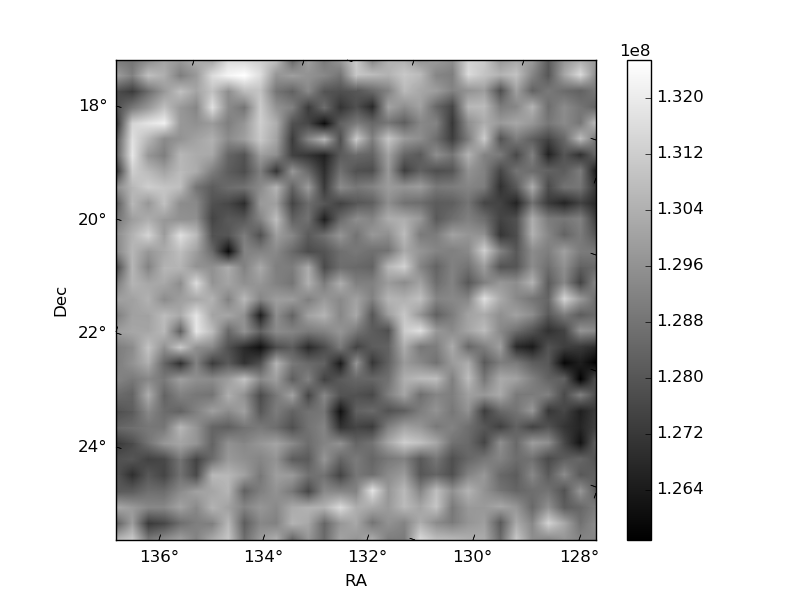
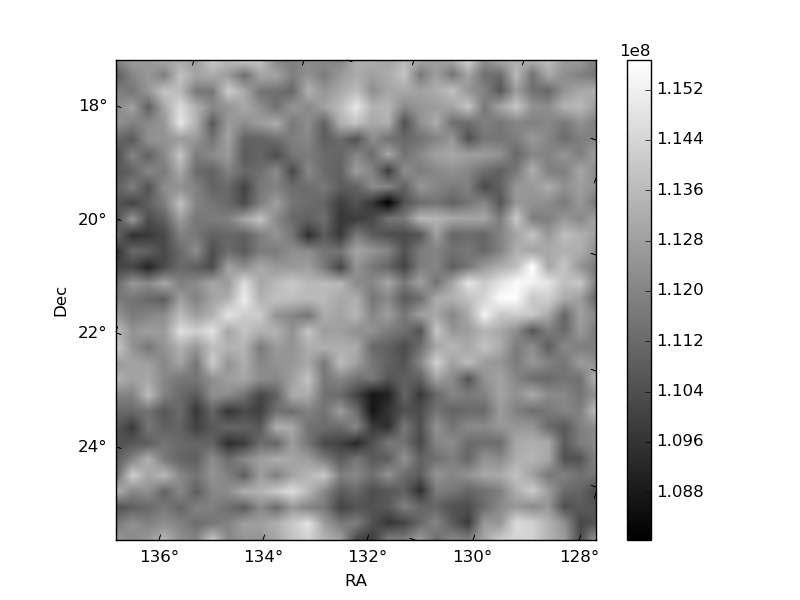
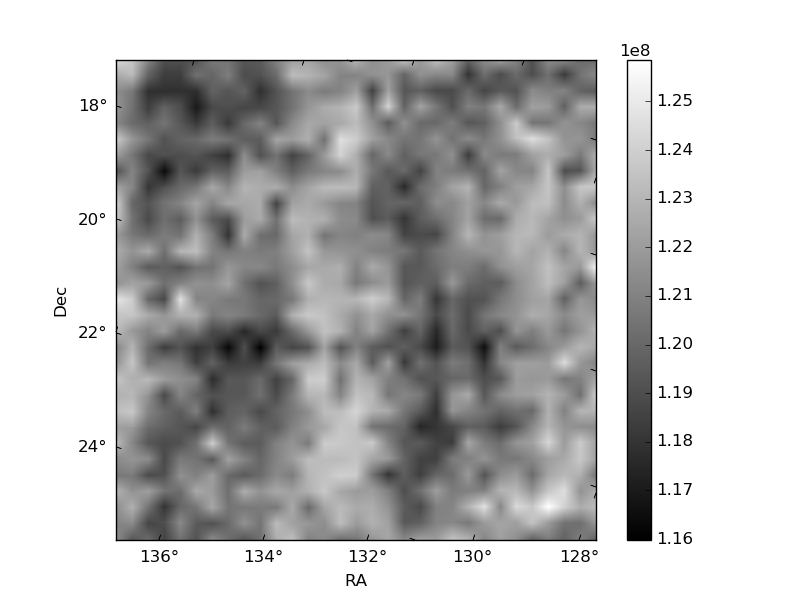
Histogram calculated using DETX and DETY for each event in the final _common_clean file
| Quadrant A | 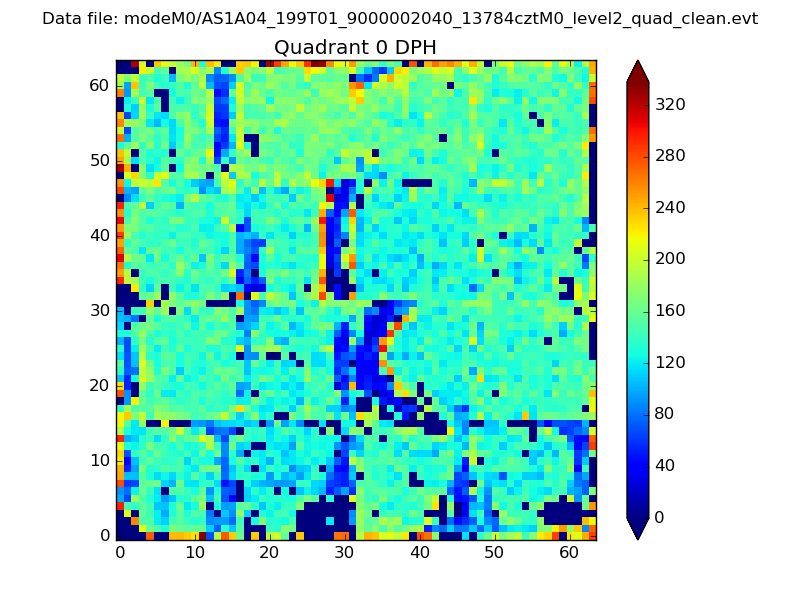 |
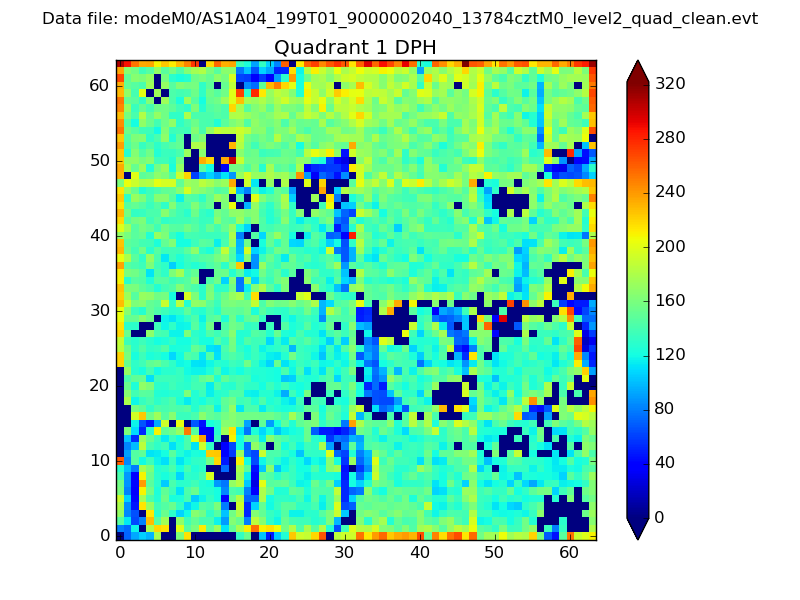 |
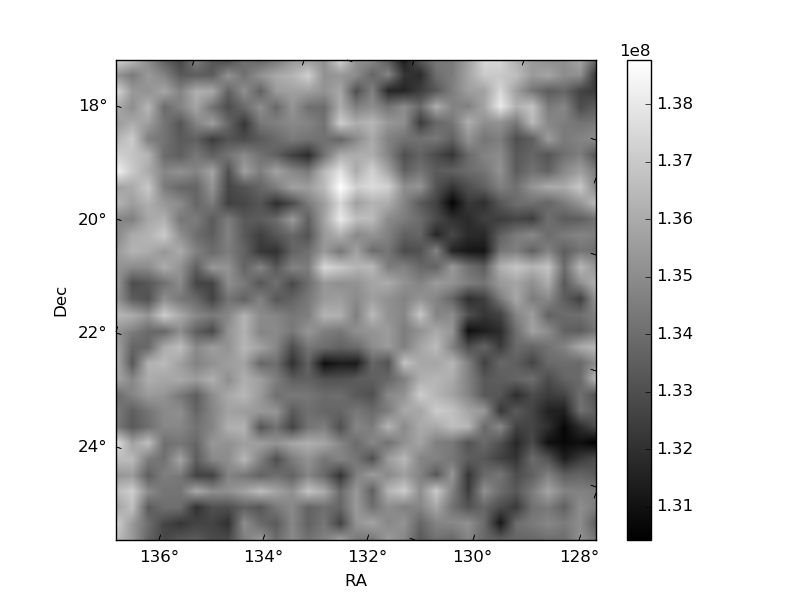
Quadrant B |
|---|---|---|---|
| Quadrant D | 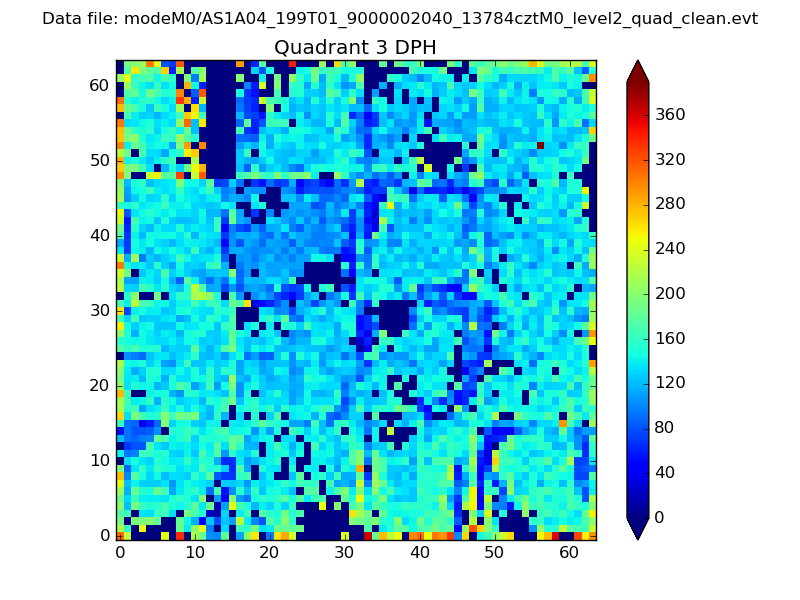 |
 |
Quadrant C |
| Plot type | Count rate plots | Images |
|---|---|---|
| Comparison with Poisson distribution Blue bars denote a histogram of data divided into 1 sec bins. Red curve is a Poisson curve with rate = median count rate of data. |
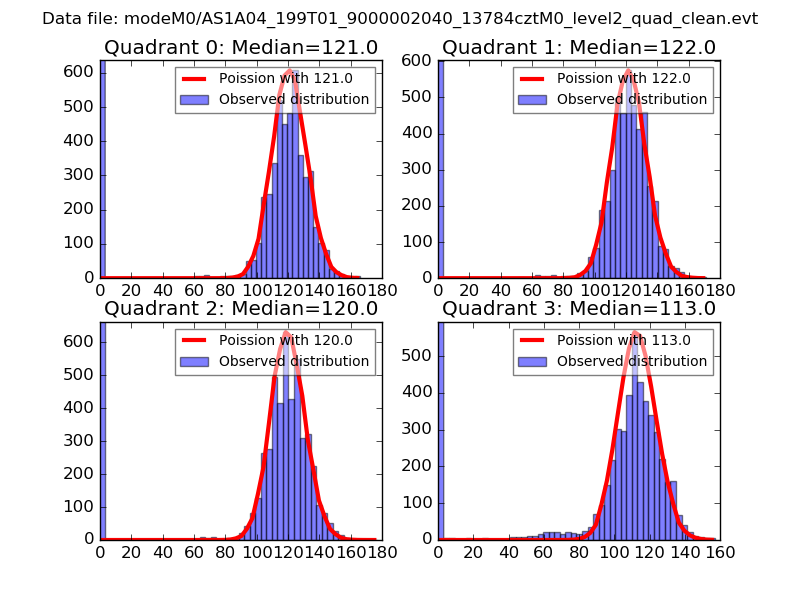 |
 |
| Quadrant-wise count rates Data is divided into 100 sec bins |
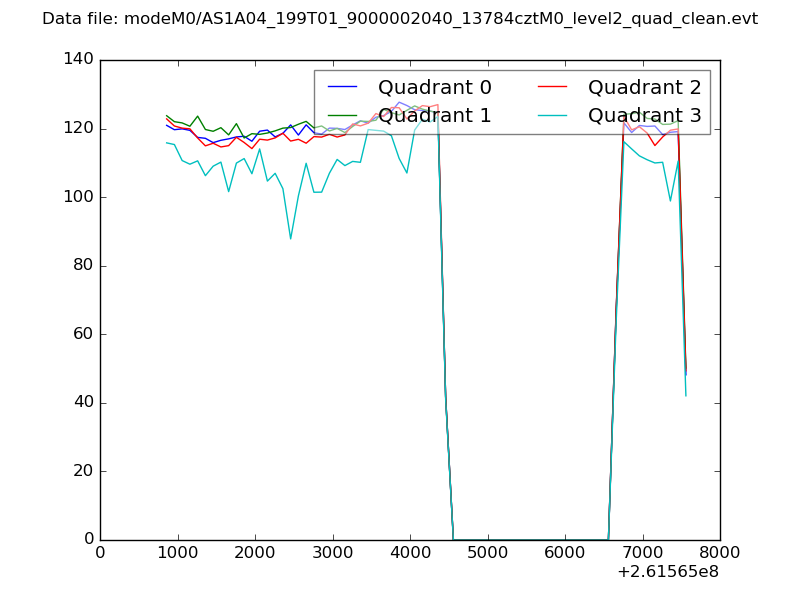 |
|
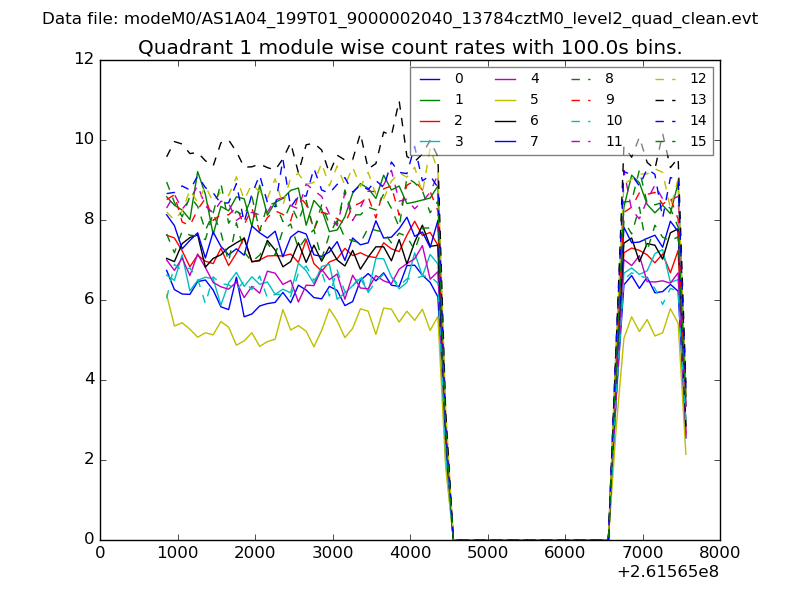
| Module-wise count rates for Quadrant A Data is divided into 100 sec bins |
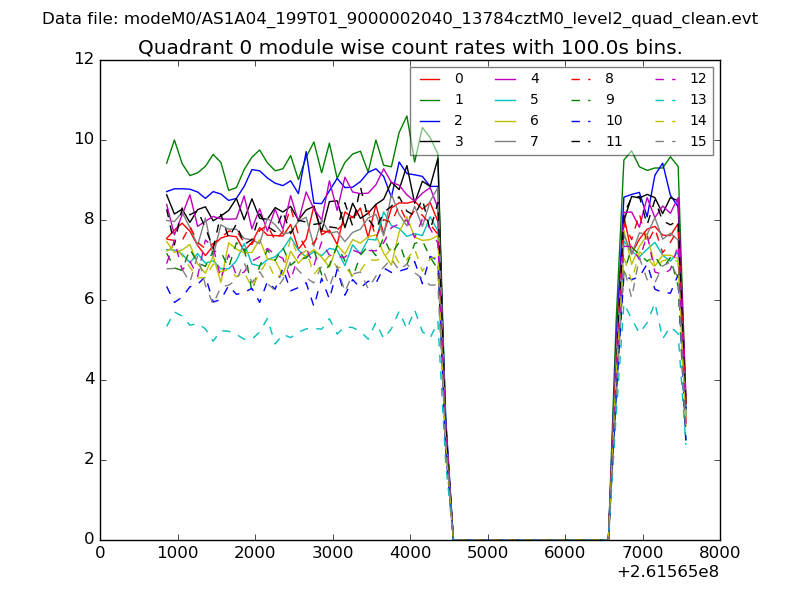 |
 |
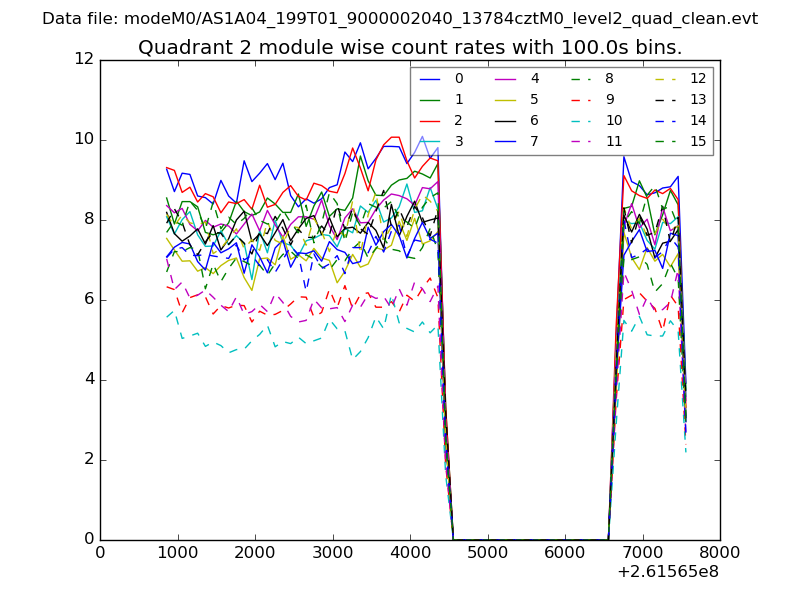
| Module-wise count rates for Quadrant B Data is divided into 100 sec bins |
 |
 |
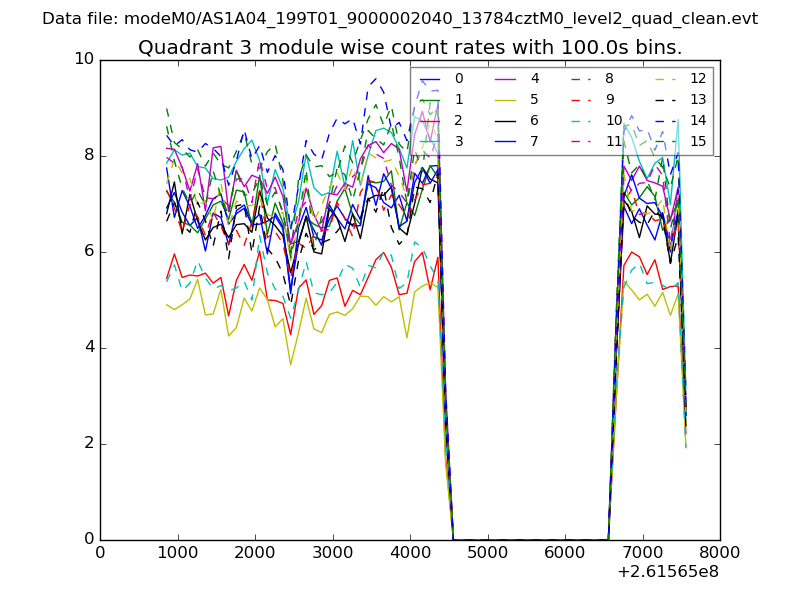
| Module-wise count rates for Quadrant C Data is divided into 100 sec bins |
 |
 |
| Module-wise count rates for Quadrant D Data is divided into 100 sec bins |
 |
 |
| Parameter | Plot |
|---|---|
| CZT HV Monitor | 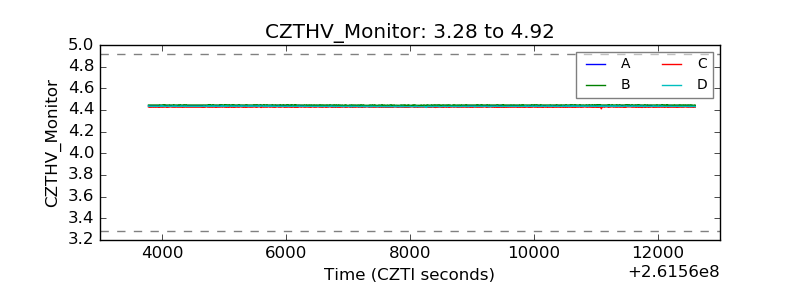 |
| D_VDD | 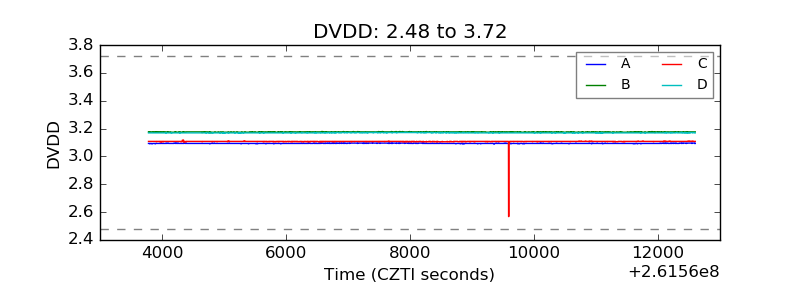 |
| Temperature 1 | 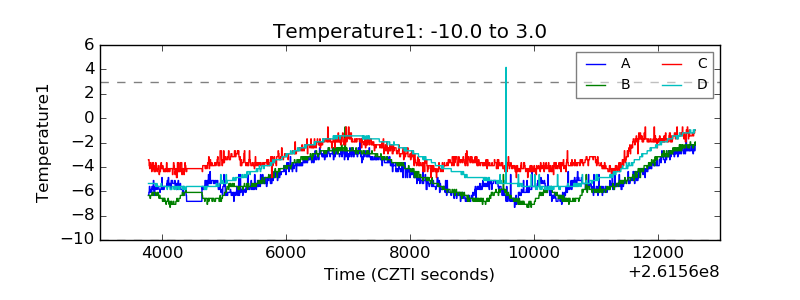 |
| Veto HV Monitor | 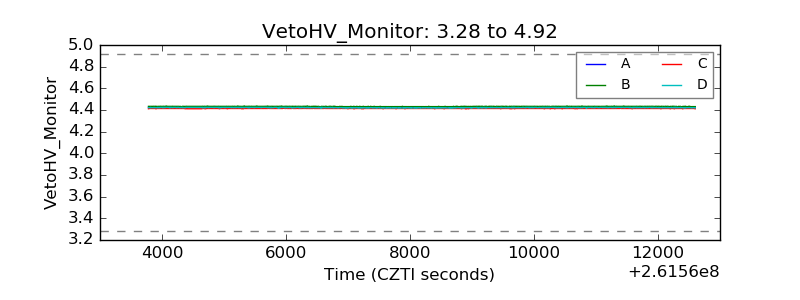 |
| Veto LLD | 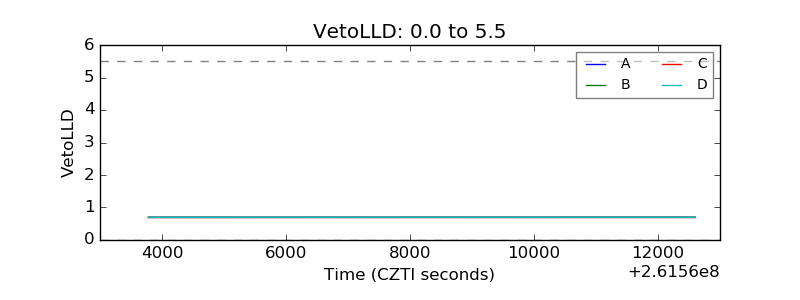 |
| Alpha Counter | 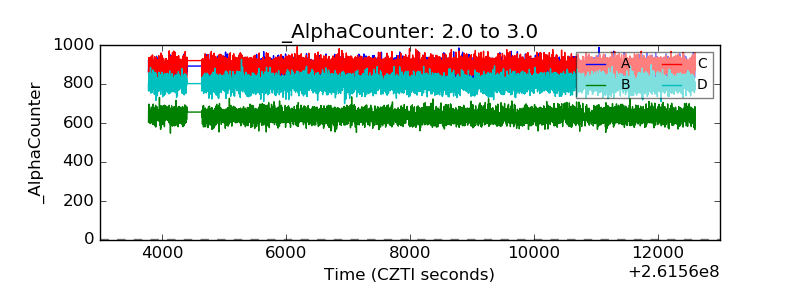 |
| _CPM_Rate | 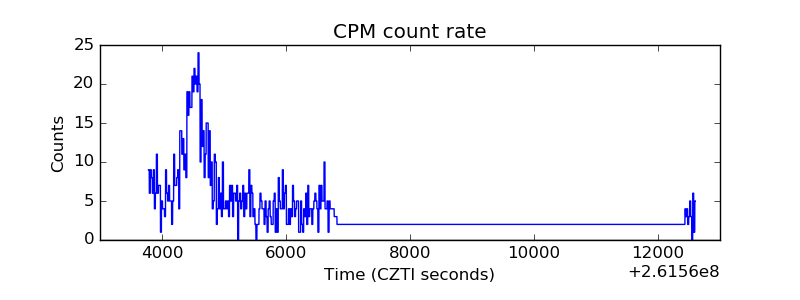 |
| CZT Counter | 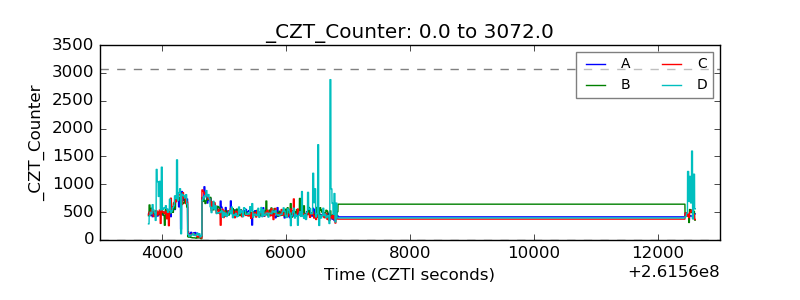 |
| +2.5 Volts monitor | 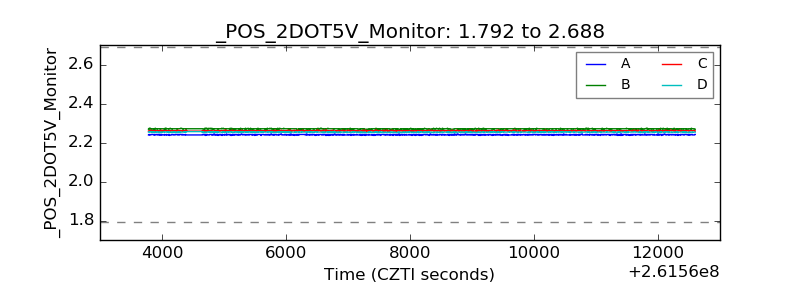 |
| +5 Volts monitor |  |
| _ROLL_ROT | 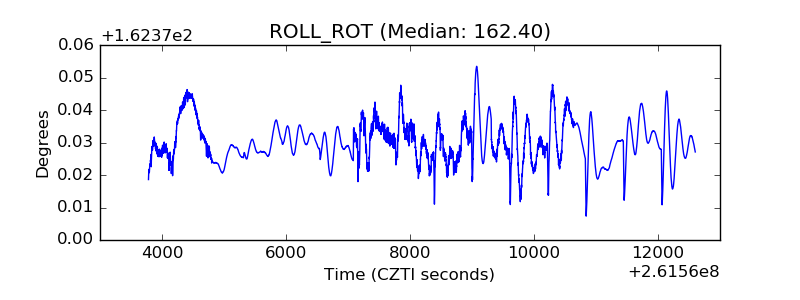 |
| _Roll_DEC | 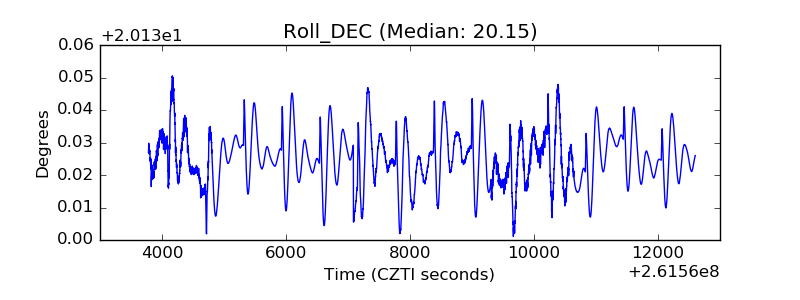 |
| _Roll_RA | 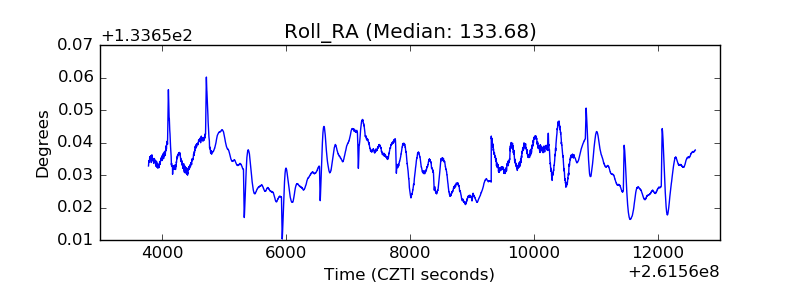 |
| Veto Counter | 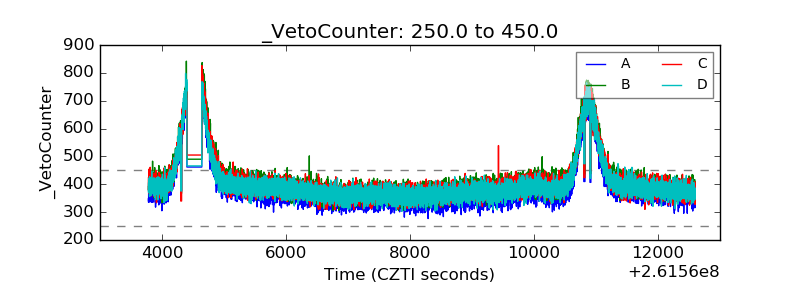 |