| Param | Original file | Final file |
|---|---|---|
| Filename | modeM0/AS1A04_199T01_9000002040_13787cztM0_level2.evt | modeM0/AS1A04_199T01_9000002040_13787cztM0_level2_quad_clean.evt |
| Size (bytes) | 825,215,040 | 153,708,480 |
| Size | 787.0 MB | 146.6 MB |
| Events in quadrant A | 5,900,015 | 961,292 |
| Events in quadrant B | 5,947,808 | 970,735 |
| Events in quadrant C | 5,663,616 | 959,443 |
| Events in quadrant D | 6,654,591 | 920,816 |
| Mode M9 | |||
|---|---|---|---|
| Quadrant | BADHDUFLAG | Total packets | Discarded packets |
| A | 0 | 12 | 0 |
| B | 0 | 12 | 0 |
| C | 0 | 12 | 0 |
| D | 0 | 12 | 0 |
| Mode SS | |||
|---|---|---|---|
| Quadrant | BADHDUFLAG | Total packets | Discarded packets |
| A | 0 | 248 | 0 |
| B | 0 | 248 | 0 |
| C | 0 | 248 | 0 |
| D | 0 | 248 | 0 |
| Mode M0 | |||
|---|---|---|---|
| Quadrant | BADHDUFLAG | Total packets | Discarded packets |
| A | 0 | 25550 | 3 |
| B | 0 | 25668 | 2 |
| C | 0 | 24932 | 2 |
| D | 0 | 27996 | 2 |
| Quadrant | Total seconds | Saturated seconds | Saturation percentage |
|---|---|---|---|
| A | 12190 | 152 | 1.246924% |
| B | 12190 | 151 | 1.238720% |
| C | 12190 | 64 | 0.525021% |
| D | 12190 | 203 | 1.665299% |
Noise dominated data is calculated using 1-second bins in cleaned event files. If a bin has >2000 counts, and if more than 50% of those come from <1% of pixels, then it is considered to be noise-dominated and hence unusable.
| Quadrant | # 1 sec bins | Bins with >0 counts | Bins with >2000 counts | High rate bins dominated by noise | Noise dominated (total time) | Noise dominated (detector-on time) | Marked lightcurve |
|---|---|---|---|---|---|---|---|
| A | 13346 | 12192 | 27 | 27 | 0.20% | 0.22% | 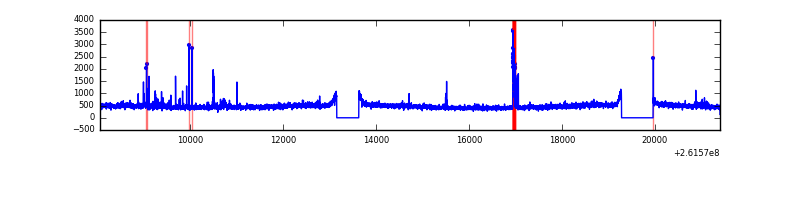 |
| B | 13346 | 12193 | 11 | 11 | 0.08% | 0.09% | 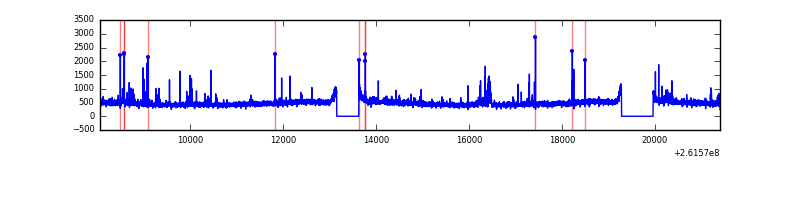 |
| C | 13346 | 12193 | 1 | 1 | 0.01% | 0.01% | 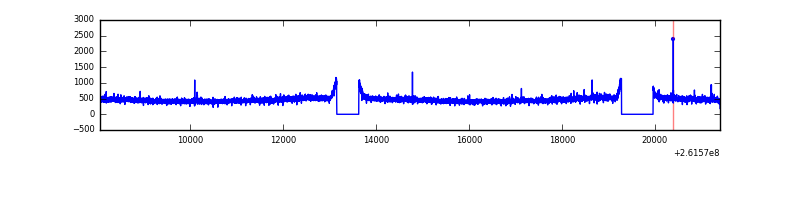 |
| D | 13346 | 12193 | 109 | 109 | 0.82% | 0.89% | 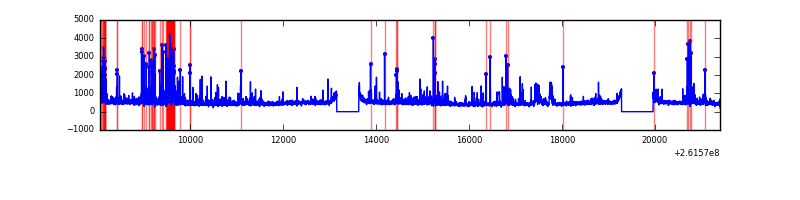 |
Top three noisy pixels from each quadrant. If the there are fewer than three noisy pixels in the level2.evt file, extra rows are filled as -1
| Pixel properties | Quadrant properties | ||||||
|---|---|---|---|---|---|---|---|
| Quadrant | DetID | PixID | Counts | Sigma | Mean | Median | Sigma |
| A | 9 | 143 | 180092 | 597.93 | 1449 | 1416 | 298.8 |
| A | 0 | 23 | 82013 | 269.71 | 1449 | 1416 | 298.8 |
| A | 8 | 15 | 29525 | 94.07 | 1449 | 1416 | 298.8 |
| B | 0 | 219 | 94182 | 333.33 | 1446 | 1408 | 278.3 |
| B | 10 | 252 | 44219 | 153.82 | 1446 | 1408 | 278.3 |
| B | 4 | 173 | 40686 | 141.12 | 1446 | 1408 | 278.3 |
| C | 3 | 233 | 149629 | 449.41 | 1413 | 1418 | 329.8 |
| C | 13 | 61 | 10374 | 27.16 | 1413 | 1418 | 329.8 |
| C | 14 | 234 | 7937 | 19.77 | 1413 | 1418 | 329.8 |
| D | 1 | 52 | 730524 | 1959.77 | 1394 | 1364 | 372.1 |
| D | 13 | 249 | 492244 | 1319.34 | 1394 | 1364 | 372.1 |
| D | 10 | 157 | 56747 | 148.85 | 1394 | 1364 | 372.1 |
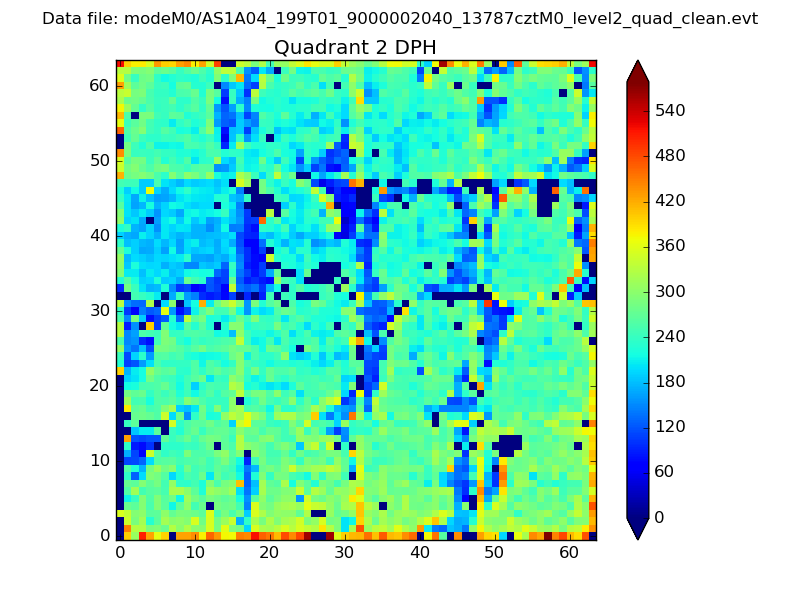
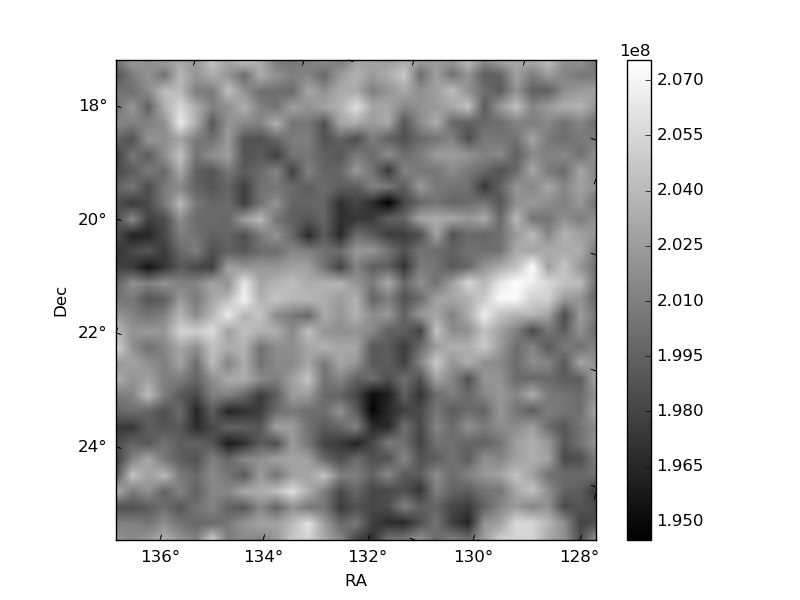
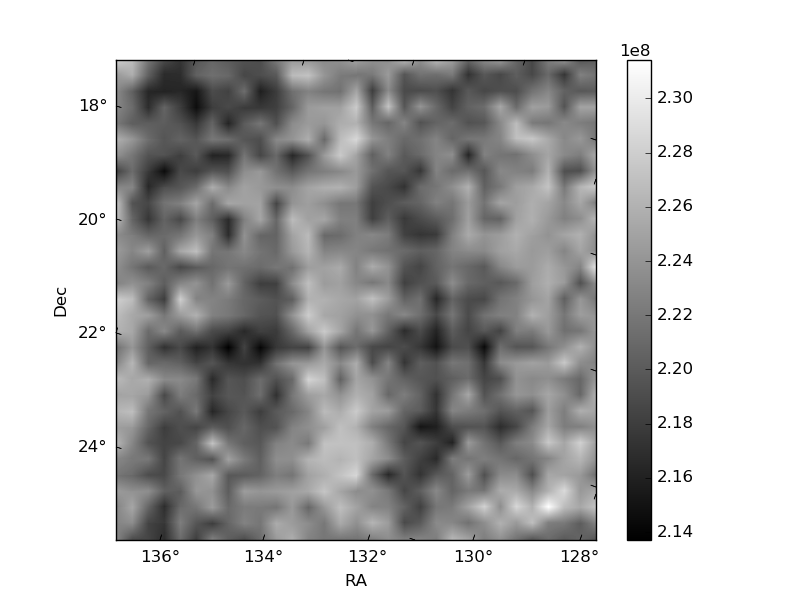
Histogram calculated using DETX and DETY for each event in the final _common_clean file
| Quadrant A | 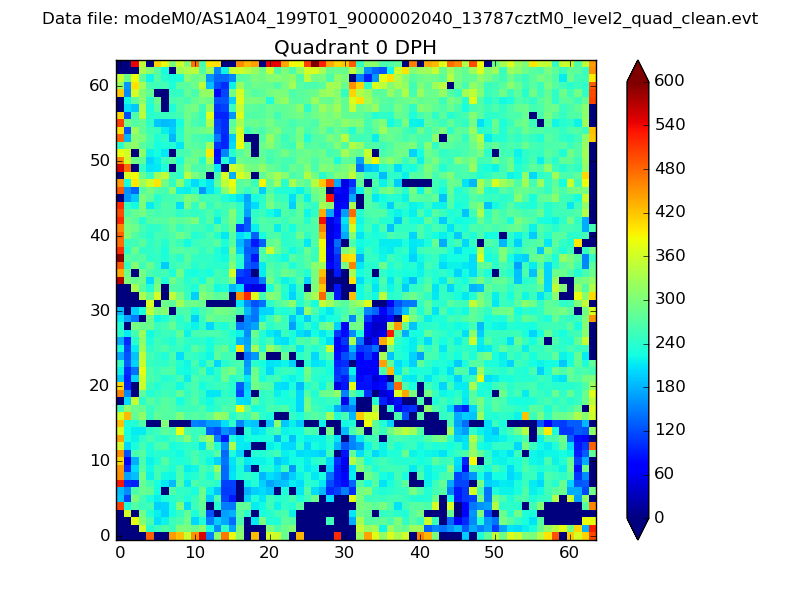 |
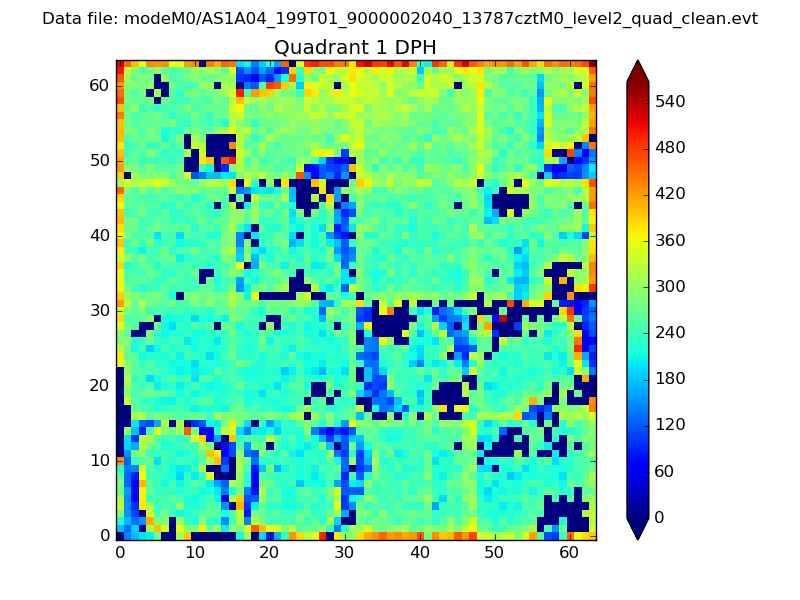 |
Quadrant B |
|---|---|---|---|
| Quadrant D | 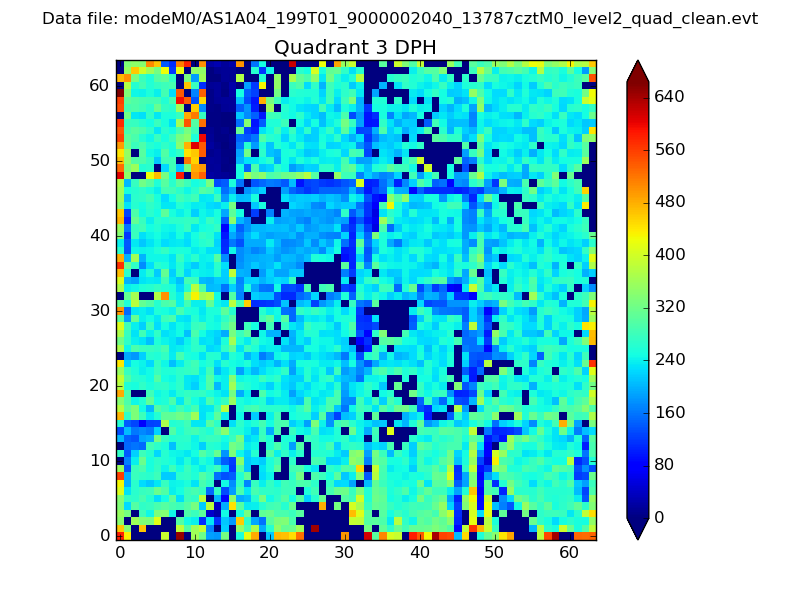 |
 |
Quadrant C |
| Plot type | Count rate plots | Images |
|---|---|---|
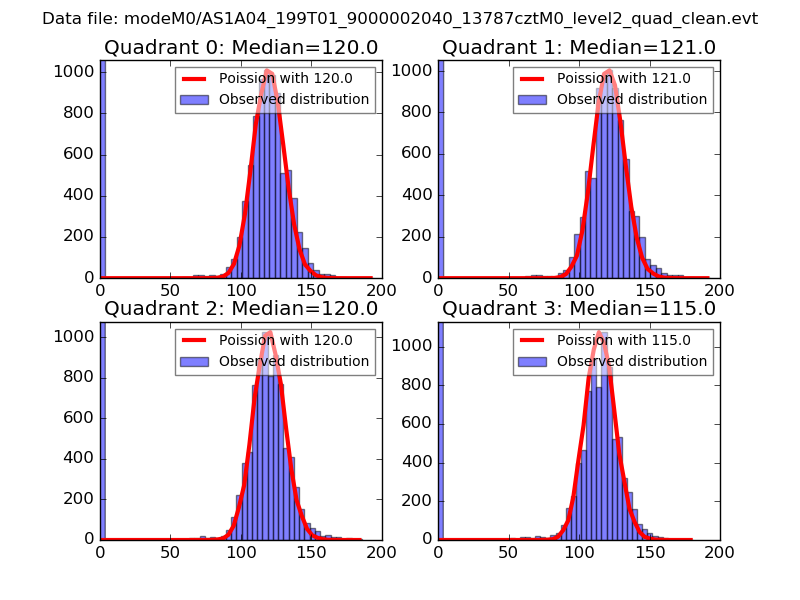
| Comparison with Poisson distribution Blue bars denote a histogram of data divided into 1 sec bins. Red curve is a Poisson curve with rate = median count rate of data. |
 |
 |
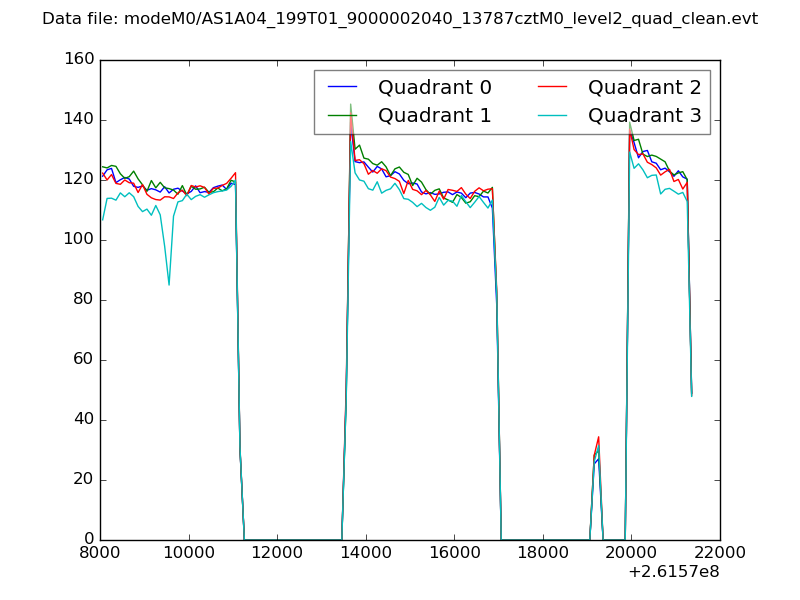
| Quadrant-wise count rates Data is divided into 100 sec bins |
 |
|
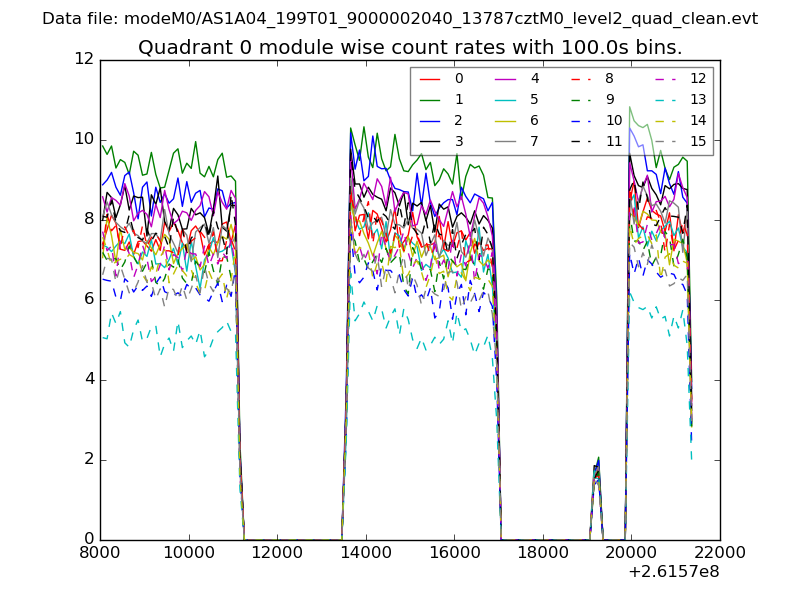
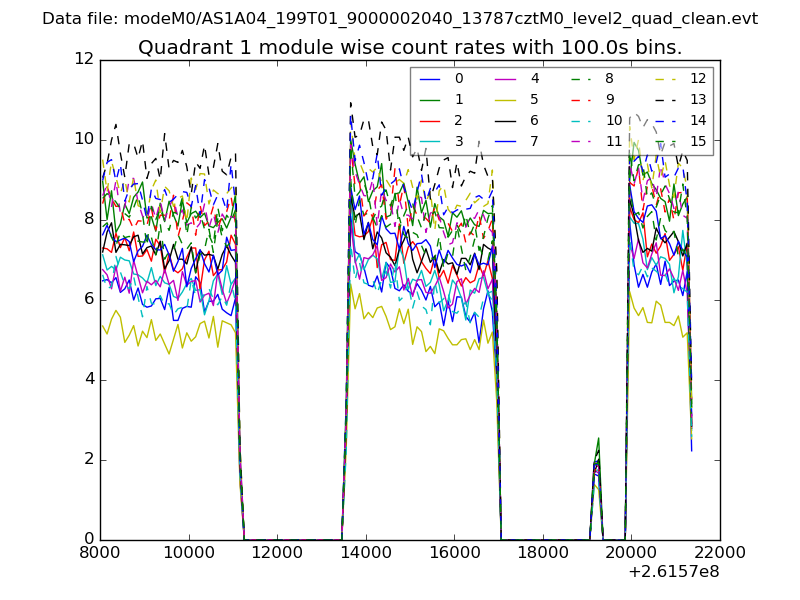
| Module-wise count rates for Quadrant A Data is divided into 100 sec bins |
 |
 |
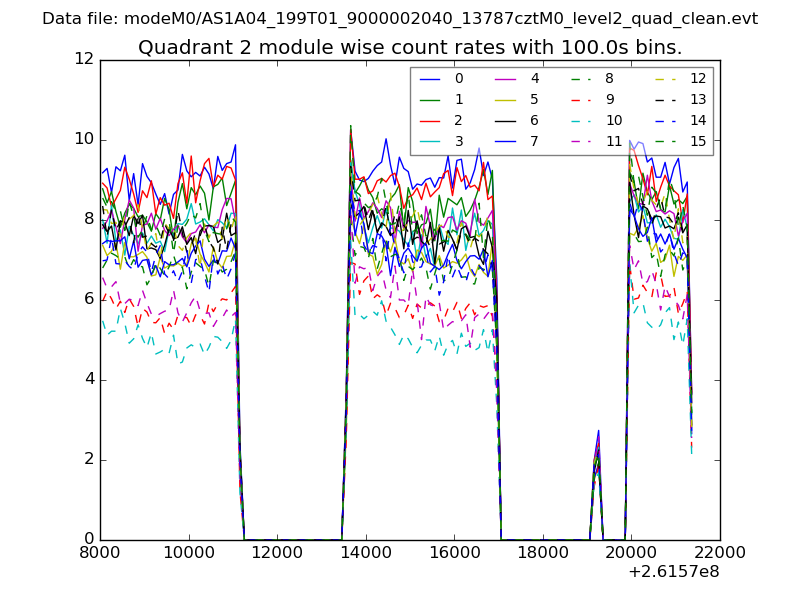
| Module-wise count rates for Quadrant B Data is divided into 100 sec bins |
 |
 |
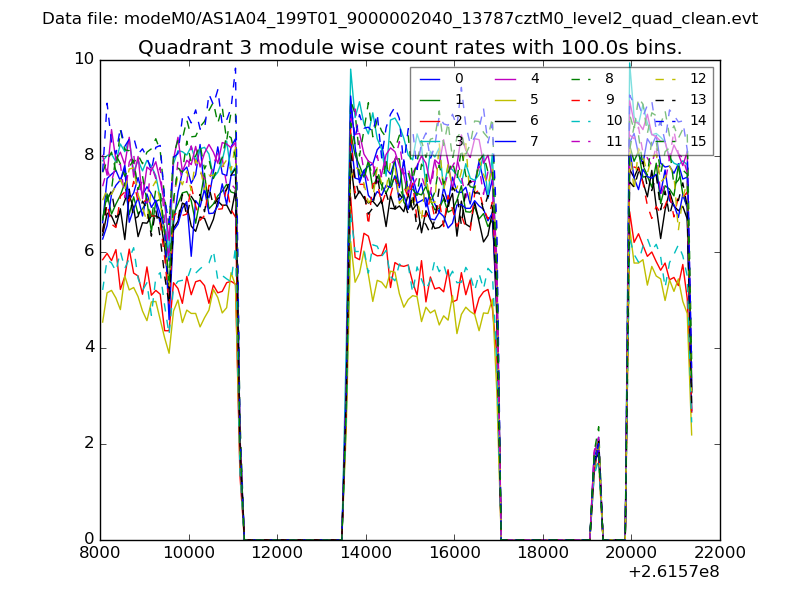
| Module-wise count rates for Quadrant C Data is divided into 100 sec bins |
 |
 |
| Module-wise count rates for Quadrant D Data is divided into 100 sec bins |
 |
 |
| Parameter | Plot |
|---|---|
| CZT HV Monitor | 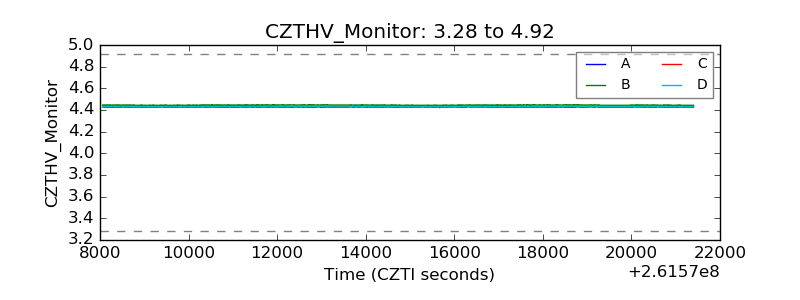 |
| D_VDD | 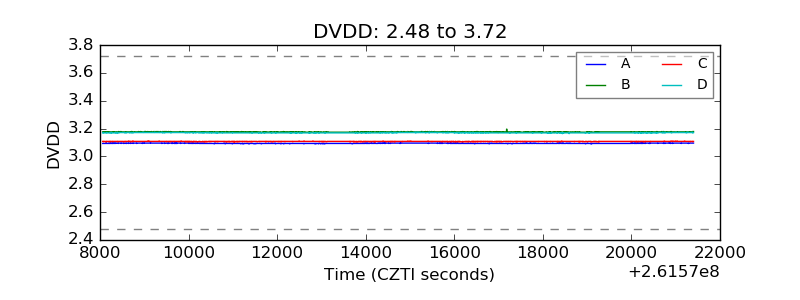 |
| Temperature 1 |  |
| Veto HV Monitor | 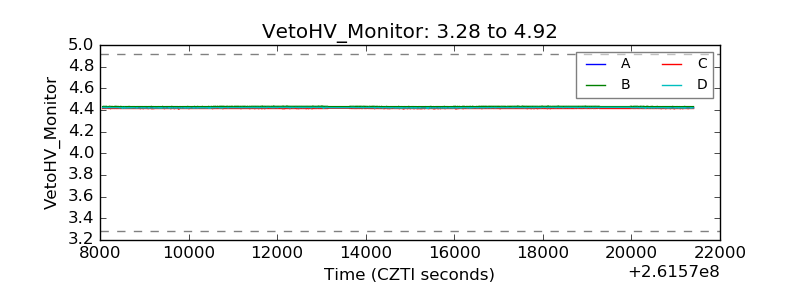 |
| Veto LLD | 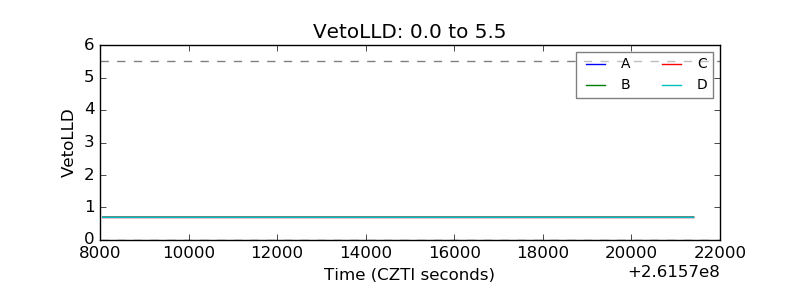 |
| Alpha Counter | 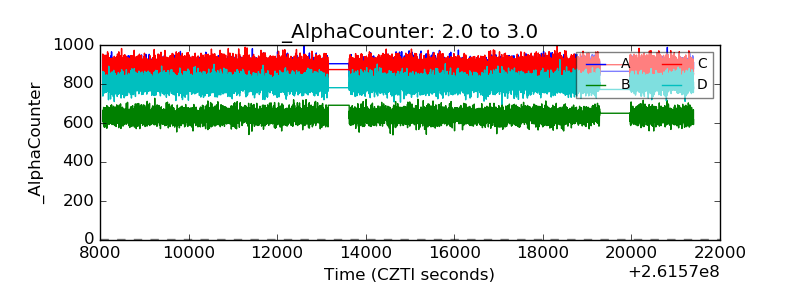 |
| _CPM_Rate | 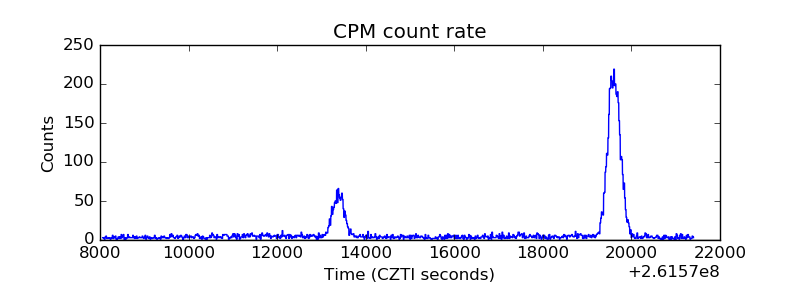 |
| CZT Counter | 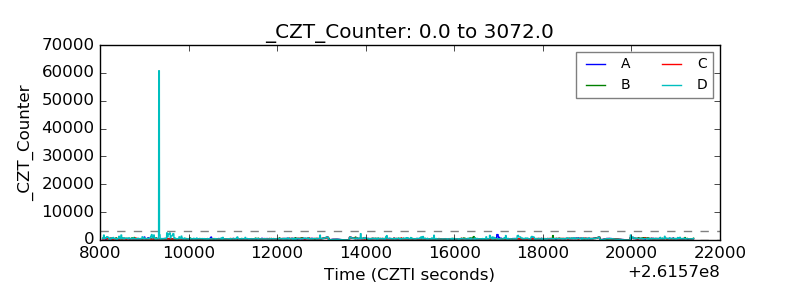 |
| +2.5 Volts monitor |  |
| +5 Volts monitor |  |
| _ROLL_ROT |  |
| _Roll_DEC | 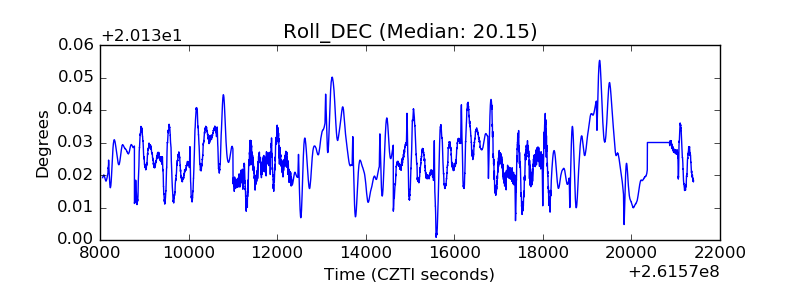 |
| _Roll_RA | 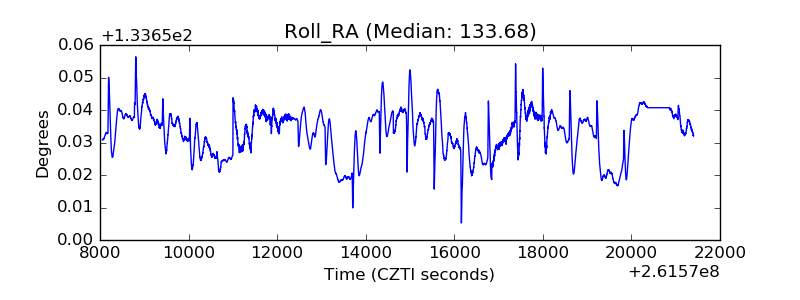 |
| Veto Counter | 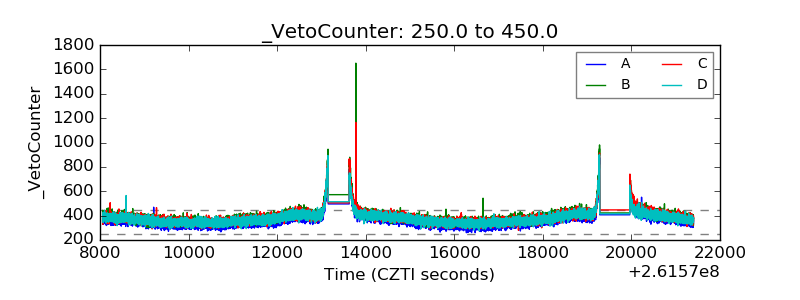 |