| Param | Original file | Final file |
|---|---|---|
| Filename | modeM0/AS1A04_199T01_9000002040_13788cztM0_level2.evt | modeM0/AS1A04_199T01_9000002040_13788cztM0_level2_quad_clean.evt |
| Size (bytes) | 478,817,280 | 91,912,320 |
| Size | 456.6 MB | 87.7 MB |
| Events in quadrant A | 3,276,642 | 581,195 |
| Events in quadrant B | 3,829,451 | 583,189 |
| Events in quadrant C | 3,247,276 | 579,428 |
| Events in quadrant D | 3,677,537 | 557,477 |
| Mode M9 | |||
|---|---|---|---|
| Quadrant | BADHDUFLAG | Total packets | Discarded packets |
| A | 0 | 8 | 0 |
| B | 0 | 8 | 0 |
| C | 0 | 8 | 0 |
| D | 0 | 8 | 0 |
| Mode SS | |||
|---|---|---|---|
| Quadrant | BADHDUFLAG | Total packets | Discarded packets |
| A | 0 | 142 | 0 |
| B | 0 | 142 | 0 |
| C | 0 | 142 | 0 |
| D | 0 | 142 | 0 |
| Mode M0 | |||
|---|---|---|---|
| Quadrant | BADHDUFLAG | Total packets | Discarded packets |
| A | 0 | 14295 | 3 |
| B | 0 | 15834 | 2 |
| C | 0 | 14149 | 2 |
| D | 0 | 15481 | 2 |
| Quadrant | Total seconds | Saturated seconds | Saturation percentage |
|---|---|---|---|
| A | 6915 | 42 | 0.607375% |
| B | 6915 | 139 | 2.010123% |
| C | 6915 | 20 | 0.289226% |
| D | 6915 | 68 | 0.983369% |
Noise dominated data is calculated using 1-second bins in cleaned event files. If a bin has >2000 counts, and if more than 50% of those come from <1% of pixels, then it is considered to be noise-dominated and hence unusable.
| Quadrant | # 1 sec bins | Bins with >0 counts | Bins with >2000 counts | High rate bins dominated by noise | Noise dominated (total time) | Noise dominated (detector-on time) | Marked lightcurve |
|---|---|---|---|---|---|---|---|
| A | 7771 | 6917 | 0 | 0 | 0.00% | 0.00% | 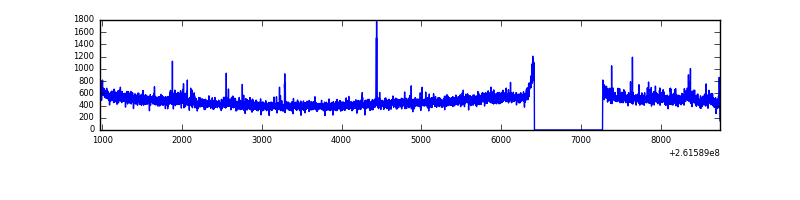 |
| B | 7771 | 6917 | 62 | 62 | 0.80% | 0.90% | 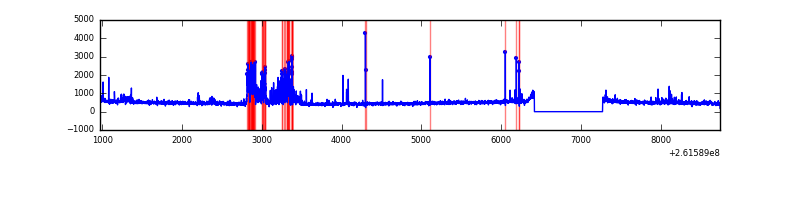 |
| C | 7771 | 6917 | 1 | 1 | 0.01% | 0.01% | 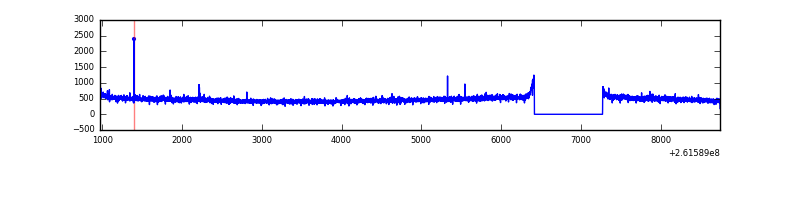 |
| D | 7771 | 6917 | 30 | 30 | 0.39% | 0.43% | 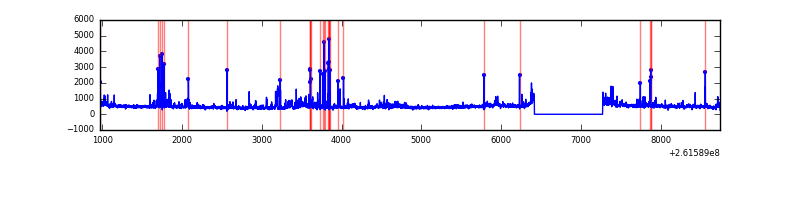 |
Top three noisy pixels from each quadrant. If the there are fewer than three noisy pixels in the level2.evt file, extra rows are filled as -1
| Pixel properties | Quadrant properties | ||||||
|---|---|---|---|---|---|---|---|
| Quadrant | DetID | PixID | Counts | Sigma | Mean | Median | Sigma |
| A | 0 | 23 | 53527 | 311.49 | 822 | 803 | 169.3 |
| A | 8 | 15 | 23943 | 136.71 | 822 | 803 | 169.3 |
| A | 0 | 226 | 10816 | 59.16 | 822 | 803 | 169.3 |
| B | 0 | 219 | 493026 | 3135.5 | 817 | 795 | 157.0 |
| B | 4 | 80 | 32997 | 205.13 | 817 | 795 | 157.0 |
| B | 4 | 173 | 25856 | 159.64 | 817 | 795 | 157.0 |
| C | 3 | 233 | 118915 | 628.41 | 801 | 803 | 188.0 |
| C | 14 | 234 | 6719 | 31.48 | 801 | 803 | 188.0 |
| C | 13 | 61 | 5754 | 26.34 | 801 | 803 | 188.0 |
| D | 1 | 52 | 465313 | 2390.97 | 799 | 778 | 194.3 |
| D | 13 | 249 | 134574 | 688.65 | 799 | 778 | 194.3 |
| D | 2 | 234 | 26353 | 131.64 | 799 | 778 | 194.3 |
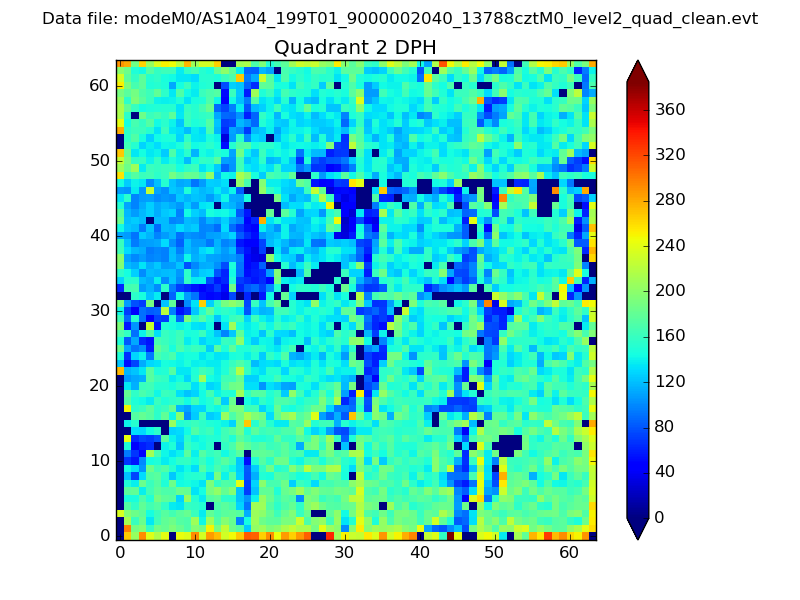
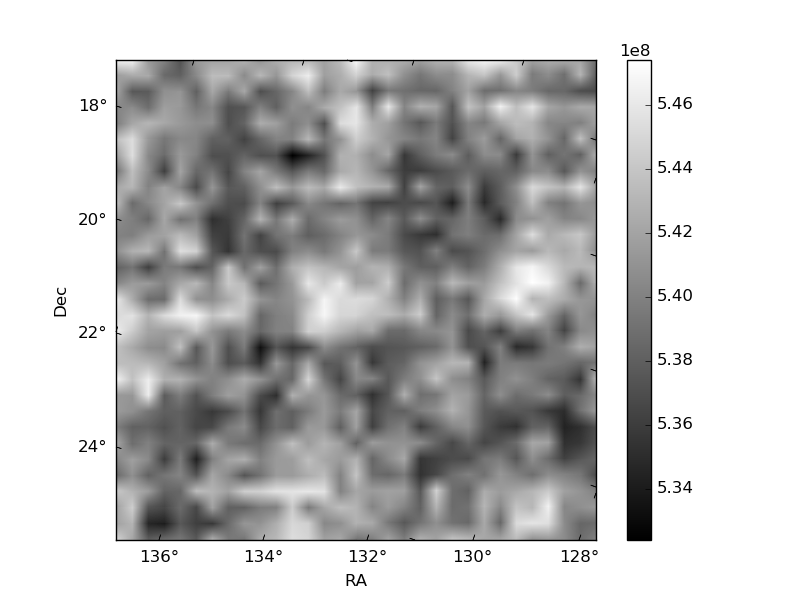
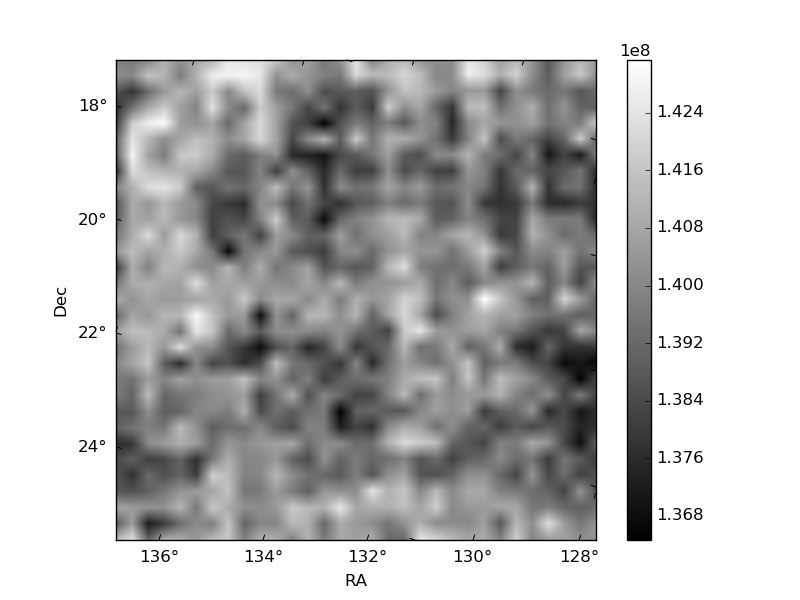
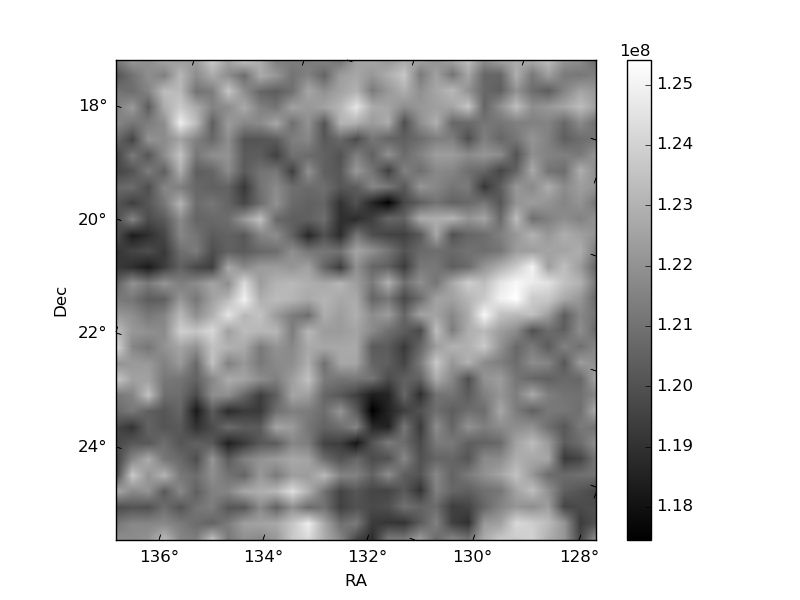
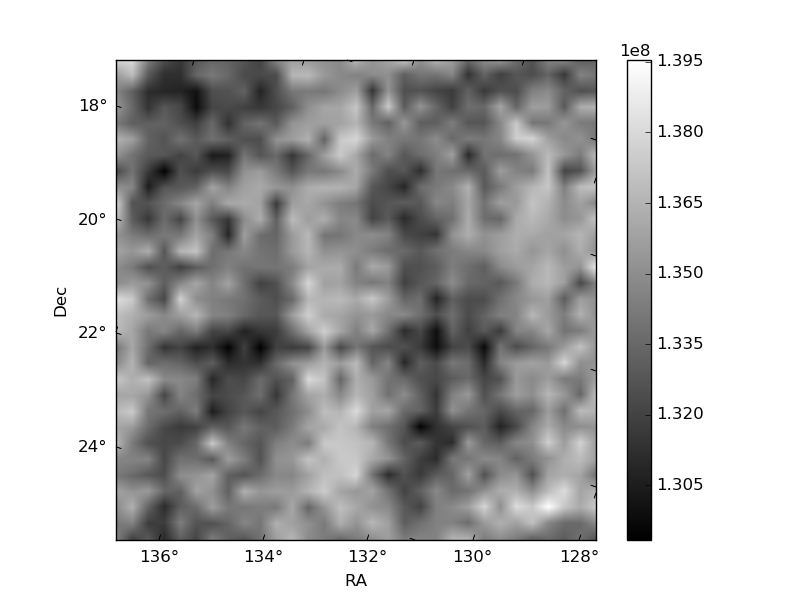
Histogram calculated using DETX and DETY for each event in the final _common_clean file
| Quadrant A | 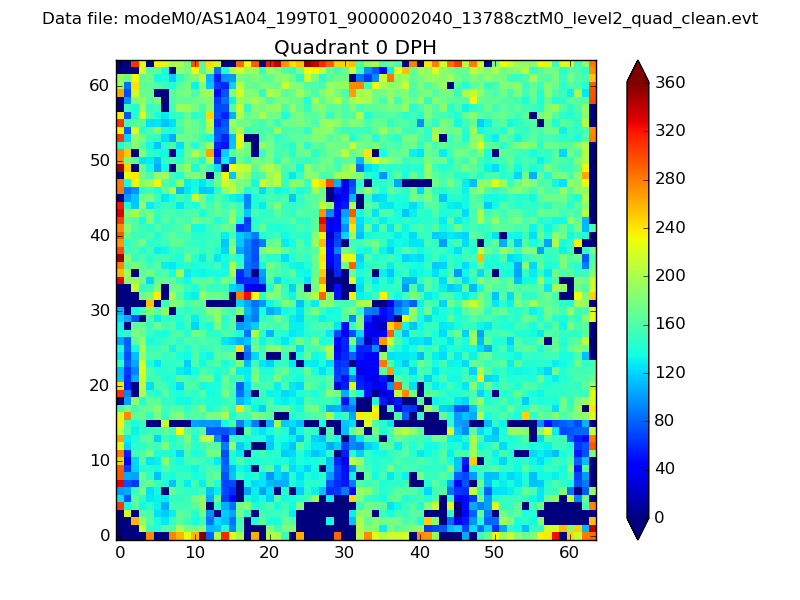 |
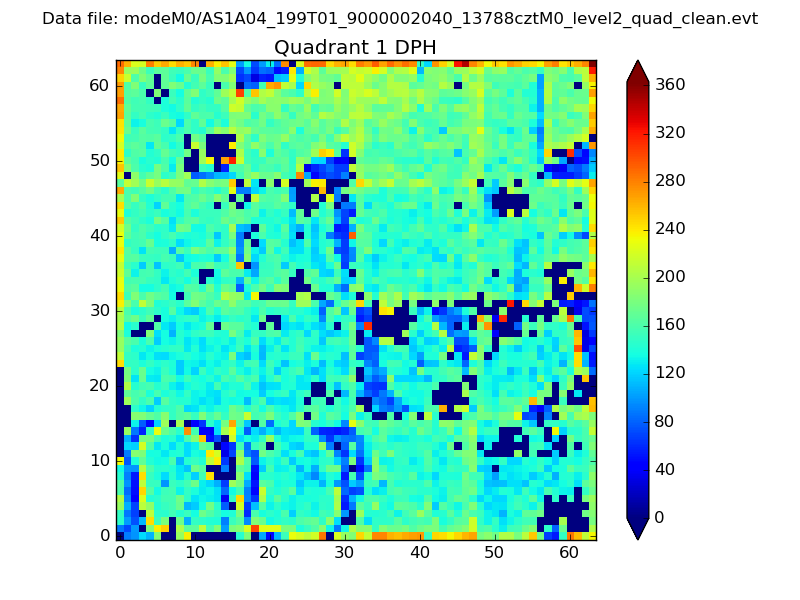 |
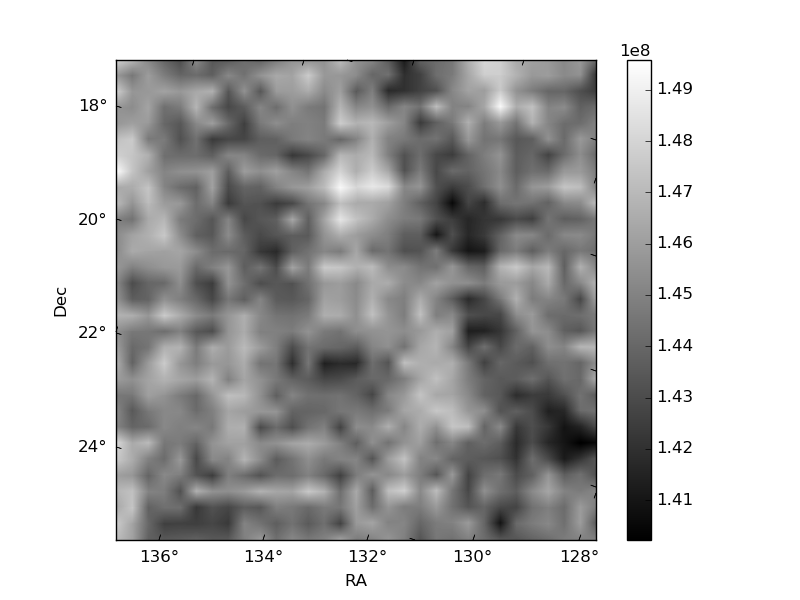
Quadrant B |
|---|---|---|---|
| Quadrant D | 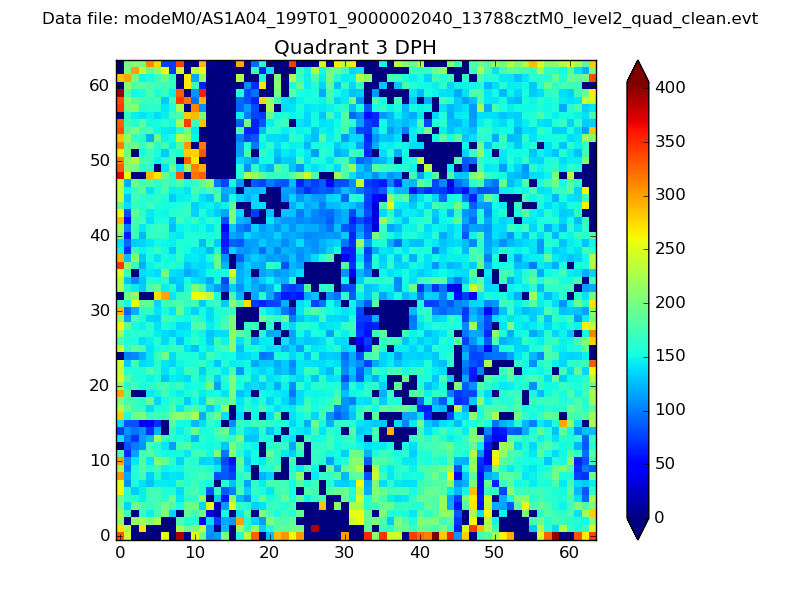 |
 |
Quadrant C |
| Plot type | Count rate plots | Images |
|---|---|---|
| Comparison with Poisson distribution Blue bars denote a histogram of data divided into 1 sec bins. Red curve is a Poisson curve with rate = median count rate of data. |
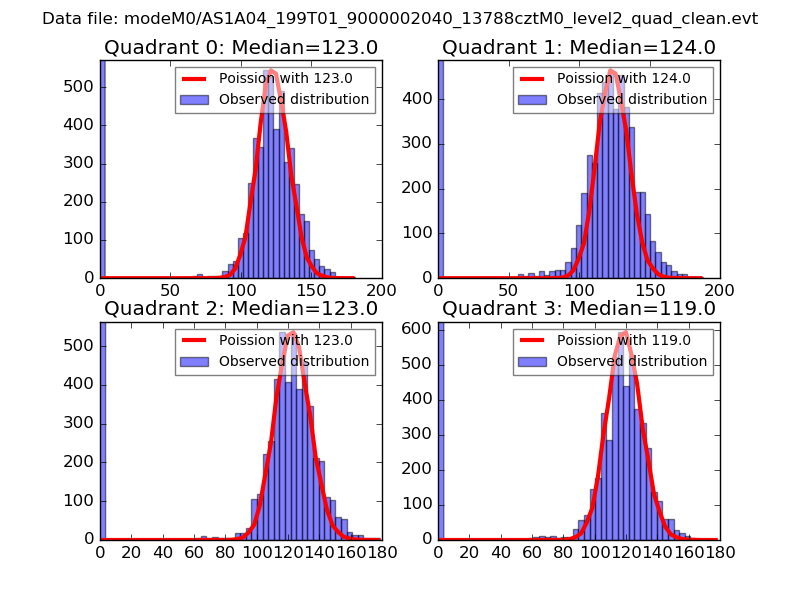 |
 |
| Quadrant-wise count rates Data is divided into 100 sec bins |
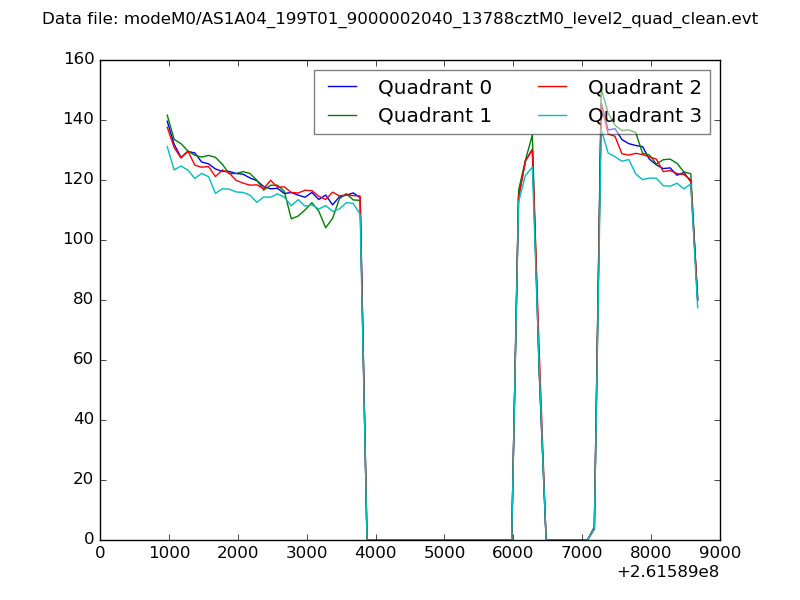 |
|
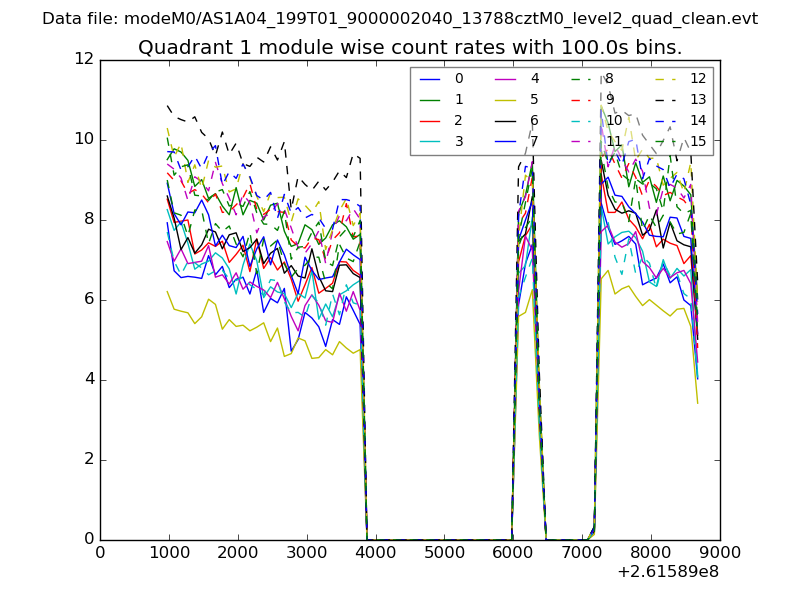
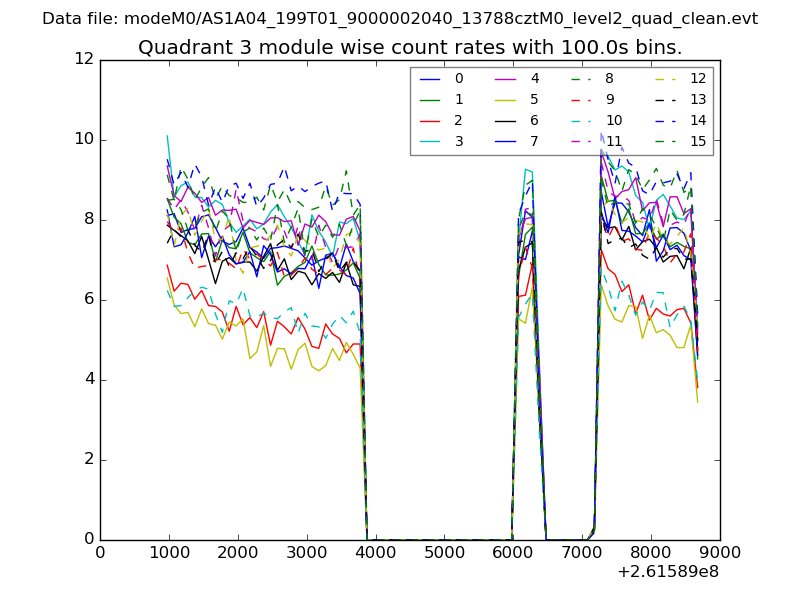
| Module-wise count rates for Quadrant A Data is divided into 100 sec bins |
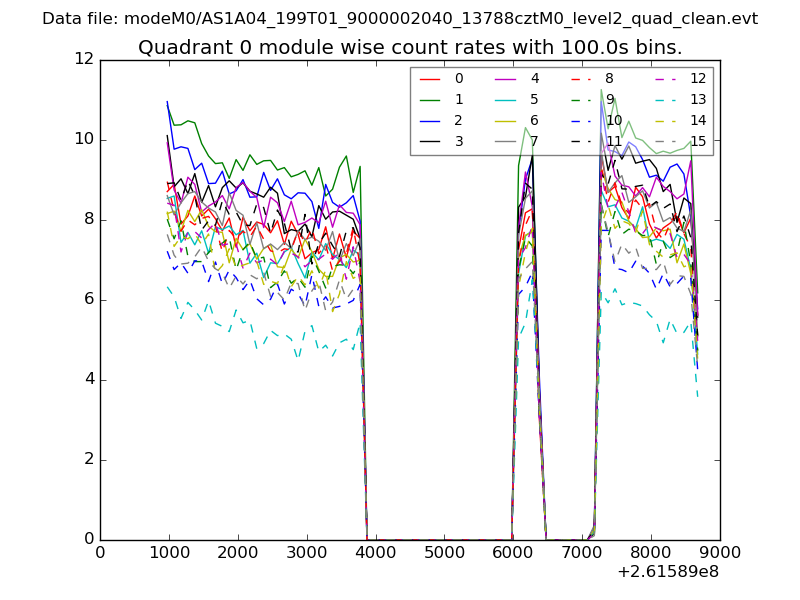 |
 |
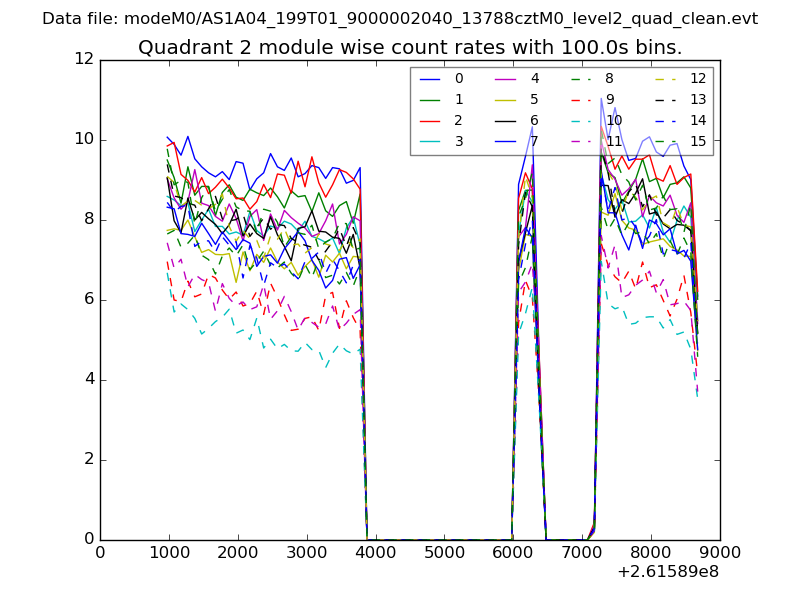
| Module-wise count rates for Quadrant B Data is divided into 100 sec bins |
 |
 |
| Module-wise count rates for Quadrant C Data is divided into 100 sec bins |
 |
 |
| Module-wise count rates for Quadrant D Data is divided into 100 sec bins |
 |
 |
| Parameter | Plot |
|---|---|
| CZT HV Monitor | 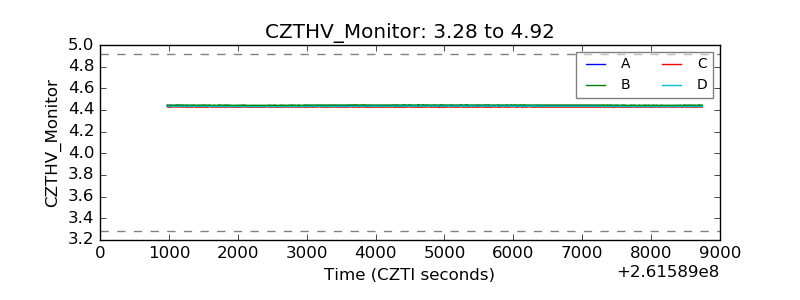 |
| D_VDD | 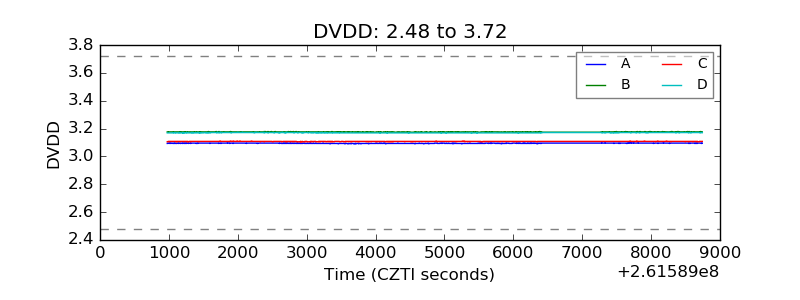 |
| Temperature 1 | 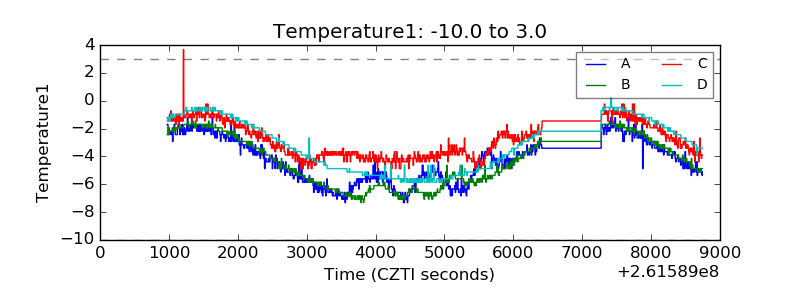 |
| Veto HV Monitor | 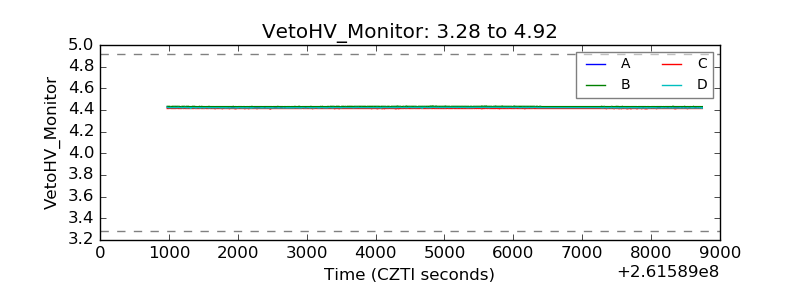 |
| Veto LLD | 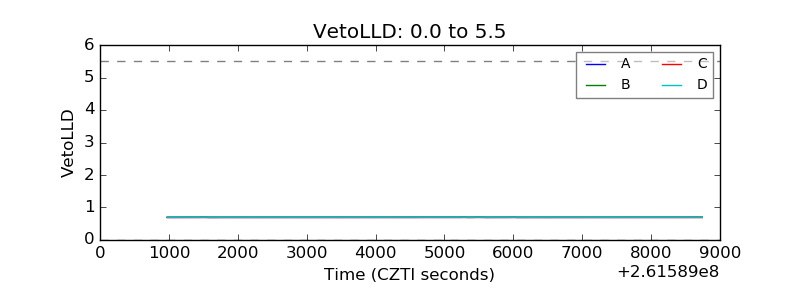 |
| Alpha Counter | 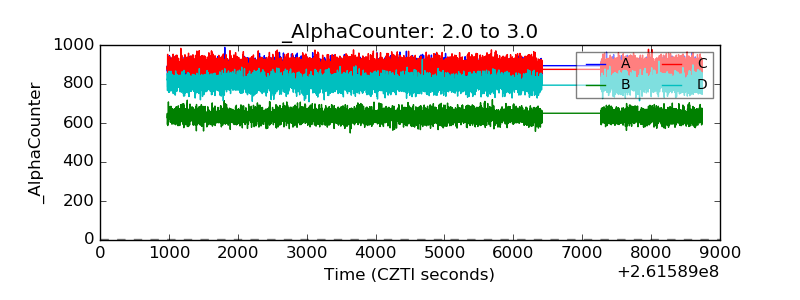 |
| _CPM_Rate |  |
| CZT Counter | 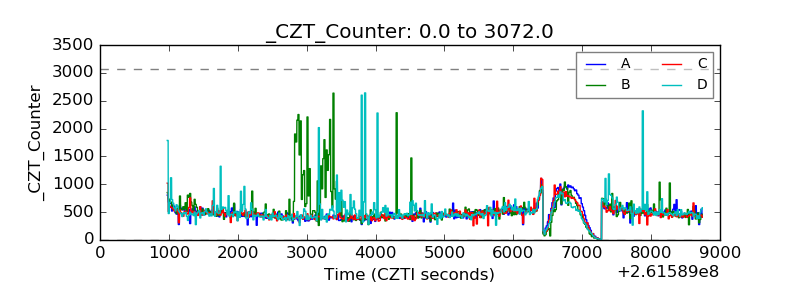 |
| +2.5 Volts monitor |  |
| +5 Volts monitor |  |
| _ROLL_ROT | 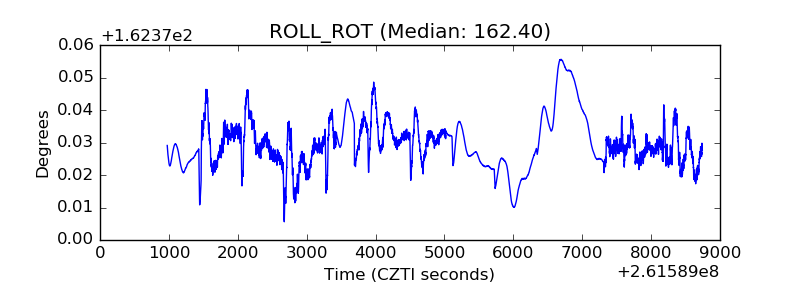 |
| _Roll_DEC | 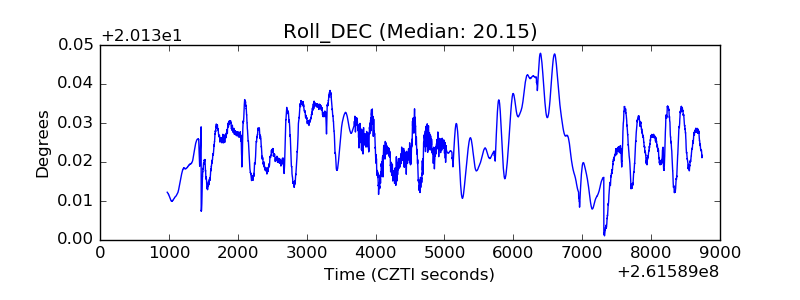 |
| _Roll_RA | 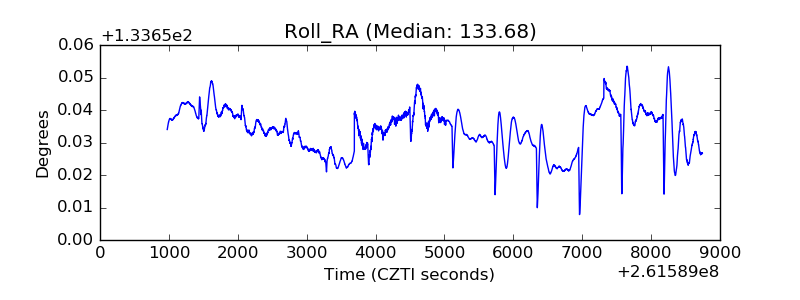 |
| Veto Counter | 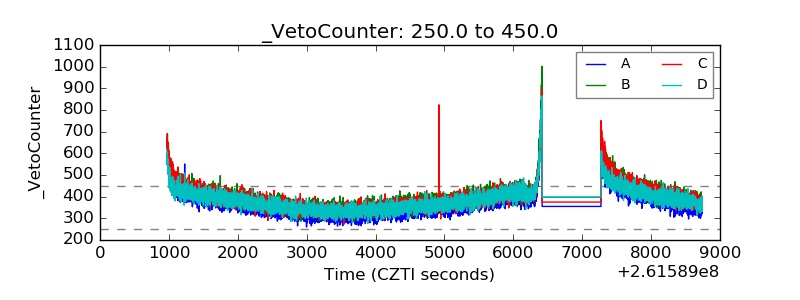 |