| Param | Original file | Final file |
|---|---|---|
| Filename | modeM0/AS1A04_199T01_9000002040_13791cztM0_level2.evt | modeM0/AS1A04_199T01_9000002040_13791cztM0_level2_quad_clean.evt |
| Size (bytes) | 443,822,400 | 91,100,160 |
| Size | 423.3 MB | 86.9 MB |
| Events in quadrant A | 3,119,589 | 580,058 |
| Events in quadrant B | 3,316,581 | 593,972 |
| Events in quadrant C | 3,152,710 | 577,634 |
| Events in quadrant D | 3,410,491 | 553,915 |
| Mode M9 | |||
|---|---|---|---|
| Quadrant | BADHDUFLAG | Total packets | Discarded packets |
| A | 0 | 16 | 0 |
| B | 0 | 16 | 0 |
| C | 0 | 16 | 0 |
| D | 0 | 17 | 0 |
| Mode SS | |||
|---|---|---|---|
| Quadrant | BADHDUFLAG | Total packets | Discarded packets |
| A | 0 | 132 | 0 |
| B | 0 | 132 | 0 |
| C | 0 | 132 | 0 |
| D | 0 | 132 | 0 |
| Mode M0 | |||
|---|---|---|---|
| Quadrant | BADHDUFLAG | Total packets | Discarded packets |
| A | 0 | 13519 | 3 |
| B | 0 | 14056 | 2 |
| C | 0 | 13506 | 2 |
| D | 0 | 14462 | 2 |
| Quadrant | Total seconds | Saturated seconds | Saturation percentage |
|---|---|---|---|
| A | 6500 | 42 | 0.646154% |
| B | 6500 | 65 | 1.000000% |
| C | 6500 | 19 | 0.292308% |
| D | 6500 | 64 | 0.984615% |
Noise dominated data is calculated using 1-second bins in cleaned event files. If a bin has >2000 counts, and if more than 50% of those come from <1% of pixels, then it is considered to be noise-dominated and hence unusable.
| Quadrant | # 1 sec bins | Bins with >0 counts | Bins with >2000 counts | High rate bins dominated by noise | Noise dominated (total time) | Noise dominated (detector-on time) | Marked lightcurve |
|---|---|---|---|---|---|---|---|
| A | 7636 | 6502 | 7 | 7 | 0.09% | 0.11% | 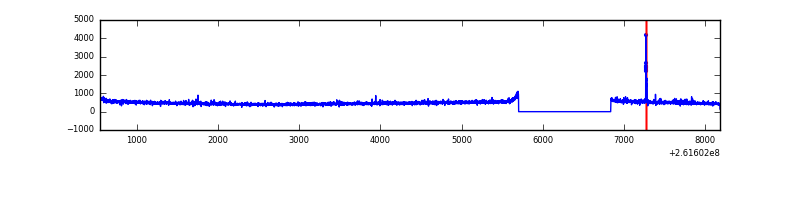 |
| B | 7636 | 6502 | 12 | 12 | 0.16% | 0.18% | 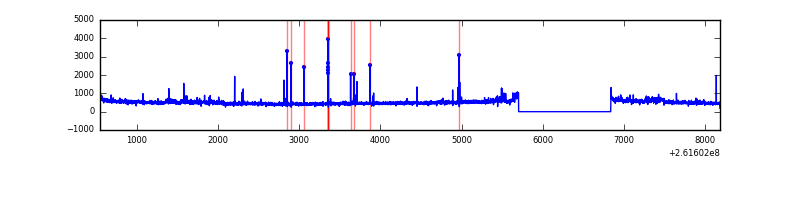 |
| C | 7636 | 6502 | 7 | 7 | 0.09% | 0.11% | 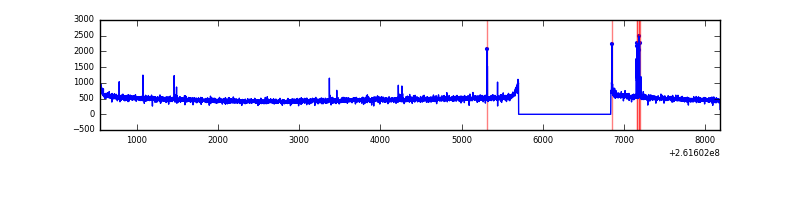 |
| D | 7636 | 6502 | 39 | 39 | 0.51% | 0.60% | 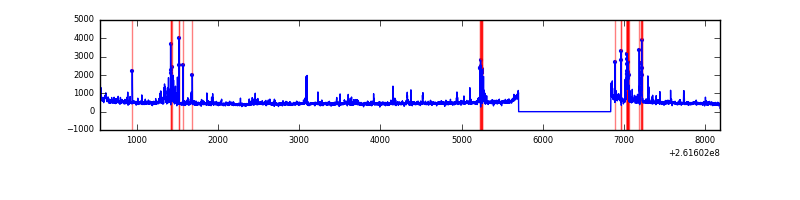 |
Top three noisy pixels from each quadrant. If the there are fewer than three noisy pixels in the level2.evt file, extra rows are filled as -1
| Pixel properties | Quadrant properties | ||||||
|---|---|---|---|---|---|---|---|
| Quadrant | DetID | PixID | Counts | Sigma | Mean | Median | Sigma |
| A | 15 | 69 | 29093 | 175.72 | 787 | 770 | 161.2 |
| A | 1 | 162 | 27289 | 164.53 | 787 | 770 | 161.2 |
| A | 1 | 178 | 10049 | 57.57 | 787 | 770 | 161.2 |
| B | 0 | 219 | 130393 | 857.02 | 793 | 773 | 151.2 |
| B | 4 | 80 | 44558 | 289.5 | 793 | 773 | 151.2 |
| B | 4 | 173 | 21516 | 137.15 | 793 | 773 | 151.2 |
| C | 3 | 233 | 104610 | 578.27 | 770 | 774 | 179.6 |
| C | 14 | 234 | 34357 | 187.03 | 770 | 774 | 179.6 |
| C | 13 | 61 | 5599 | 26.87 | 770 | 774 | 179.6 |
| D | 13 | 249 | 239628 | 1213.87 | 758 | 740 | 196.8 |
| D | 1 | 52 | 223693 | 1132.89 | 758 | 740 | 196.8 |
| D | 10 | 157 | 47219 | 236.17 | 758 | 740 | 196.8 |
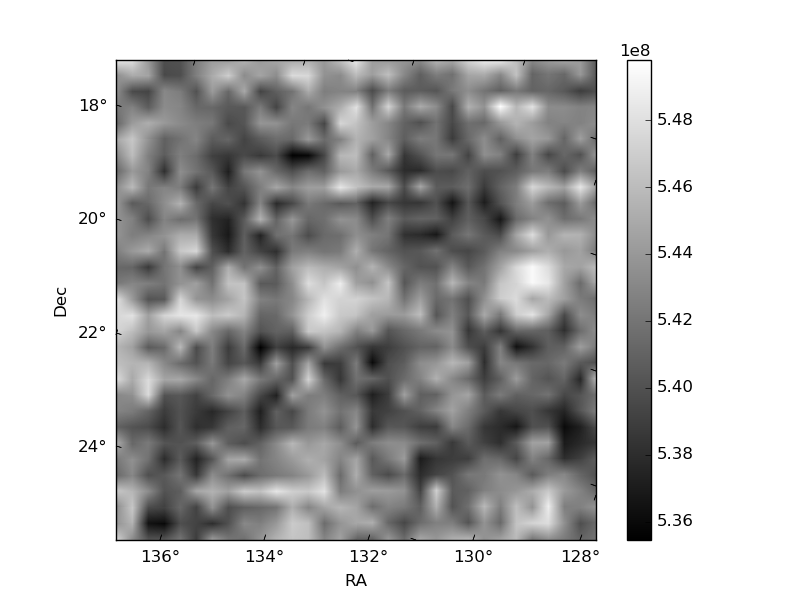
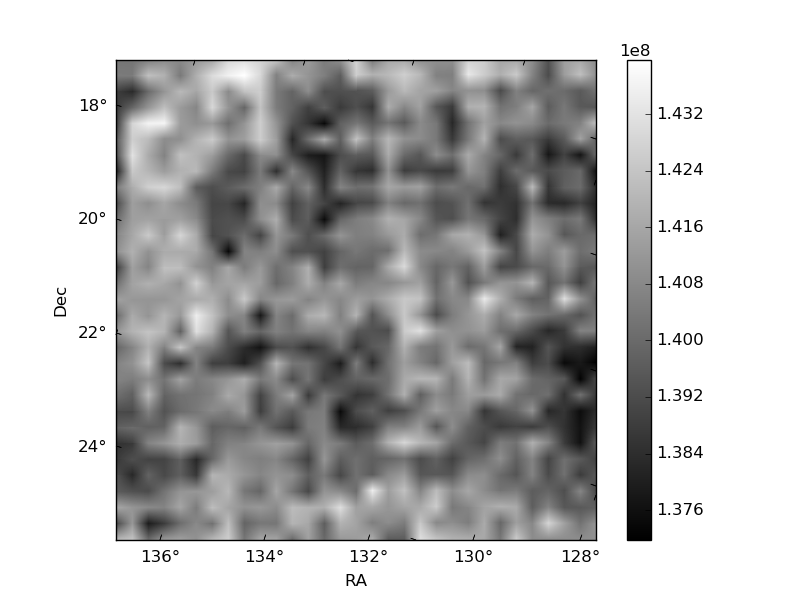
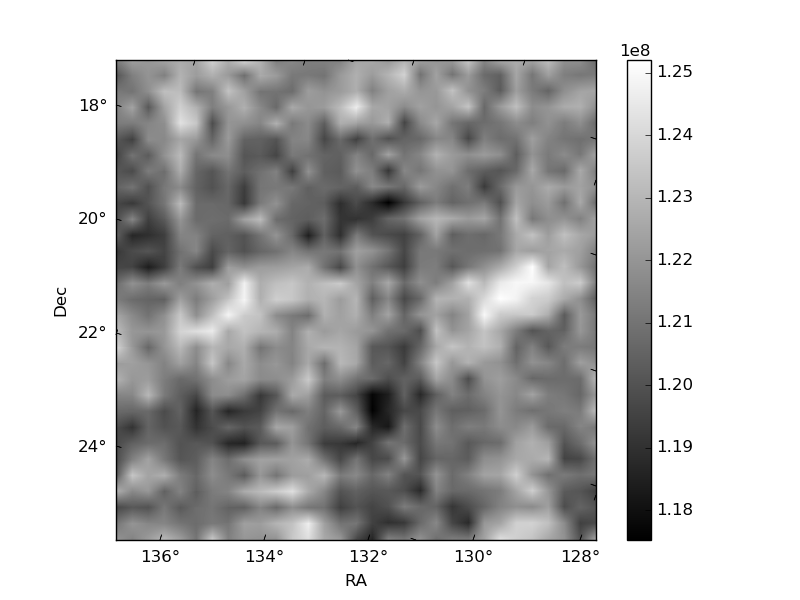
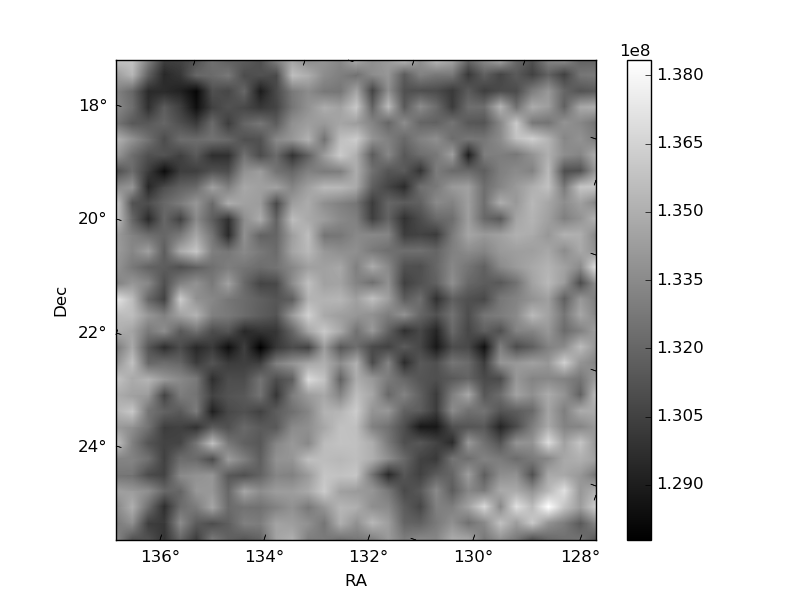
Histogram calculated using DETX and DETY for each event in the final _common_clean file
| Quadrant A | 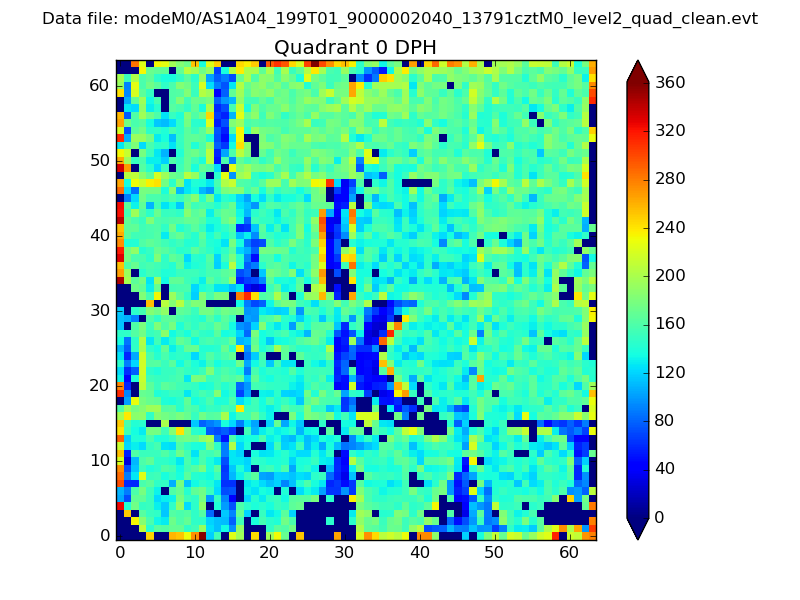 |
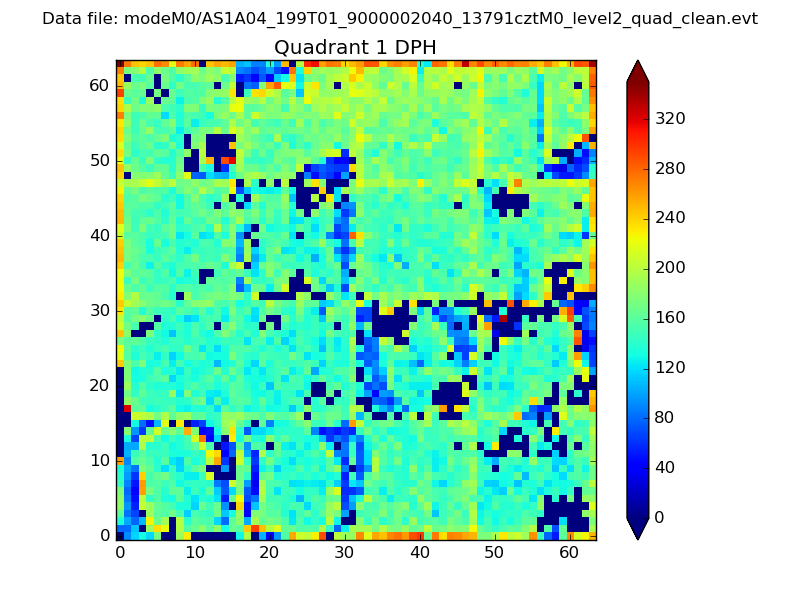 |
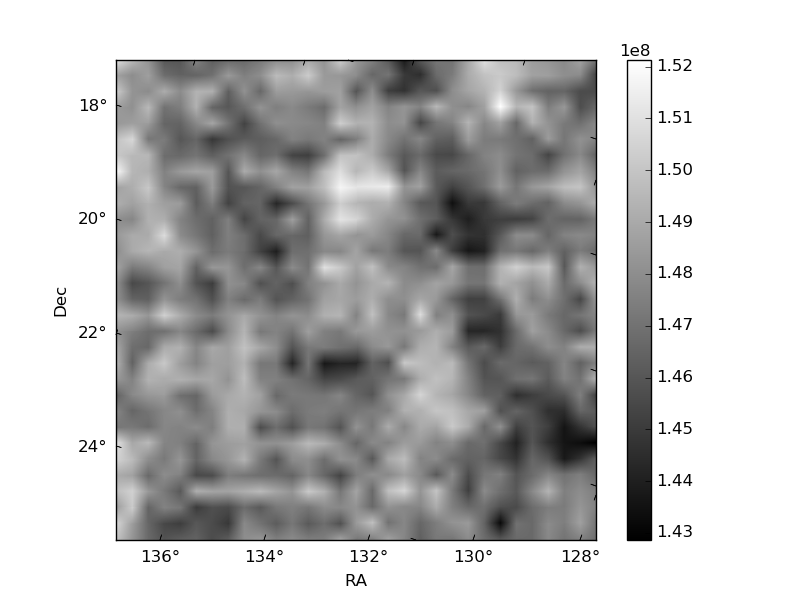
Quadrant B |
|---|---|---|---|
| Quadrant D | 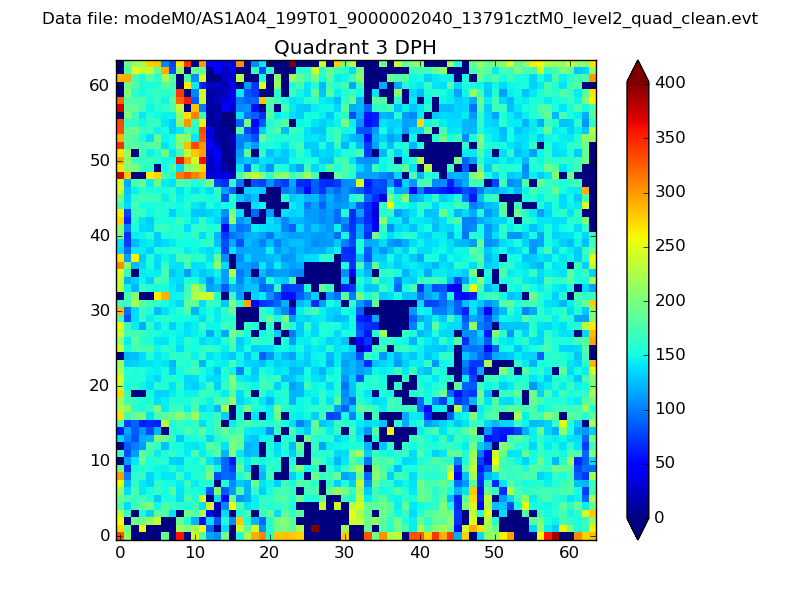 |
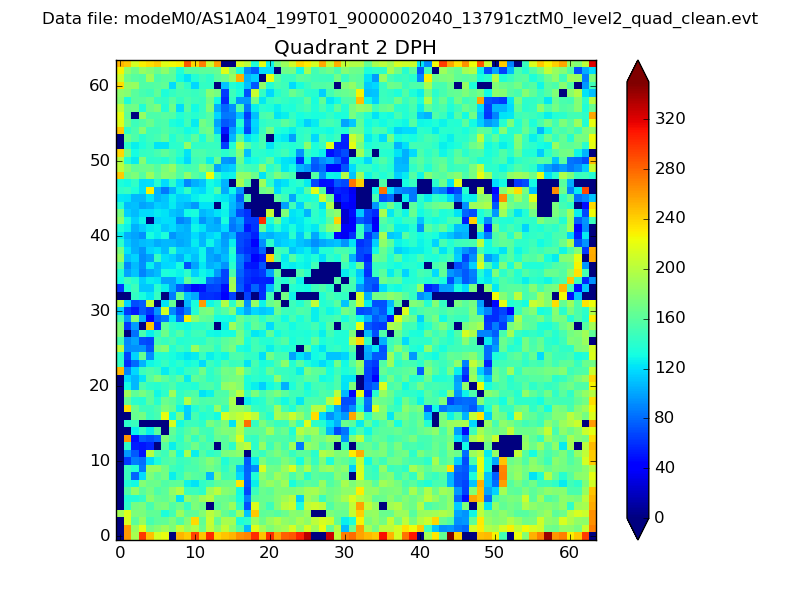 |
Quadrant C |
| Plot type | Count rate plots | Images |
|---|---|---|
| Comparison with Poisson distribution Blue bars denote a histogram of data divided into 1 sec bins. Red curve is a Poisson curve with rate = median count rate of data. |
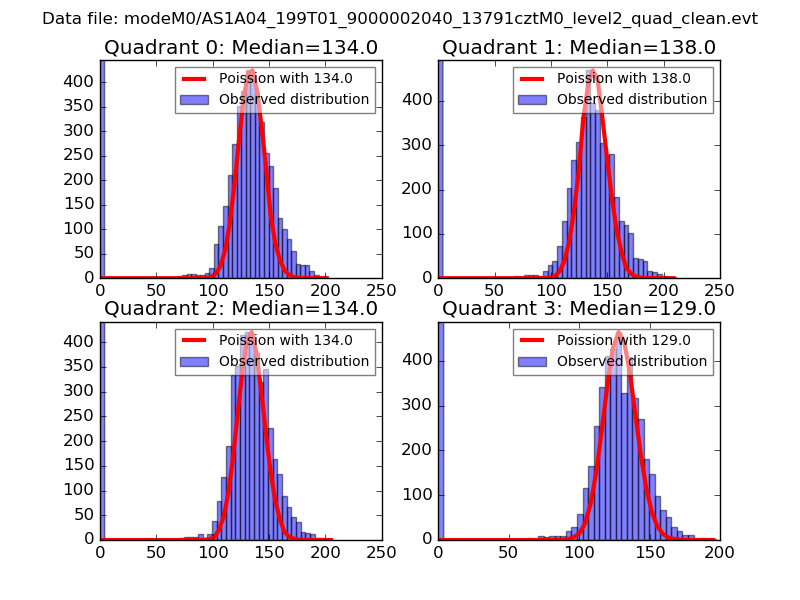 |
 |
| Quadrant-wise count rates Data is divided into 100 sec bins |
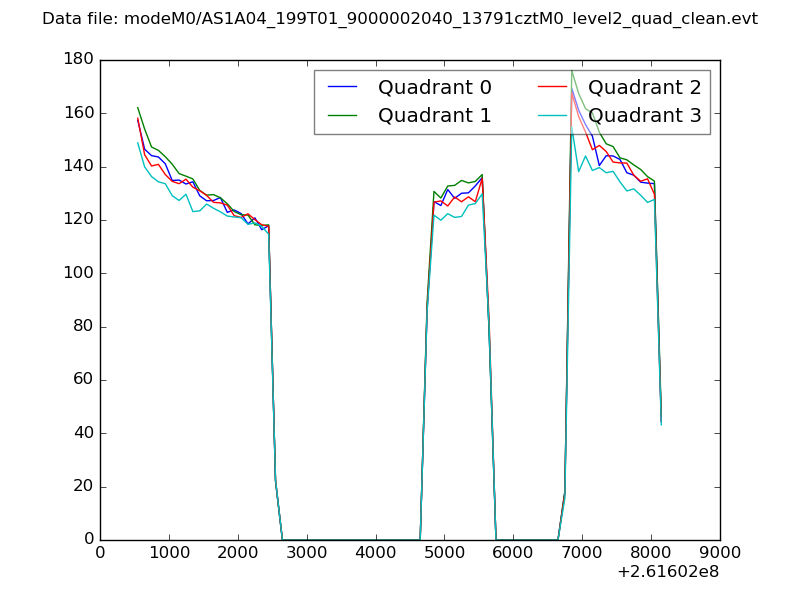 |
|
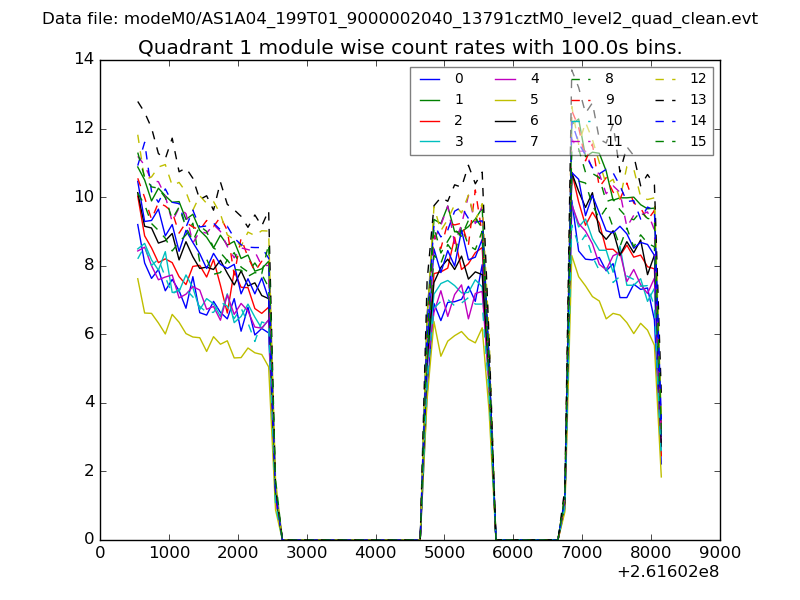
| Module-wise count rates for Quadrant A Data is divided into 100 sec bins |
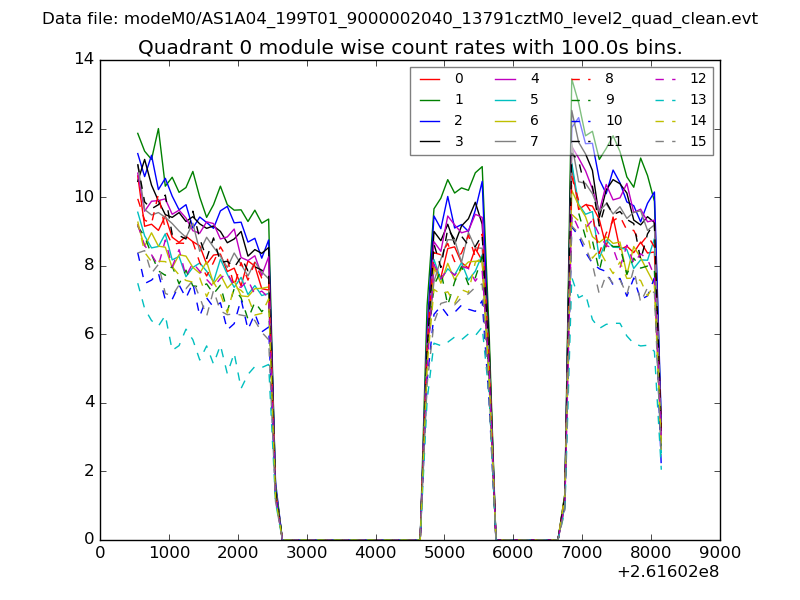 |
 |
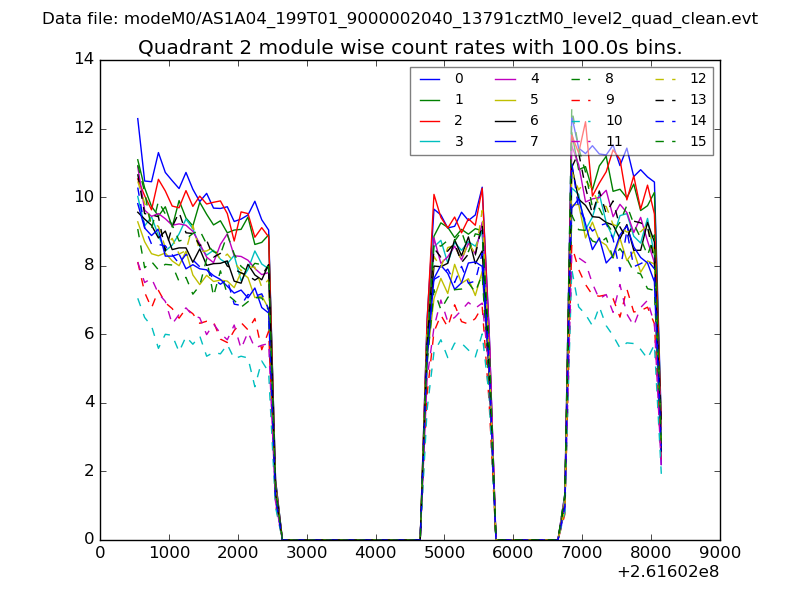
| Module-wise count rates for Quadrant B Data is divided into 100 sec bins |
 |
 |
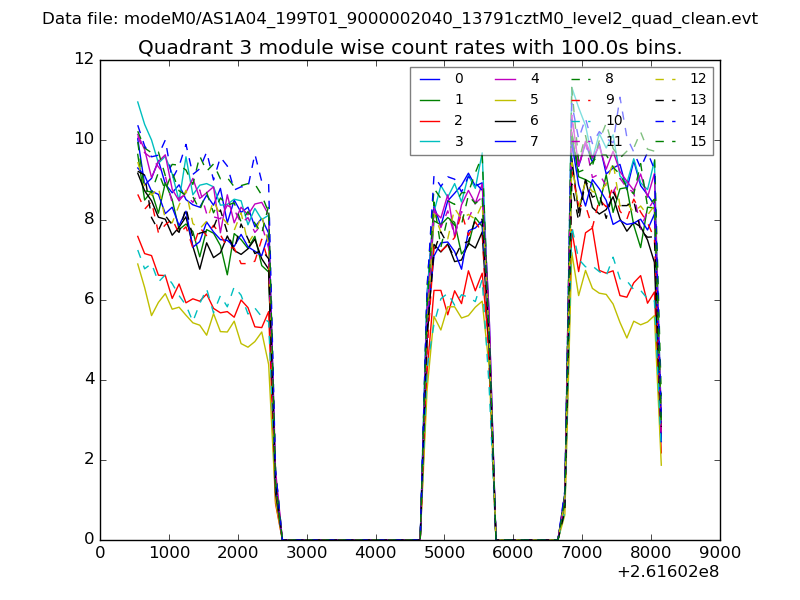
| Module-wise count rates for Quadrant C Data is divided into 100 sec bins |
 |
 |
| Module-wise count rates for Quadrant D Data is divided into 100 sec bins |
 |
 |
| Parameter | Plot |
|---|---|
| CZT HV Monitor | 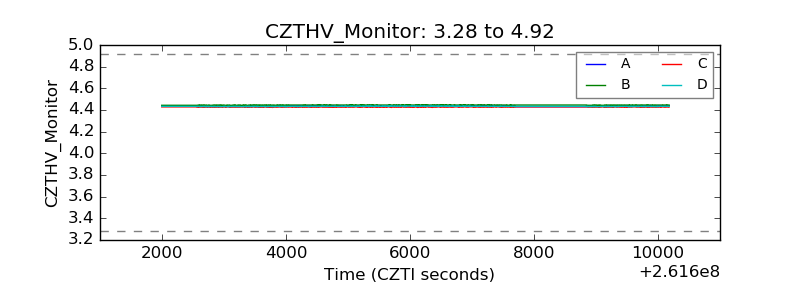 |
| D_VDD | 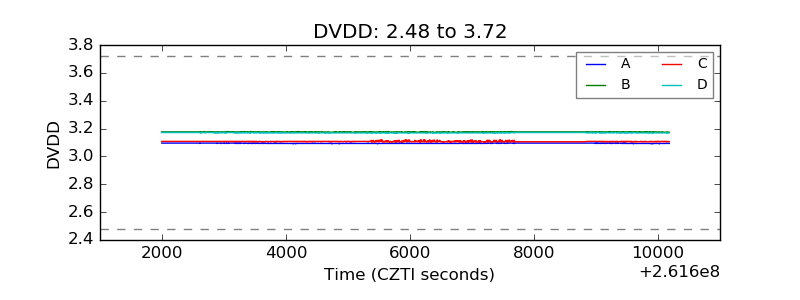 |
| Temperature 1 | 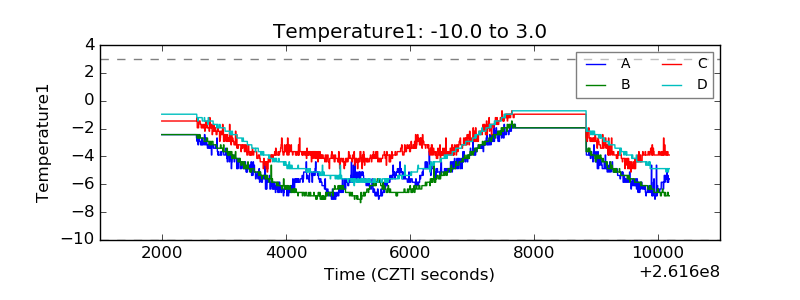 |
| Veto HV Monitor | 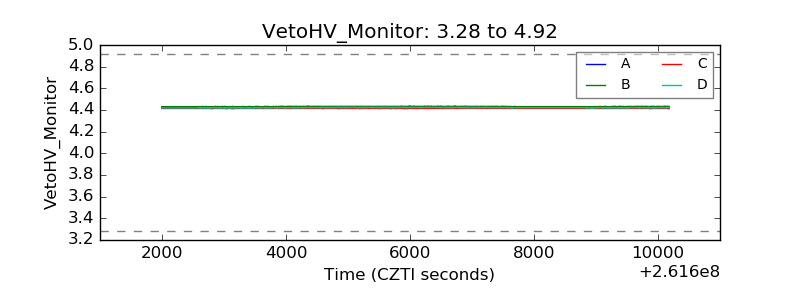 |
| Veto LLD | 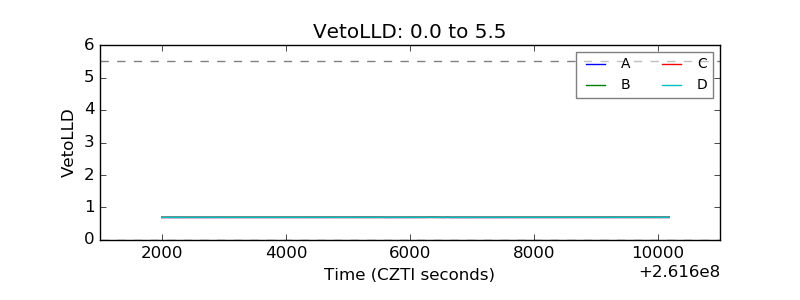 |
| Alpha Counter | 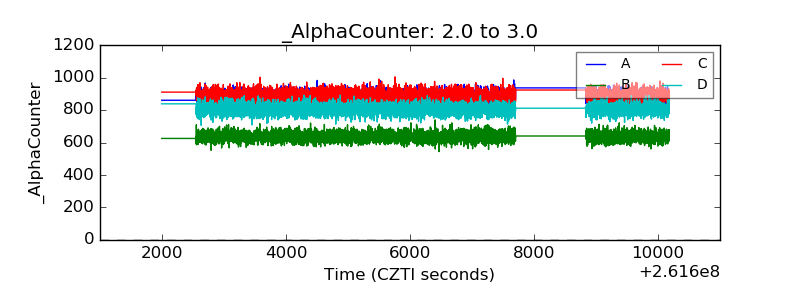 |
| _CPM_Rate | 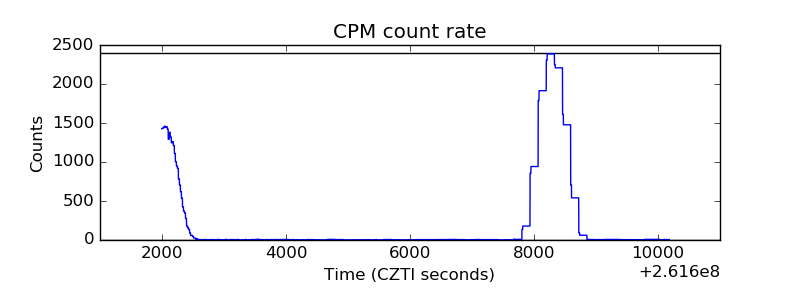 |
| CZT Counter | 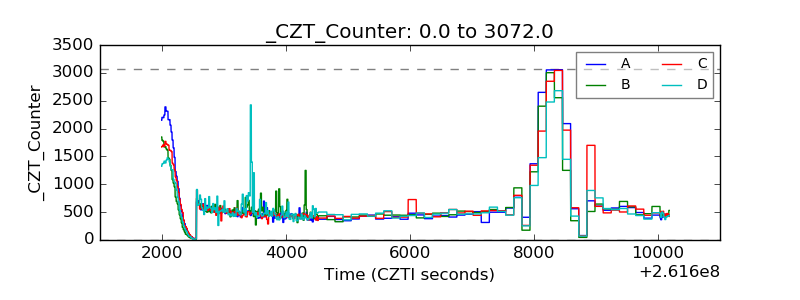 |
| +2.5 Volts monitor |  |
| +5 Volts monitor |  |
| _ROLL_ROT | 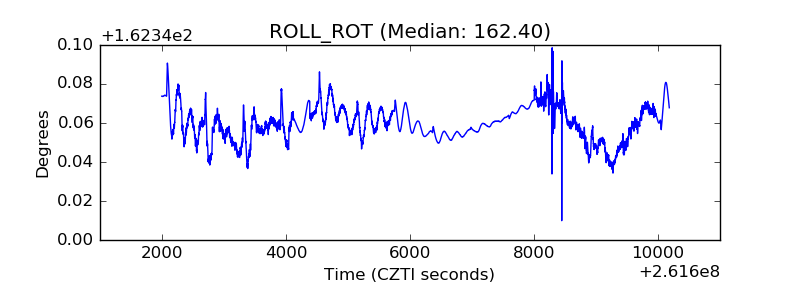 |
| _Roll_DEC | 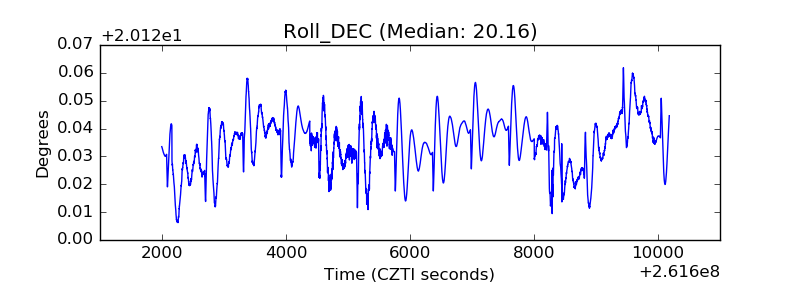 |
| _Roll_RA | 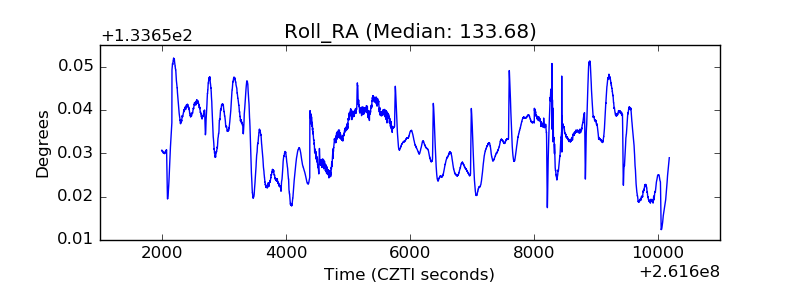 |
| Veto Counter | 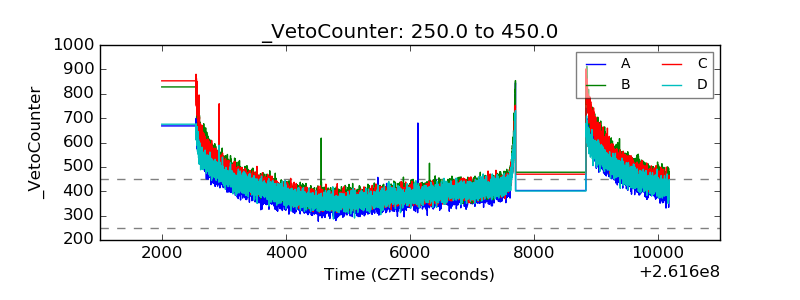 |