| Param | Original file | Final file |
|---|---|---|
| Filename | modeM0/AS1A04_199T01_9000002040_13792cztM0_level2.evt | modeM0/AS1A04_199T01_9000002040_13792cztM0_level2_quad_clean.evt |
| Size (bytes) | 457,830,720 | 92,520,000 |
| Size | 436.6 MB | 88.2 MB |
| Events in quadrant A | 3,235,433 | 593,194 |
| Events in quadrant B | 3,390,529 | 609,918 |
| Events in quadrant C | 3,216,616 | 589,580 |
| Events in quadrant D | 3,582,785 | 557,298 |
| Mode M9 | |||
|---|---|---|---|
| Quadrant | BADHDUFLAG | Total packets | Discarded packets |
| A | 0 | 24 | 0 |
| B | 0 | 24 | 0 |
| C | 0 | 24 | 0 |
| D | 0 | 24 | 0 |
| Mode SS | |||
|---|---|---|---|
| Quadrant | BADHDUFLAG | Total packets | Discarded packets |
| A | 0 | 134 | 0 |
| B | 0 | 134 | 0 |
| C | 0 | 134 | 0 |
| D | 0 | 134 | 0 |
| Mode M0 | |||
|---|---|---|---|
| Quadrant | BADHDUFLAG | Total packets | Discarded packets |
| A | 0 | 13727 | 3 |
| B | 0 | 14242 | 2 |
| C | 0 | 13577 | 2 |
| D | 0 | 15096 | 2 |
| Quadrant | Total seconds | Saturated seconds | Saturation percentage |
|---|---|---|---|
| A | 6477 | 68 | 1.049869% |
| B | 6477 | 81 | 1.250579% |
| C | 6477 | 36 | 0.555813% |
| D | 6477 | 71 | 1.096187% |
Noise dominated data is calculated using 1-second bins in cleaned event files. If a bin has >2000 counts, and if more than 50% of those come from <1% of pixels, then it is considered to be noise-dominated and hence unusable.
| Quadrant | # 1 sec bins | Bins with >0 counts | Bins with >2000 counts | High rate bins dominated by noise | Noise dominated (total time) | Noise dominated (detector-on time) | Marked lightcurve |
|---|---|---|---|---|---|---|---|
| A | 8848 | 6480 | 7 | 7 | 0.08% | 0.11% | 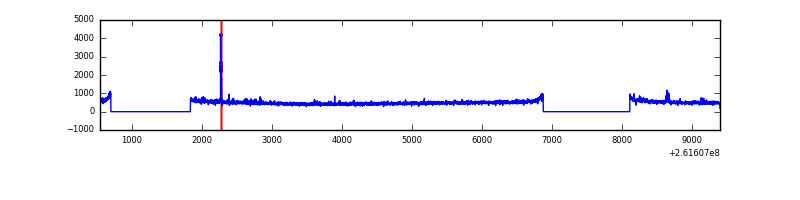 |
| B | 8848 | 6480 | 4 | 4 | 0.05% | 0.06% | 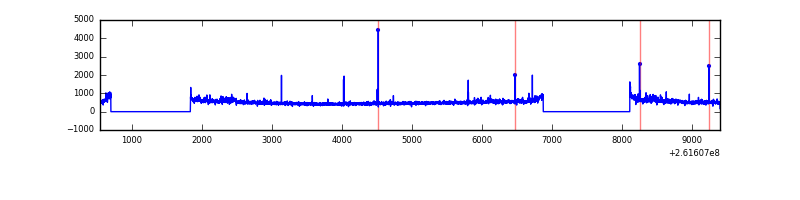 |
| C | 8848 | 6480 | 6 | 6 | 0.07% | 0.09% | 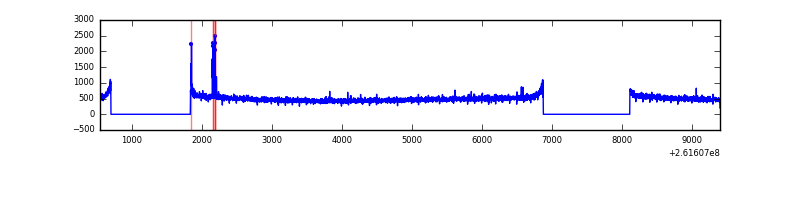 |
| D | 8848 | 6480 | 35 | 35 | 0.40% | 0.54% | 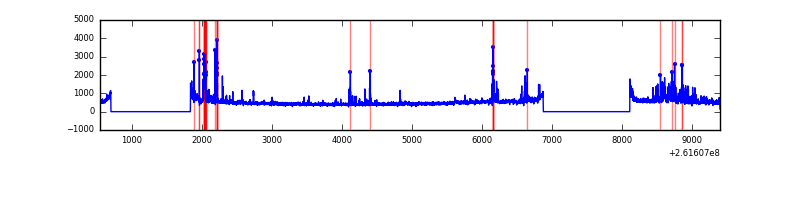 |
Top three noisy pixels from each quadrant. If the there are fewer than three noisy pixels in the level2.evt file, extra rows are filled as -1
| Pixel properties | Quadrant properties | ||||||
|---|---|---|---|---|---|---|---|
| Quadrant | DetID | PixID | Counts | Sigma | Mean | Median | Sigma |
| A | 15 | 69 | 29407 | 172.55 | 816 | 798 | 165.8 |
| A | 15 | 157 | 21073 | 122.28 | 816 | 798 | 165.8 |
| A | 1 | 162 | 20986 | 121.76 | 816 | 798 | 165.8 |
| B | 0 | 219 | 117739 | 750.59 | 822 | 799 | 155.8 |
| B | 4 | 173 | 24234 | 150.42 | 822 | 799 | 155.8 |
| B | 4 | 80 | 21108 | 130.36 | 822 | 799 | 155.8 |
| C | 3 | 233 | 84317 | 450.05 | 797 | 802 | 185.6 |
| C | 14 | 234 | 25831 | 134.88 | 797 | 802 | 185.6 |
| C | 13 | 61 | 5763 | 26.73 | 797 | 802 | 185.6 |
| D | 1 | 52 | 281380 | 1331.93 | 776 | 761 | 210.7 |
| D | 13 | 249 | 191792 | 906.71 | 776 | 761 | 210.7 |
| D | 6 | 128 | 49196 | 229.89 | 776 | 761 | 210.7 |
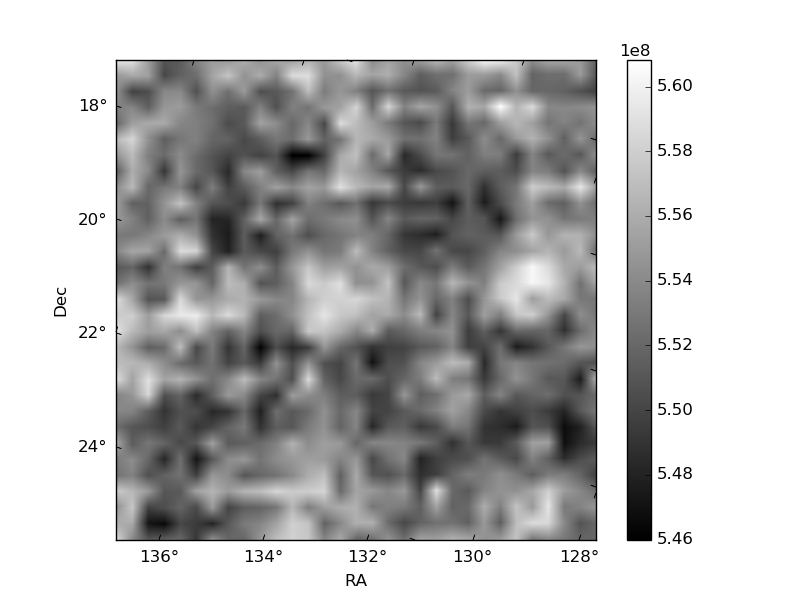
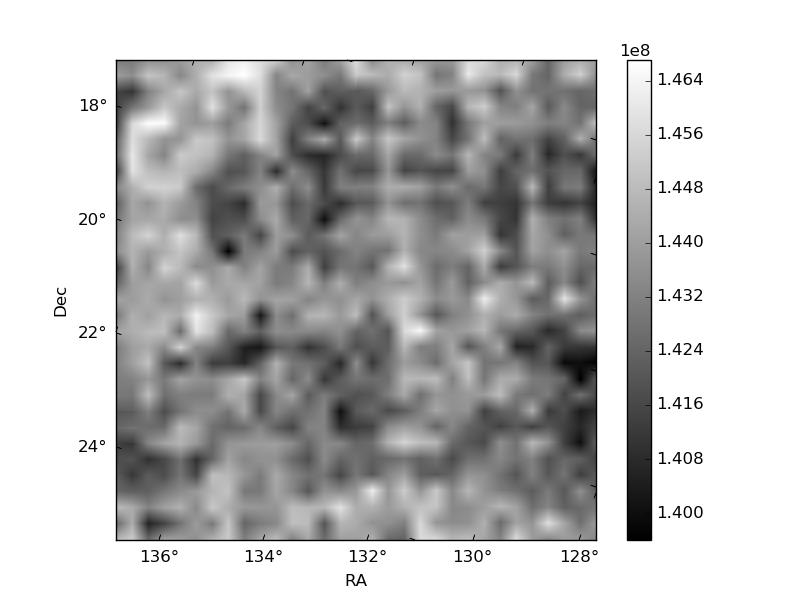
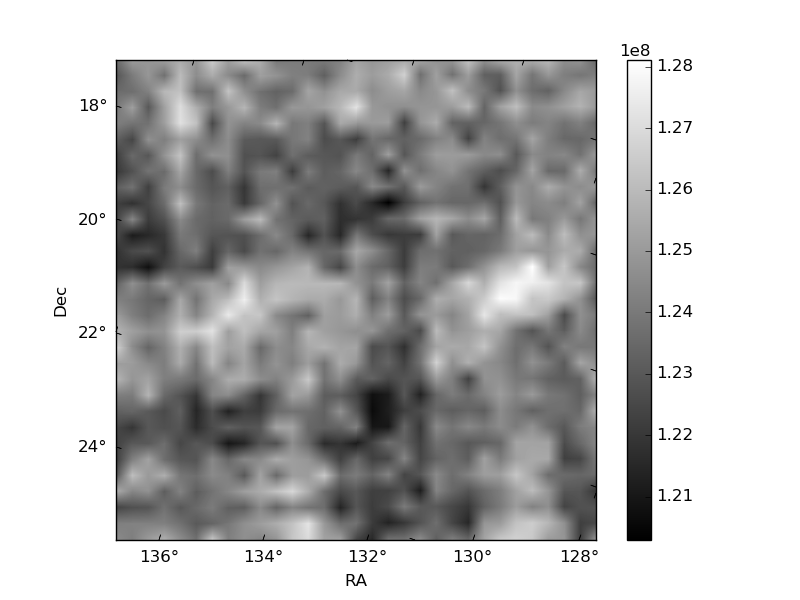
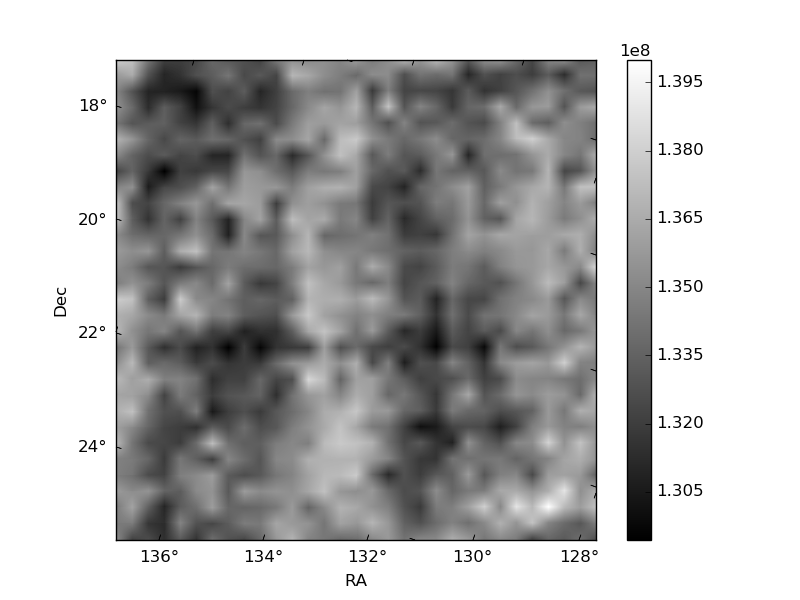
Histogram calculated using DETX and DETY for each event in the final _common_clean file
| Quadrant A | 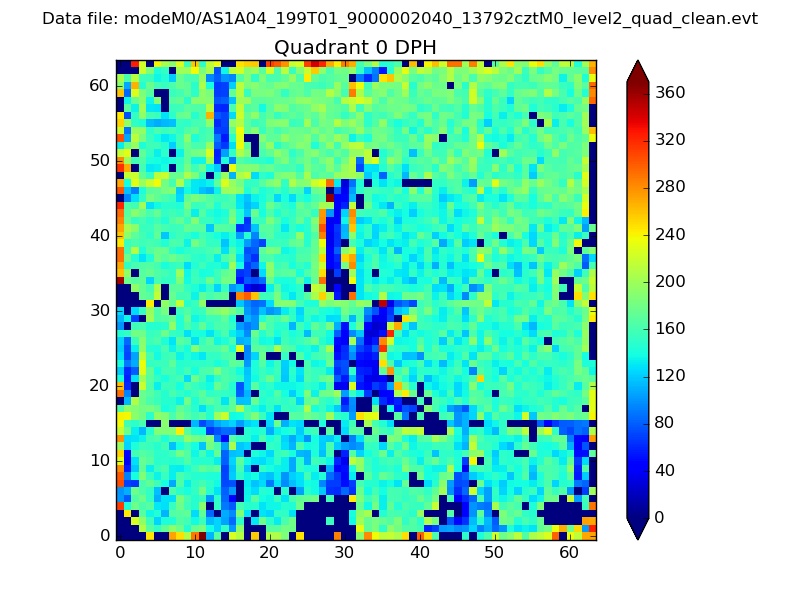 |
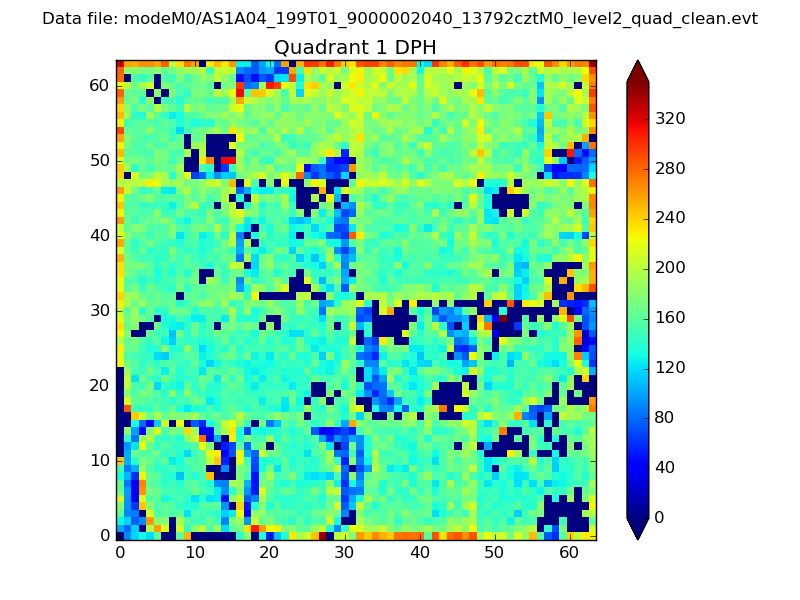 |
Quadrant B |
|---|---|---|---|
| Quadrant D | 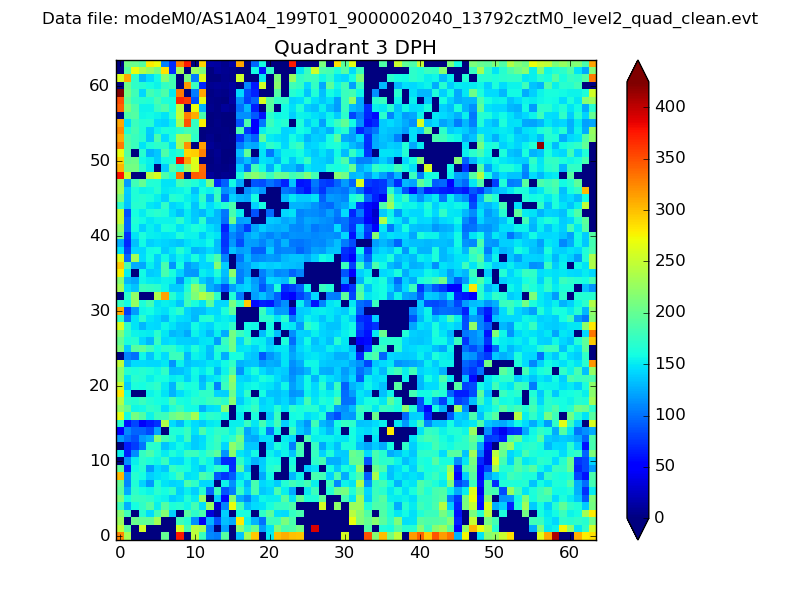 |
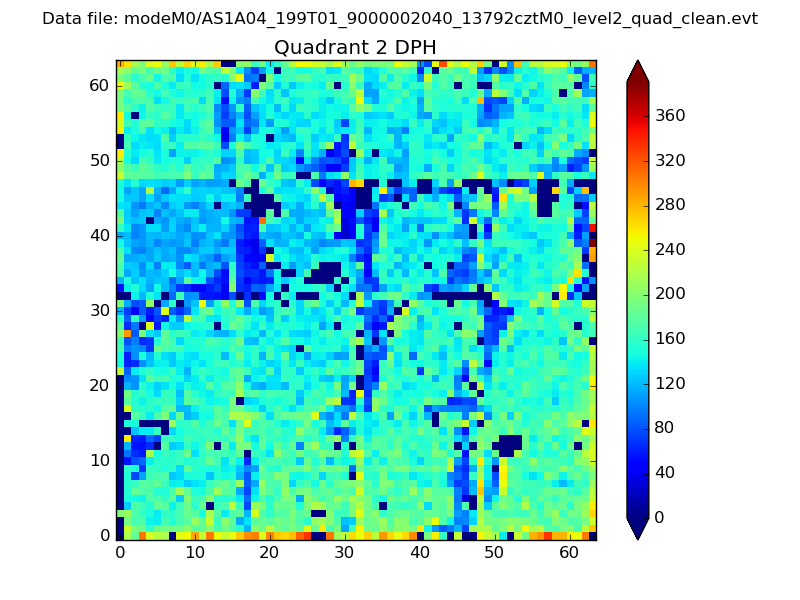 |
Quadrant C |
| Plot type | Count rate plots | Images |
|---|---|---|
| Comparison with Poisson distribution Blue bars denote a histogram of data divided into 1 sec bins. Red curve is a Poisson curve with rate = median count rate of data. |
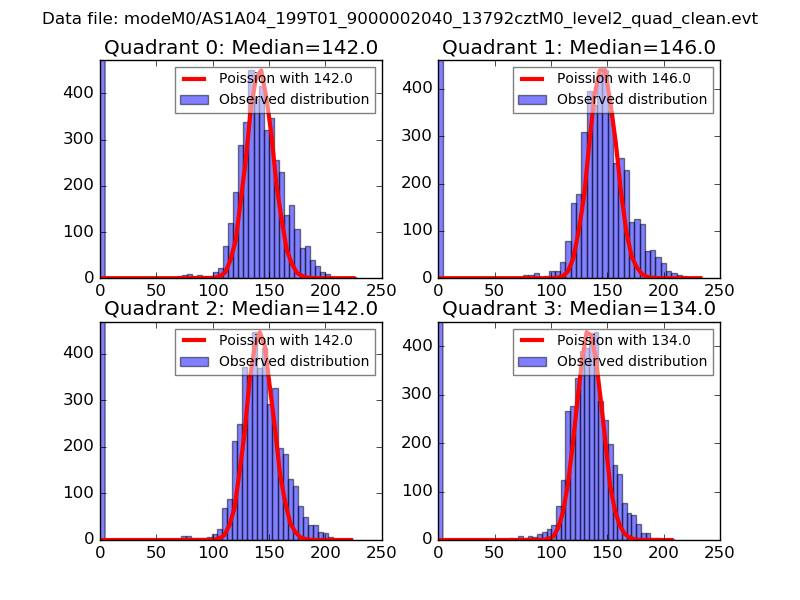 |
 |
| Quadrant-wise count rates Data is divided into 100 sec bins |
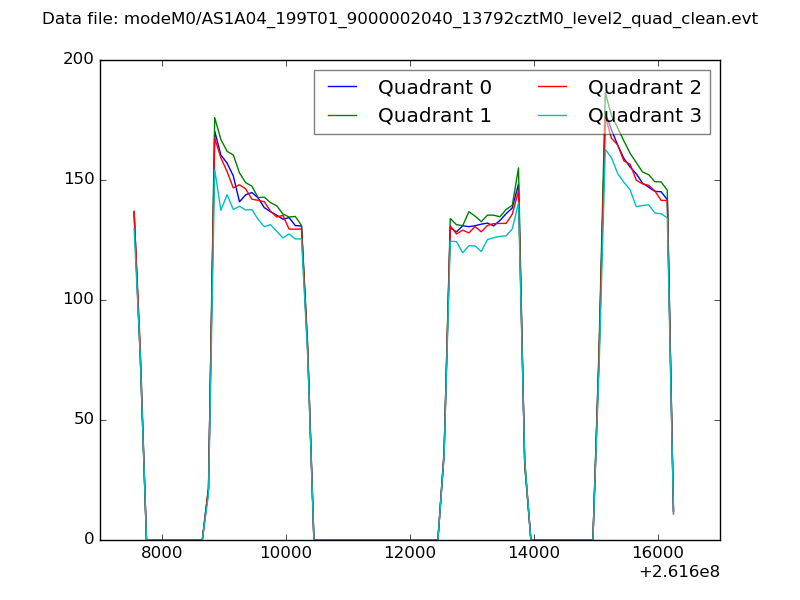 |
|
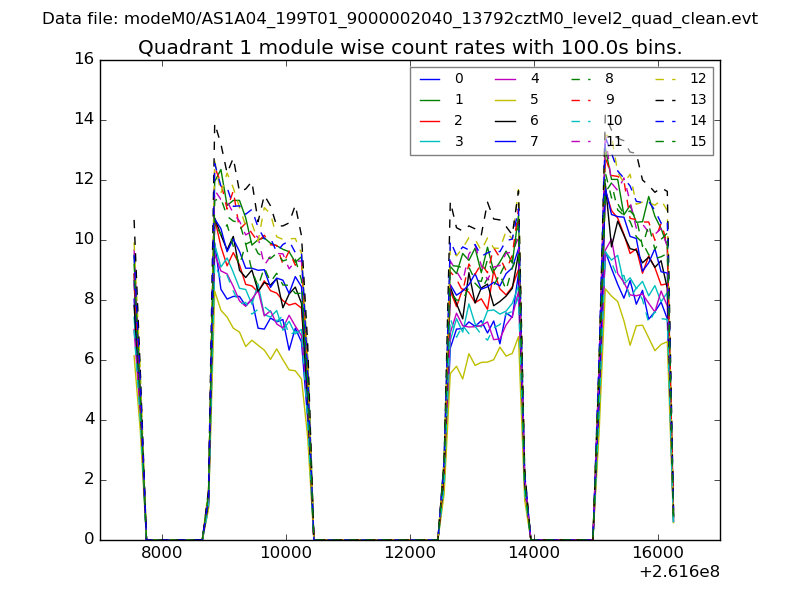
| Module-wise count rates for Quadrant A Data is divided into 100 sec bins |
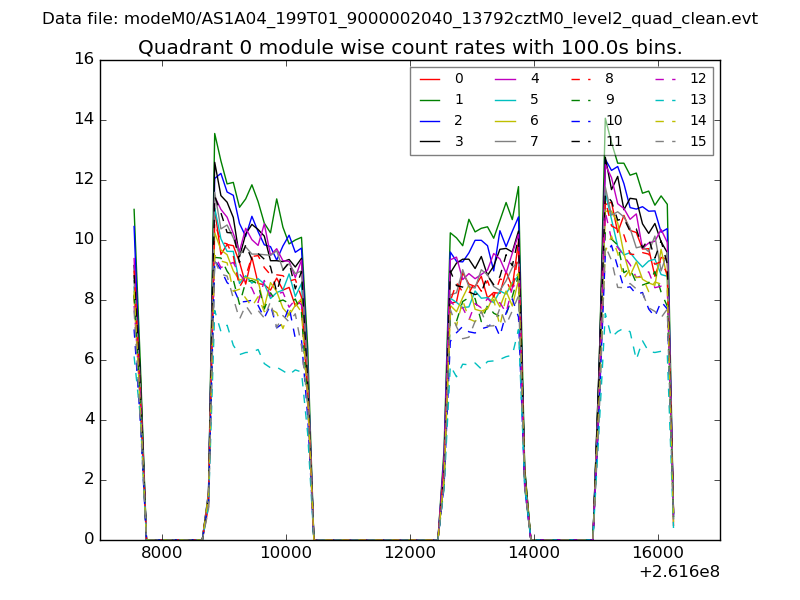 |
 |
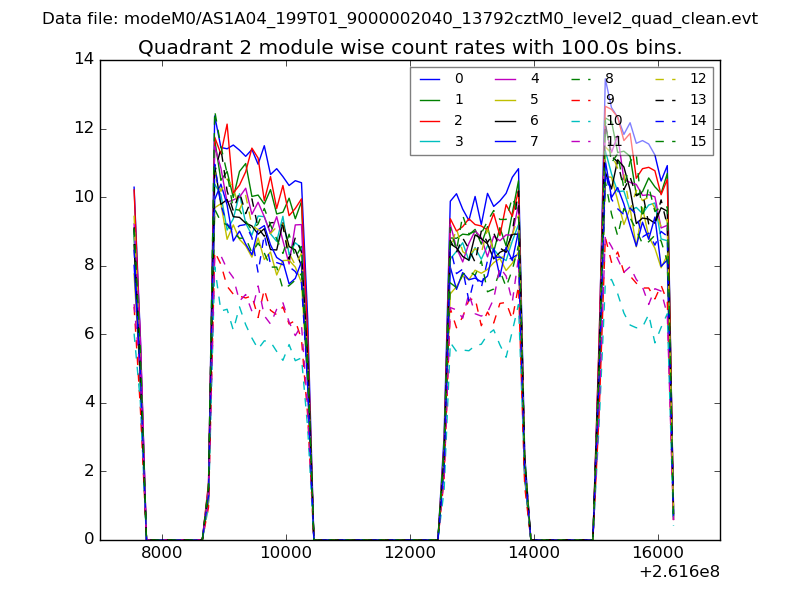
| Module-wise count rates for Quadrant B Data is divided into 100 sec bins |
 |
 |
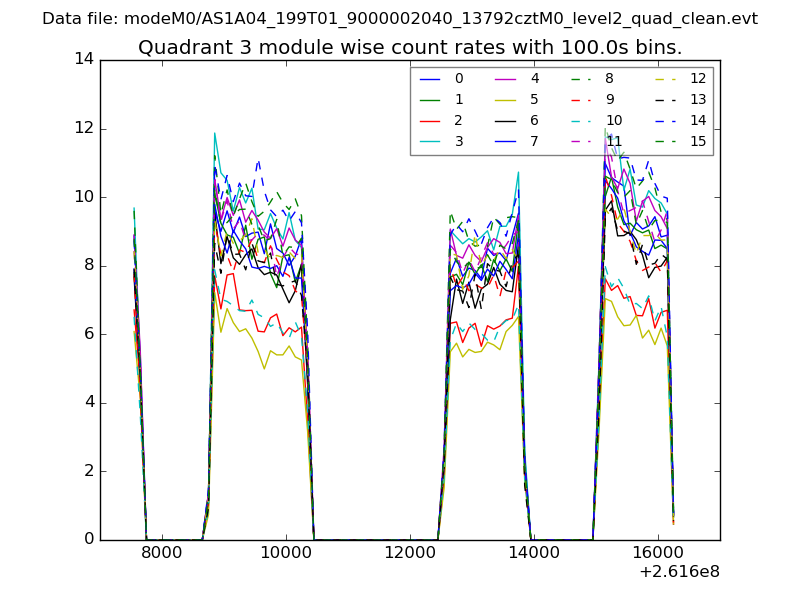
| Module-wise count rates for Quadrant C Data is divided into 100 sec bins |
 |
 |
| Module-wise count rates for Quadrant D Data is divided into 100 sec bins |
 |
 |
| Parameter | Plot |
|---|---|
| CZT HV Monitor | 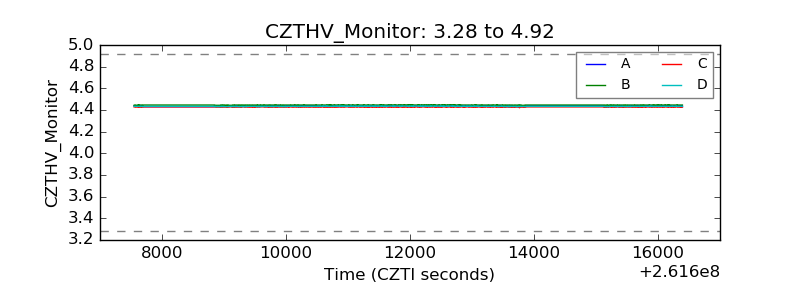 |
| D_VDD |  |
| Temperature 1 | 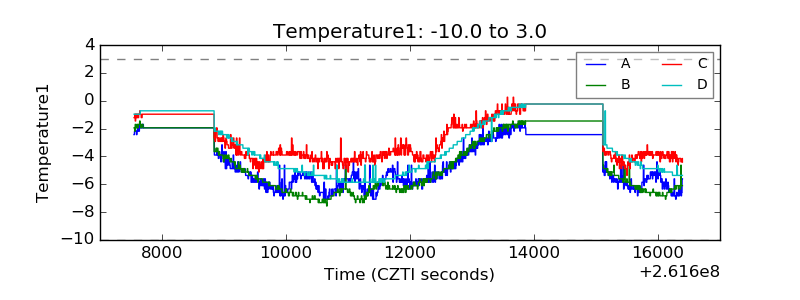 |
| Veto HV Monitor | 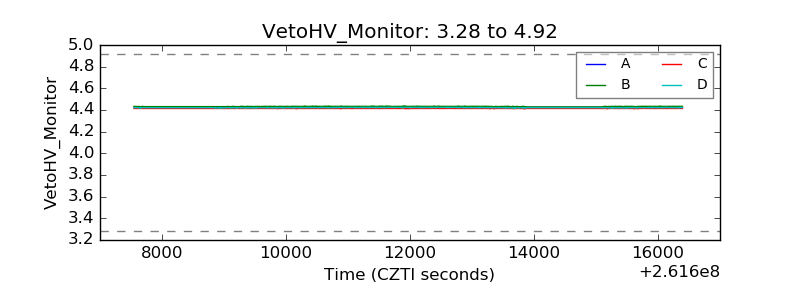 |
| Veto LLD | 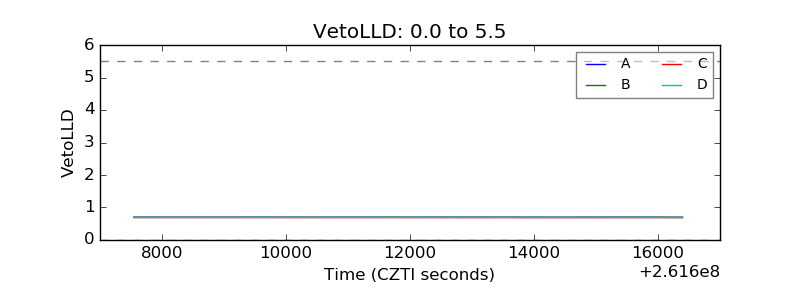 |
| Alpha Counter | 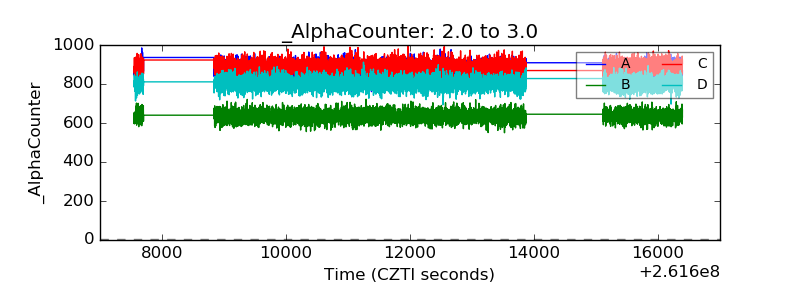 |
| _CPM_Rate | 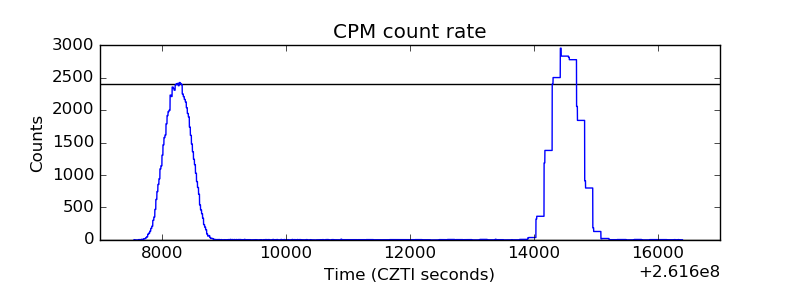 |
| CZT Counter | 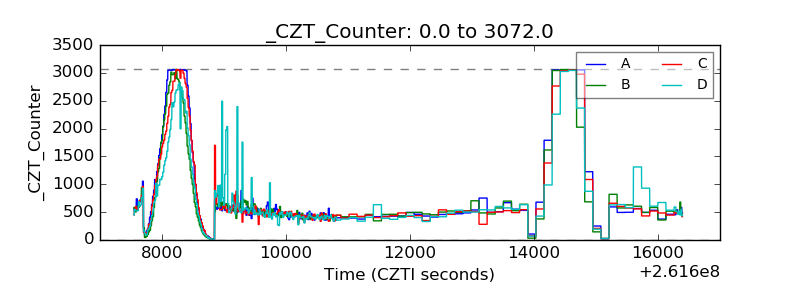 |
| +2.5 Volts monitor |  |
| +5 Volts monitor |  |
| _ROLL_ROT | 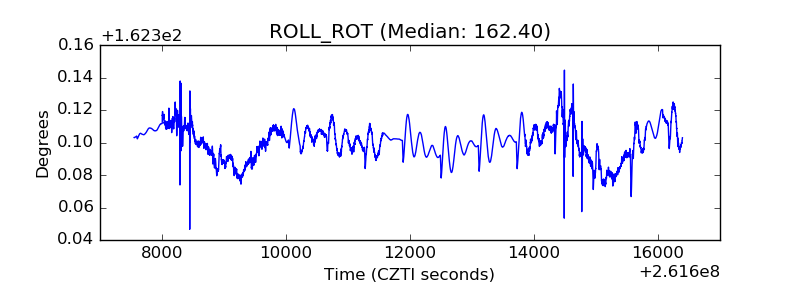 |
| _Roll_DEC | 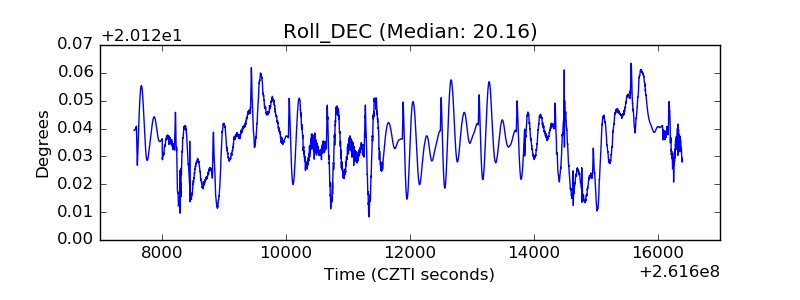 |
| _Roll_RA | 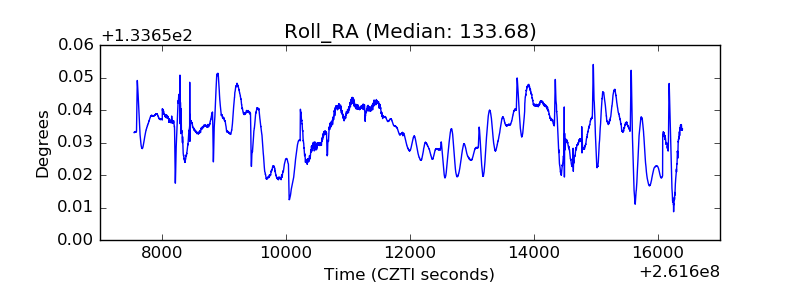 |
| Veto Counter | 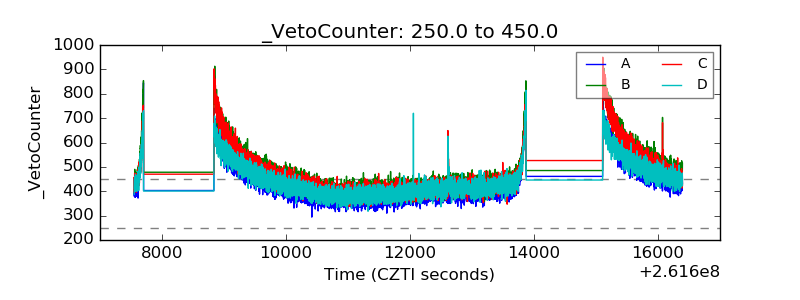 |