| Param | Original file | Final file |
|---|---|---|
| Filename | modeM0/AS1A04_199T01_9000002040_13793cztM0_level2.evt | modeM0/AS1A04_199T01_9000002040_13793cztM0_level2_quad_clean.evt |
| Size (bytes) | 452,865,600 | 81,783,360 |
| Size | 431.9 MB | 78.0 MB |
| Events in quadrant A | 3,177,902 | 518,698 |
| Events in quadrant B | 3,276,665 | 534,477 |
| Events in quadrant C | 3,040,795 | 513,425 |
| Events in quadrant D | 3,804,167 | 482,741 |
| Mode M9 | |||
|---|---|---|---|
| Quadrant | BADHDUFLAG | Total packets | Discarded packets |
| A | 0 | 26 | 0 |
| B | 0 | 26 | 0 |
| C | 0 | 26 | 0 |
| D | 0 | 26 | 0 |
| Mode SS | |||
|---|---|---|---|
| Quadrant | BADHDUFLAG | Total packets | Discarded packets |
| A | 0 | 126 | 0 |
| B | 0 | 126 | 0 |
| C | 0 | 126 | 0 |
| D | 0 | 126 | 0 |
| Mode M0 | |||
|---|---|---|---|
| Quadrant | BADHDUFLAG | Total packets | Discarded packets |
| A | 0 | 13133 | 3 |
| B | 0 | 13384 | 2 |
| C | 0 | 12727 | 2 |
| D | 0 | 15530 | 2 |
| Quadrant | Total seconds | Saturated seconds | Saturation percentage |
|---|---|---|---|
| A | 6120 | 44 | 0.718954% |
| B | 6120 | 78 | 1.274510% |
| C | 6120 | 27 | 0.441176% |
| D | 6120 | 51 | 0.833333% |
Noise dominated data is calculated using 1-second bins in cleaned event files. If a bin has >2000 counts, and if more than 50% of those come from <1% of pixels, then it is considered to be noise-dominated and hence unusable.
| Quadrant | # 1 sec bins | Bins with >0 counts | Bins with >2000 counts | High rate bins dominated by noise | Noise dominated (total time) | Noise dominated (detector-on time) | Marked lightcurve |
|---|---|---|---|---|---|---|---|
| A | 8706 | 6123 | 0 | 0 | 0.00% | 0.00% | 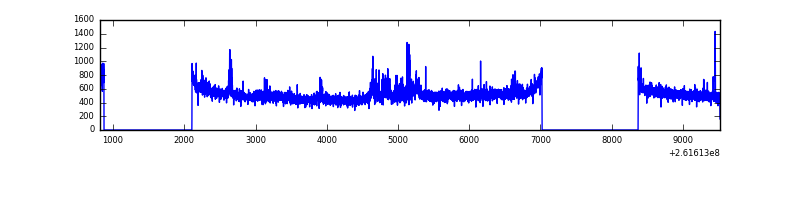 |
| B | 8706 | 6123 | 20 | 20 | 0.23% | 0.33% | 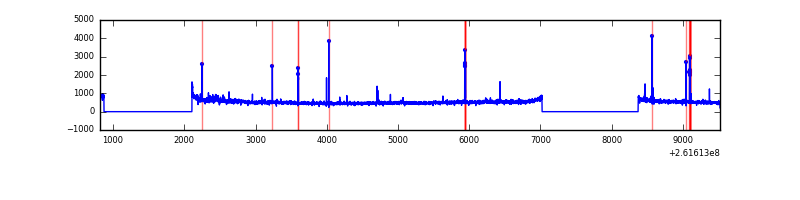 |
| C | 8706 | 6123 | 0 | 0 | 0.00% | 0.00% | 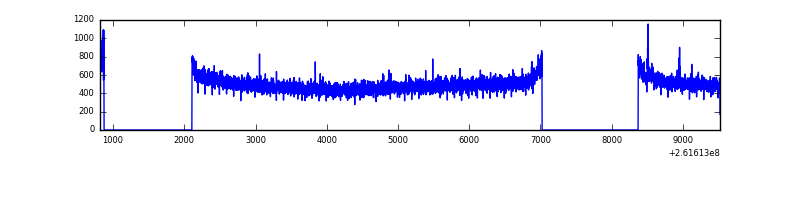 |
| D | 8706 | 6123 | 34 | 34 | 0.39% | 0.56% | 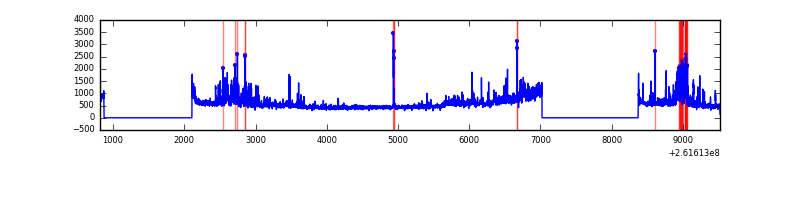 |
Top three noisy pixels from each quadrant. If the there are fewer than three noisy pixels in the level2.evt file, extra rows are filled as -1
| Pixel properties | Quadrant properties | ||||||
|---|---|---|---|---|---|---|---|
| Quadrant | DetID | PixID | Counts | Sigma | Mean | Median | Sigma |
| A | 15 | 157 | 104575 | 653.98 | 788 | 774 | 158.7 |
| A | 8 | 15 | 14165 | 84.37 | 788 | 774 | 158.7 |
| A | 1 | 162 | 11963 | 70.49 | 788 | 774 | 158.7 |
| B | 0 | 219 | 64861 | 432.82 | 795 | 778 | 148.1 |
| B | 4 | 80 | 63016 | 420.36 | 795 | 778 | 148.1 |
| B | 4 | 173 | 19040 | 123.34 | 795 | 778 | 148.1 |
| C | 3 | 233 | 50688 | 281.56 | 765 | 769 | 177.3 |
| C | 14 | 220 | 7800 | 39.66 | 765 | 769 | 177.3 |
| C | 13 | 61 | 5610 | 27.3 | 765 | 769 | 177.3 |
| D | 1 | 52 | 682938 | 3784.13 | 751 | 731 | 180.3 |
| D | 10 | 157 | 169673 | 937.1 | 751 | 731 | 180.3 |
| D | 13 | 249 | 36056 | 195.94 | 751 | 731 | 180.3 |
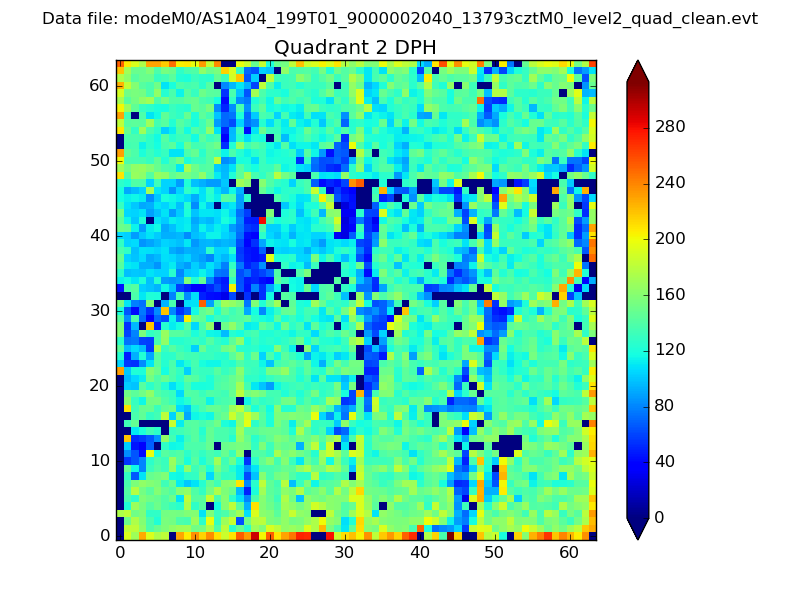
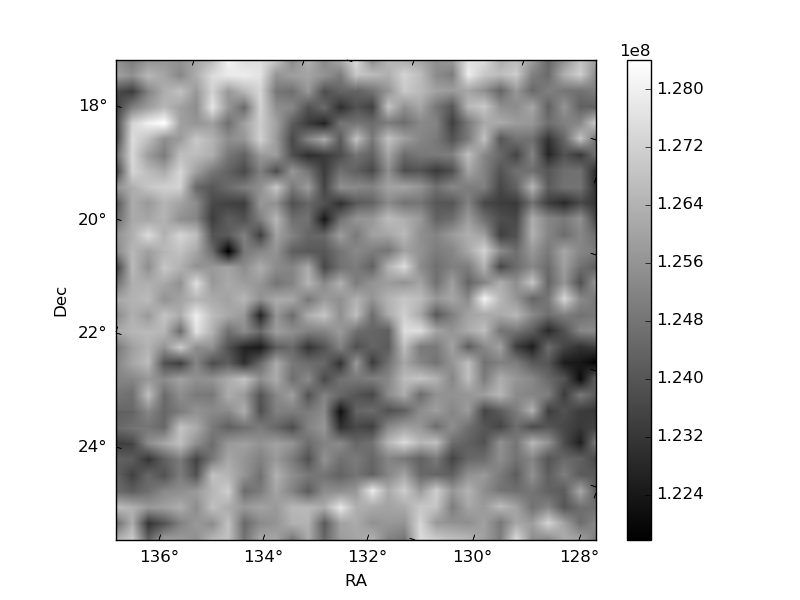
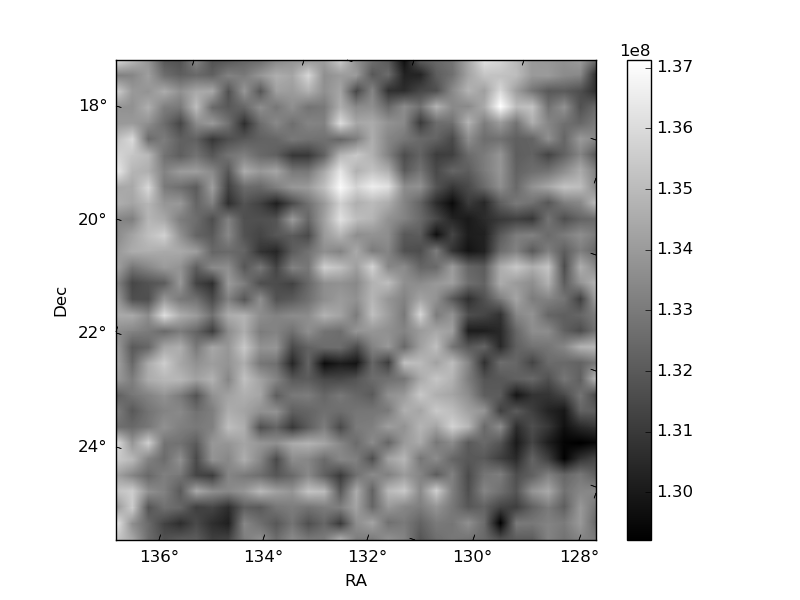
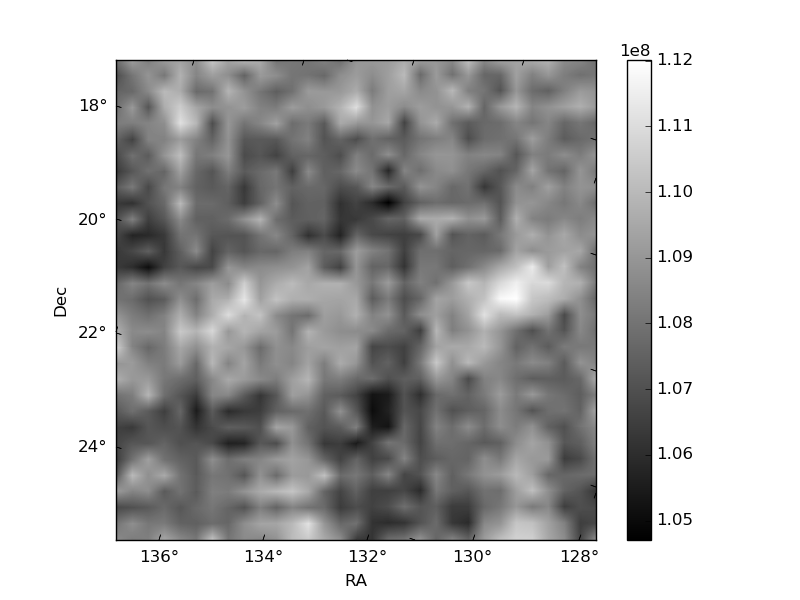
Histogram calculated using DETX and DETY for each event in the final _common_clean file
| Quadrant A | 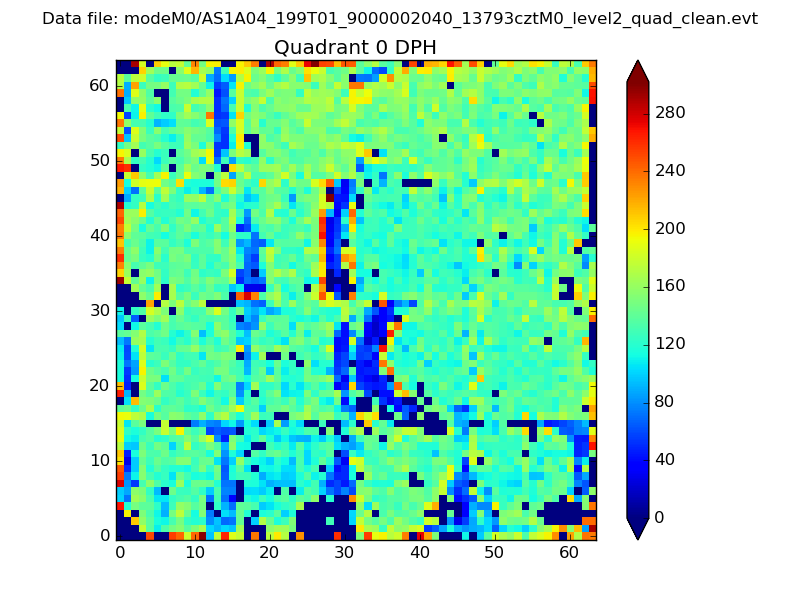 |
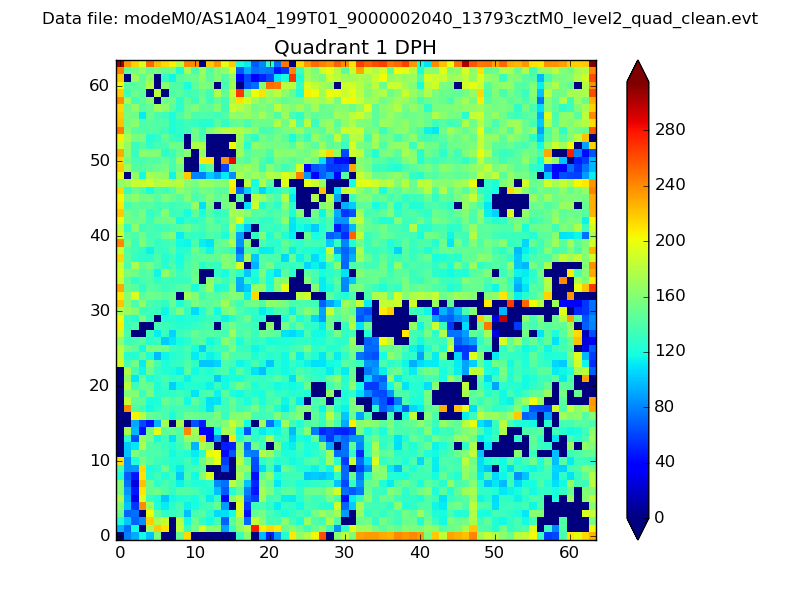 |
Quadrant B |
|---|---|---|---|
| Quadrant D | 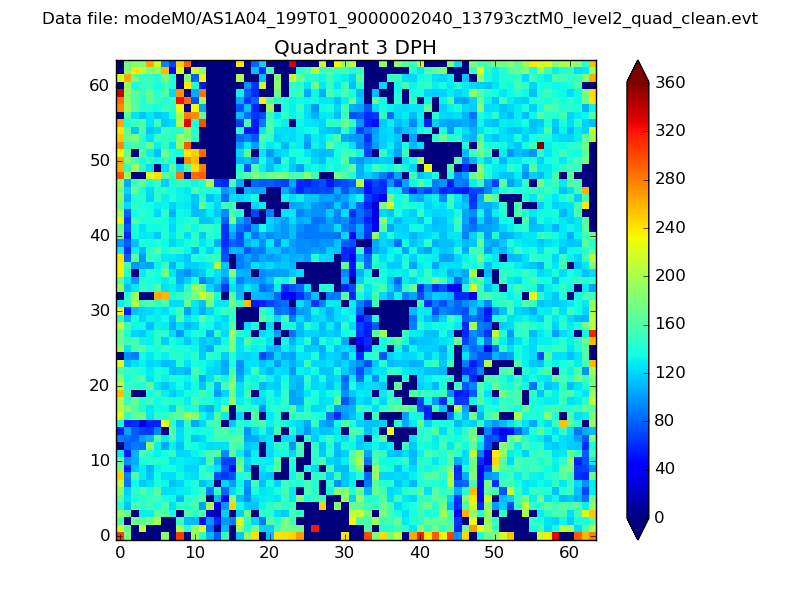 |
 |
Quadrant C |
| Plot type | Count rate plots | Images |
|---|---|---|
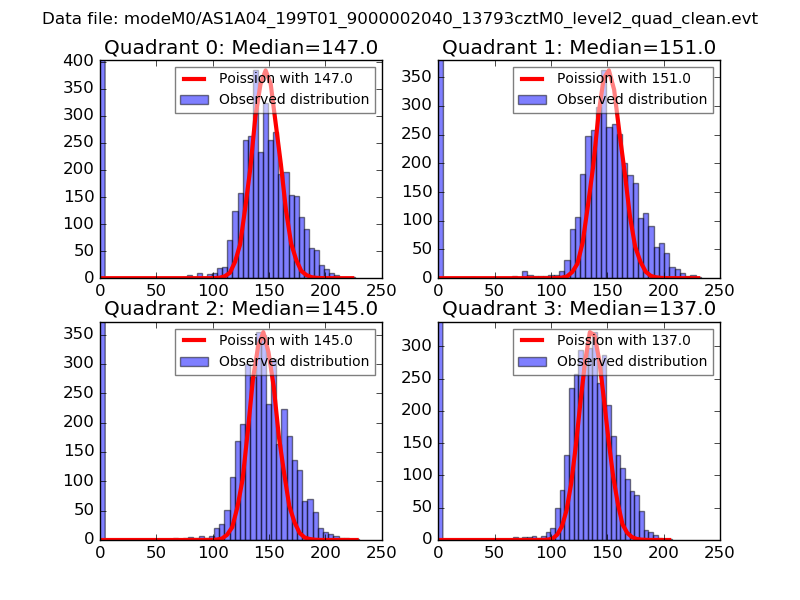
| Comparison with Poisson distribution Blue bars denote a histogram of data divided into 1 sec bins. Red curve is a Poisson curve with rate = median count rate of data. |
 |
 |
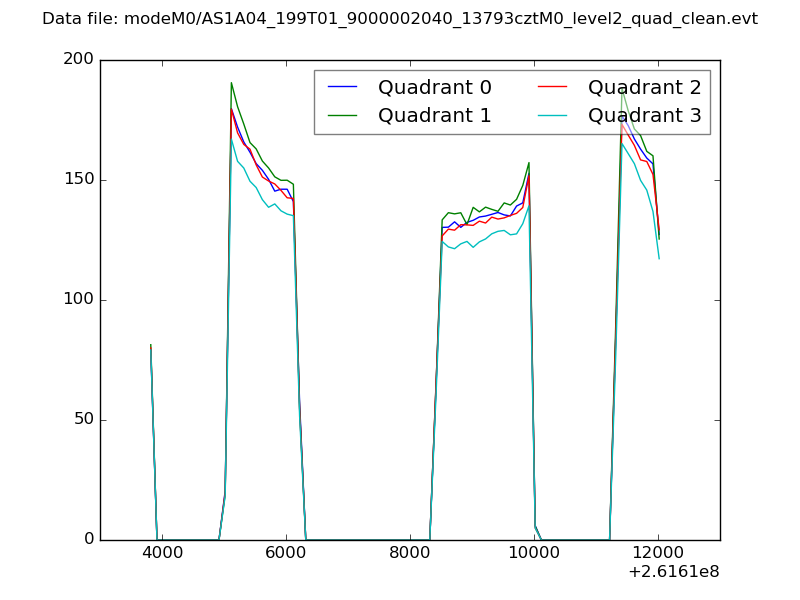
| Quadrant-wise count rates Data is divided into 100 sec bins |
 |
|
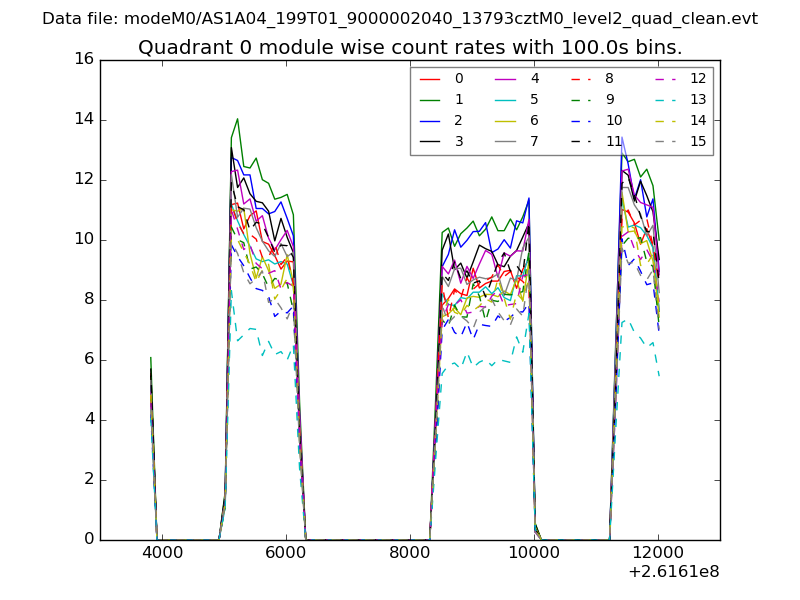
| Module-wise count rates for Quadrant A Data is divided into 100 sec bins |
 |
 |
| Module-wise count rates for Quadrant B Data is divided into 100 sec bins |
 |
 |
| Module-wise count rates for Quadrant C Data is divided into 100 sec bins |
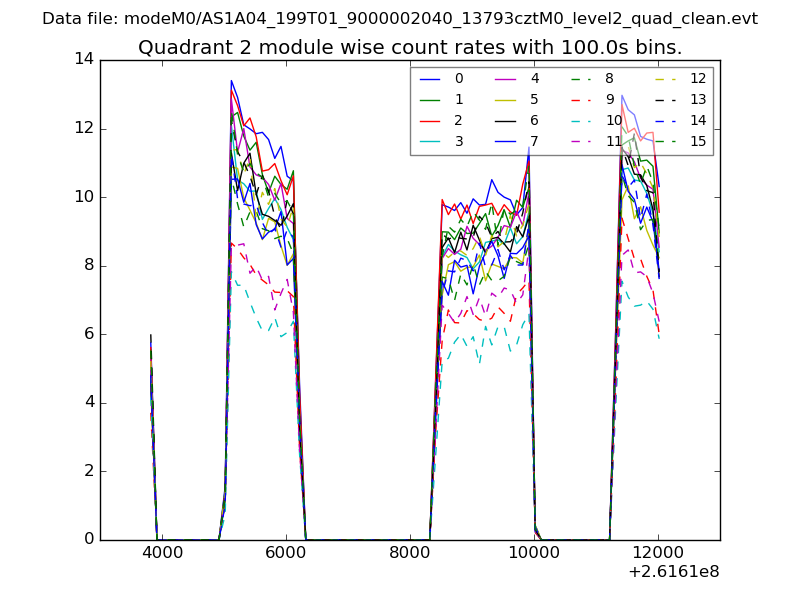 |
 |
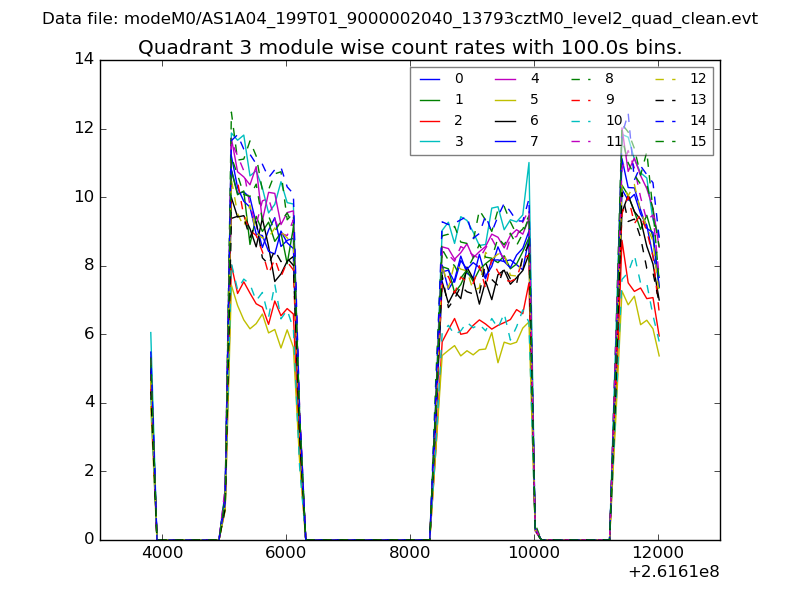
| Module-wise count rates for Quadrant D Data is divided into 100 sec bins |
 |
 |
| Parameter | Plot |
|---|---|
| CZT HV Monitor | 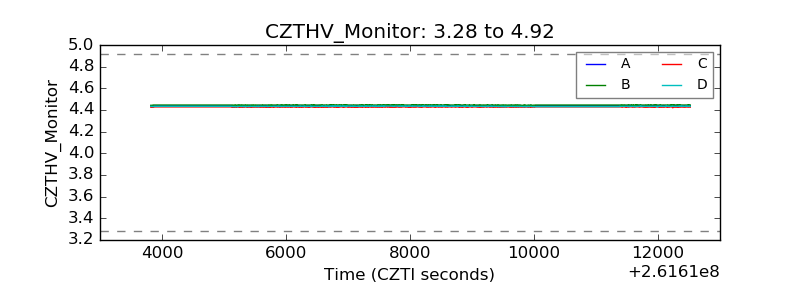 |
| D_VDD | 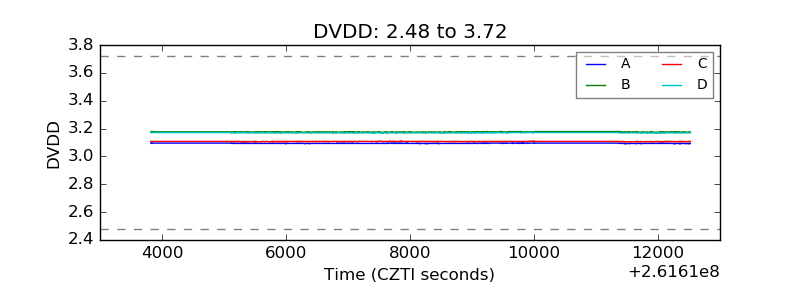 |
| Temperature 1 | 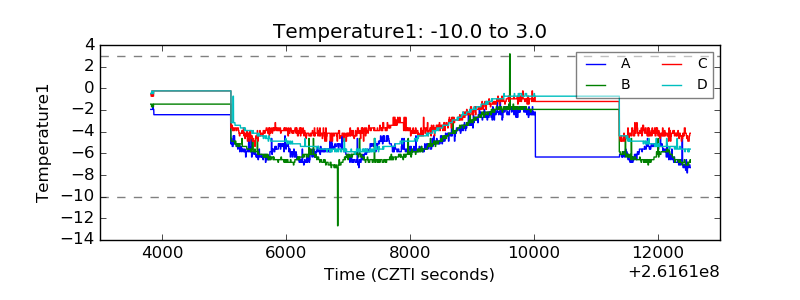 |
| Veto HV Monitor | 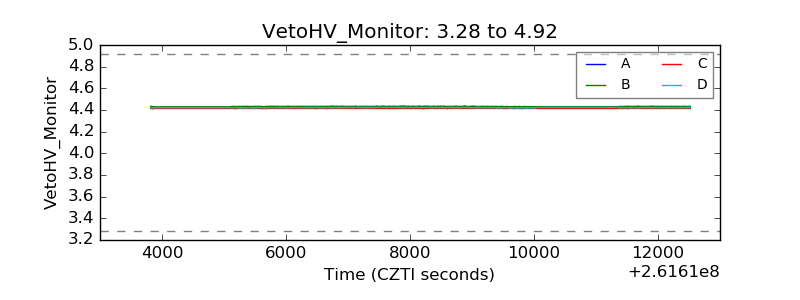 |
| Veto LLD | 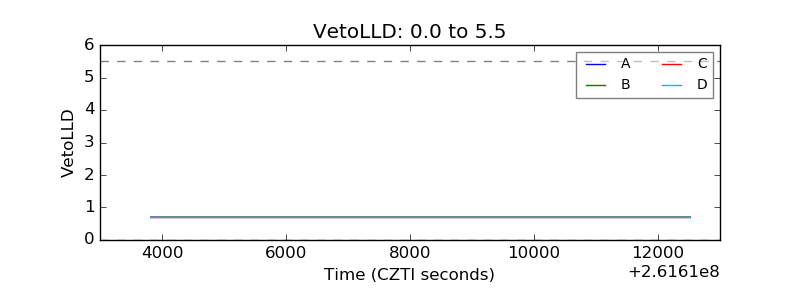 |
| Alpha Counter | 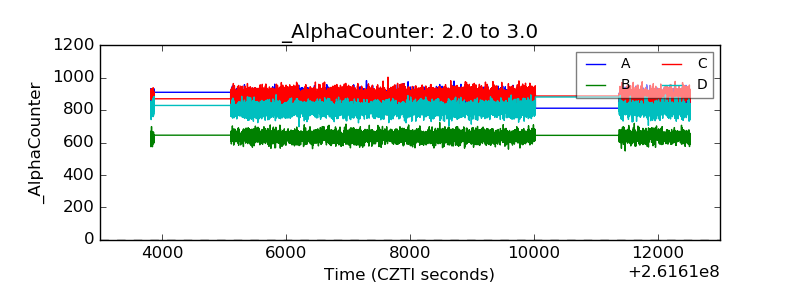 |
| _CPM_Rate | 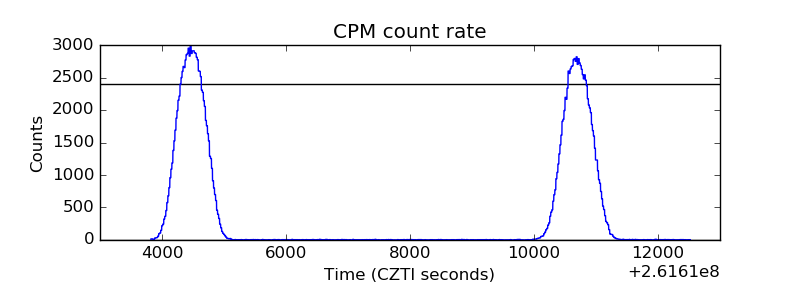 |
| CZT Counter | 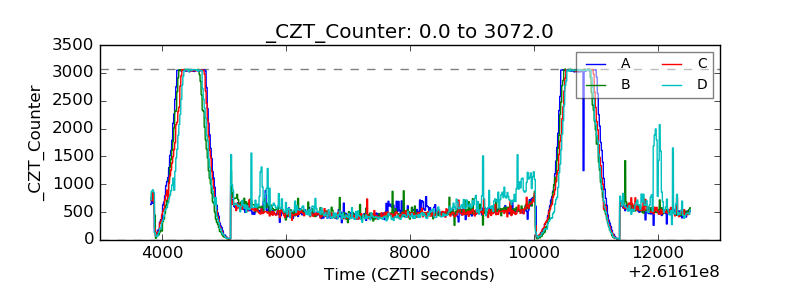 |
| +2.5 Volts monitor |  |
| +5 Volts monitor |  |
| _ROLL_ROT |  |
| _Roll_DEC | 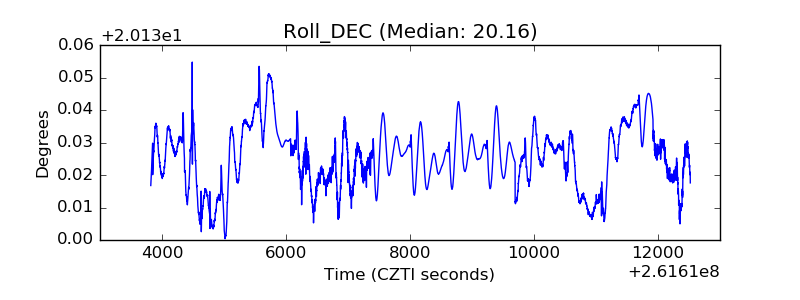 |
| _Roll_RA | 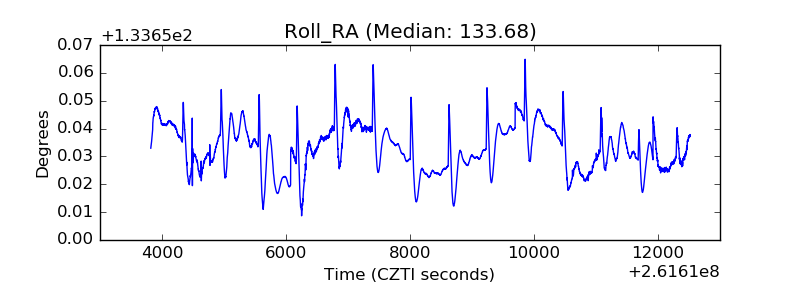 |
| Veto Counter | 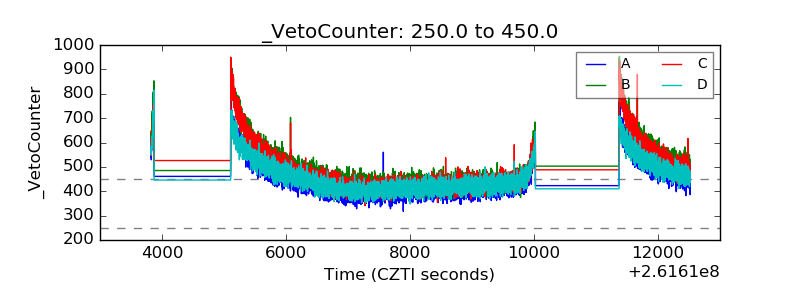 |