| Param | Original file | Final file |
|---|---|---|
| Filename | modeM0/AS1A04_199T01_9000002040_13794cztM0_level2.evt | modeM0/AS1A04_199T01_9000002040_13794cztM0_level2_quad_clean.evt |
| Size (bytes) | 492,312,960 | 72,607,680 |
| Size | 469.5 MB | 69.2 MB |
| Events in quadrant A | 3,490,743 | 444,895 |
| Events in quadrant B | 3,399,958 | 456,732 |
| Events in quadrant C | 3,188,983 | 436,836 |
| Events in quadrant D | 4,395,922 | 413,418 |
| Mode M9 | |||
|---|---|---|---|
| Quadrant | BADHDUFLAG | Total packets | Discarded packets |
| A | 0 | 25 | 0 |
| B | 0 | 25 | 0 |
| C | 0 | 25 | 0 |
| D | 0 | 26 | 0 |
| Mode SS | |||
|---|---|---|---|
| Quadrant | BADHDUFLAG | Total packets | Discarded packets |
| A | 0 | 130 | 0 |
| B | 0 | 130 | 0 |
| C | 0 | 130 | 0 |
| D | 0 | 130 | 0 |
| Mode M0 | |||
|---|---|---|---|
| Quadrant | BADHDUFLAG | Total packets | Discarded packets |
| A | 0 | 14216 | 3 |
| B | 0 | 13776 | 2 |
| C | 0 | 13289 | 2 |
| D | 0 | 17356 | 2 |
| Quadrant | Total seconds | Saturated seconds | Saturation percentage |
|---|---|---|---|
| A | 6400 | 57 | 0.890625% |
| B | 6400 | 73 | 1.140625% |
| C | 6400 | 25 | 0.390625% |
| D | 6400 | 61 | 0.953125% |
Noise dominated data is calculated using 1-second bins in cleaned event files. If a bin has >2000 counts, and if more than 50% of those come from <1% of pixels, then it is considered to be noise-dominated and hence unusable.
| Quadrant | # 1 sec bins | Bins with >0 counts | Bins with >2000 counts | High rate bins dominated by noise | Noise dominated (total time) | Noise dominated (detector-on time) | Marked lightcurve |
|---|---|---|---|---|---|---|---|
| A | 7746 | 6402 | 5 | 5 | 0.06% | 0.08% | 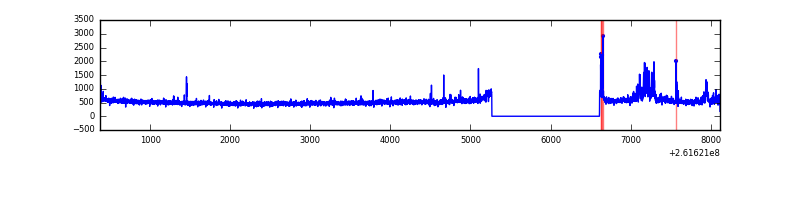 |
| B | 7746 | 6402 | 19 | 19 | 0.25% | 0.30% | 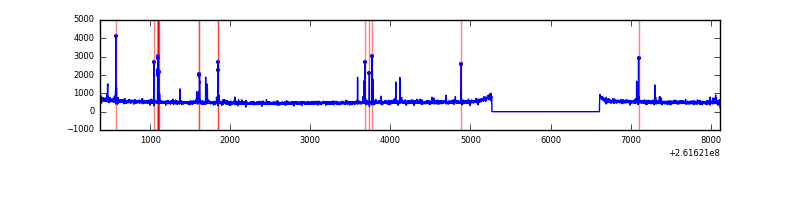 |
| C | 7746 | 6402 | 0 | 0 | 0.00% | 0.00% | 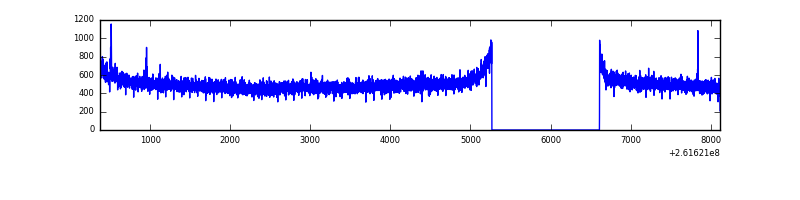 |
| D | 7746 | 6402 | 51 | 51 | 0.66% | 0.80% | 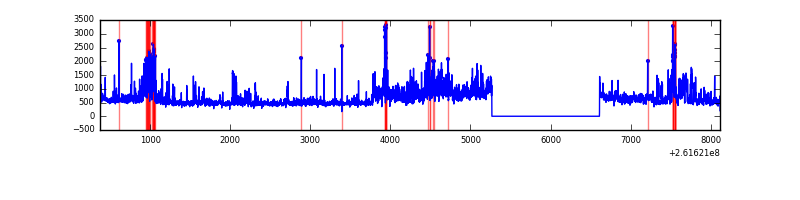 |
Top three noisy pixels from each quadrant. If the there are fewer than three noisy pixels in the level2.evt file, extra rows are filled as -1
| Pixel properties | Quadrant properties | ||||||
|---|---|---|---|---|---|---|---|
| Quadrant | DetID | PixID | Counts | Sigma | Mean | Median | Sigma |
| A | 8 | 15 | 223581 | 1327.65 | 827 | 812 | 167.8 |
| A | 9 | 143 | 40695 | 237.69 | 827 | 812 | 167.8 |
| A | 1 | 162 | 19395 | 110.75 | 827 | 812 | 167.8 |
| B | 4 | 80 | 56119 | 354.14 | 833 | 815 | 156.2 |
| B | 0 | 214 | 31392 | 195.8 | 833 | 815 | 156.2 |
| B | 8 | 250 | 26533 | 164.68 | 833 | 815 | 156.2 |
| C | 3 | 233 | 65570 | 352.73 | 797 | 801 | 183.6 |
| C | 14 | 220 | 8070 | 39.59 | 797 | 801 | 183.6 |
| C | 13 | 61 | 5707 | 26.72 | 797 | 801 | 183.6 |
| D | 1 | 52 | 867674 | 4569.85 | 784 | 768 | 189.7 |
| D | 10 | 157 | 385600 | 2028.62 | 784 | 768 | 189.7 |
| D | 13 | 249 | 65727 | 342.43 | 784 | 768 | 189.7 |
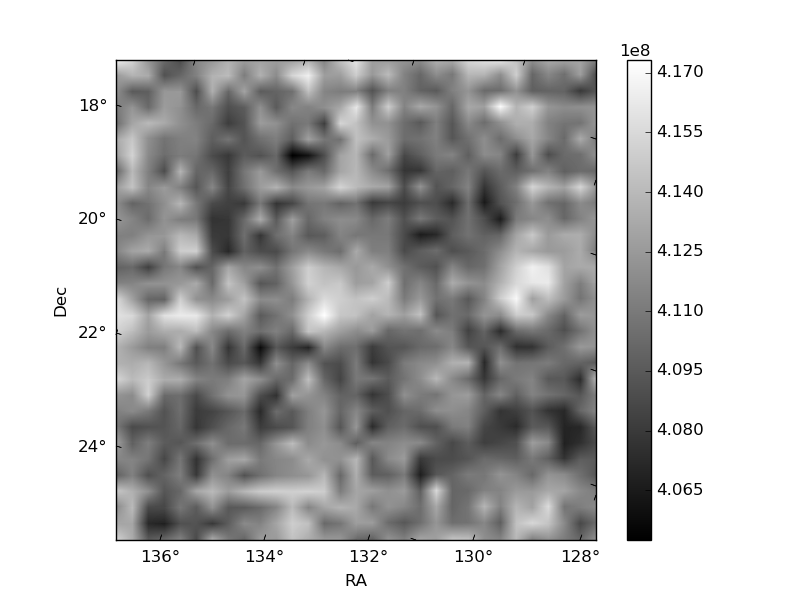
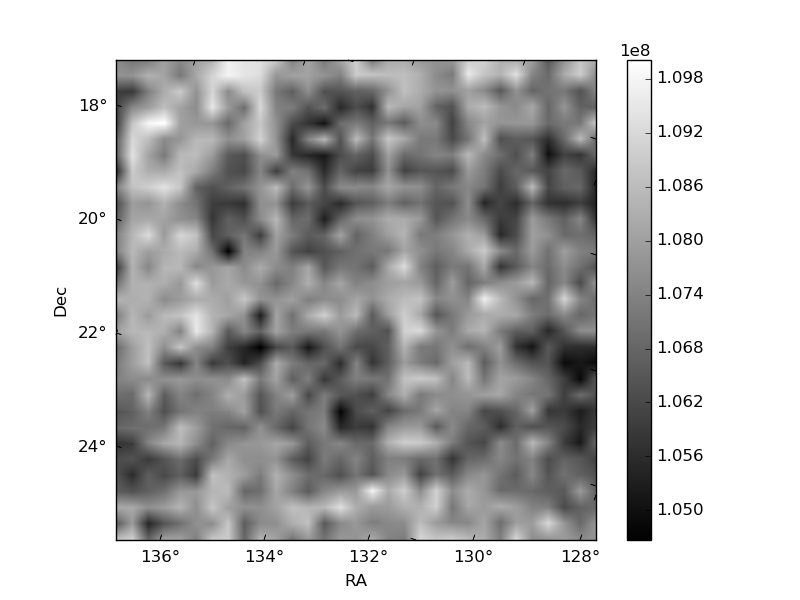
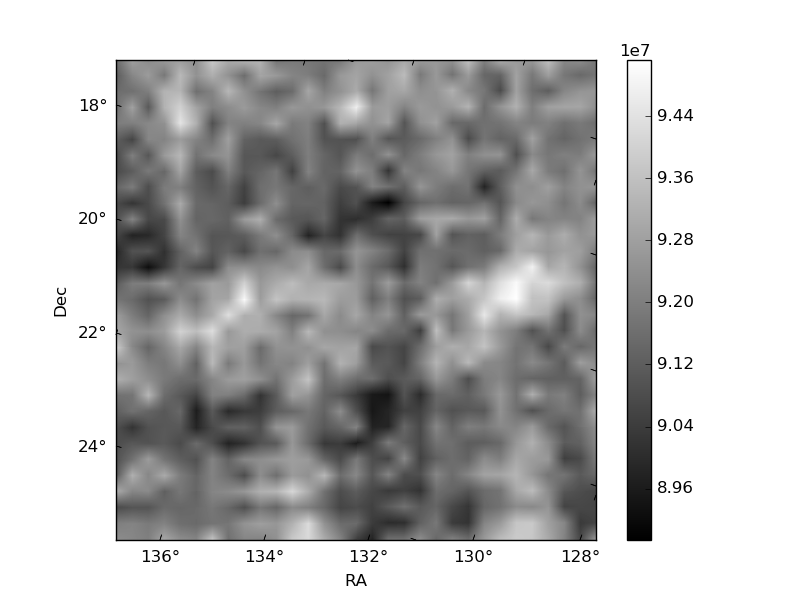
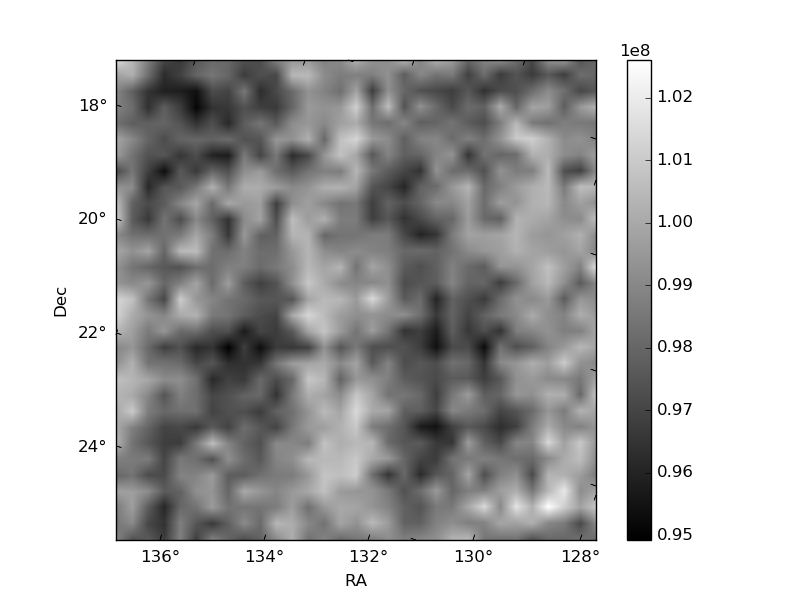
Histogram calculated using DETX and DETY for each event in the final _common_clean file
| Quadrant A | 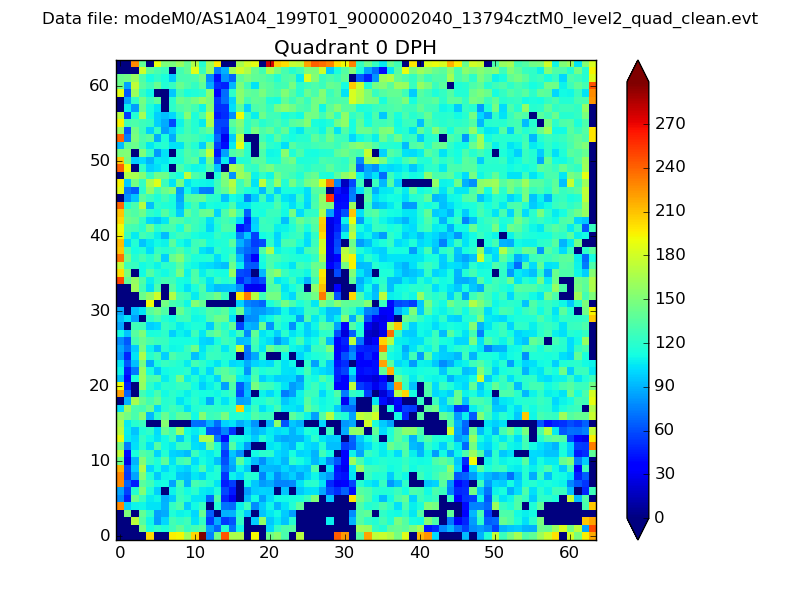 |
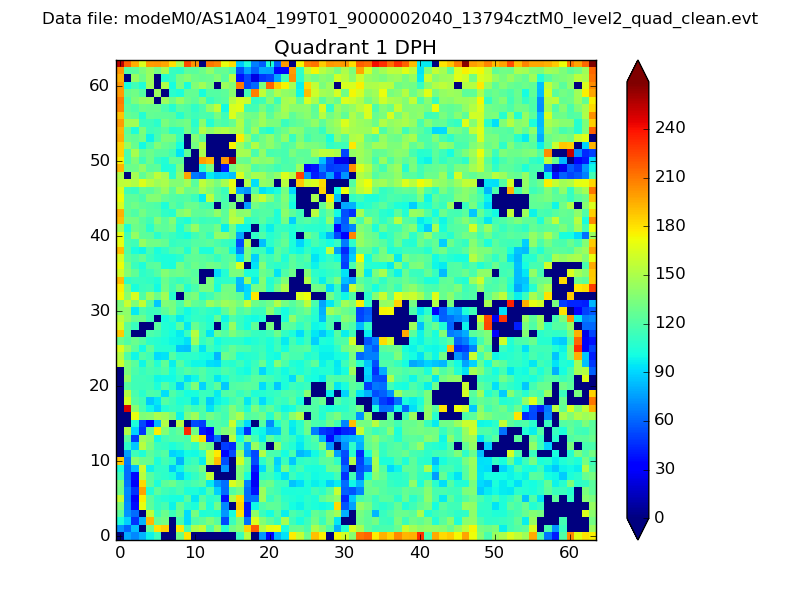 |
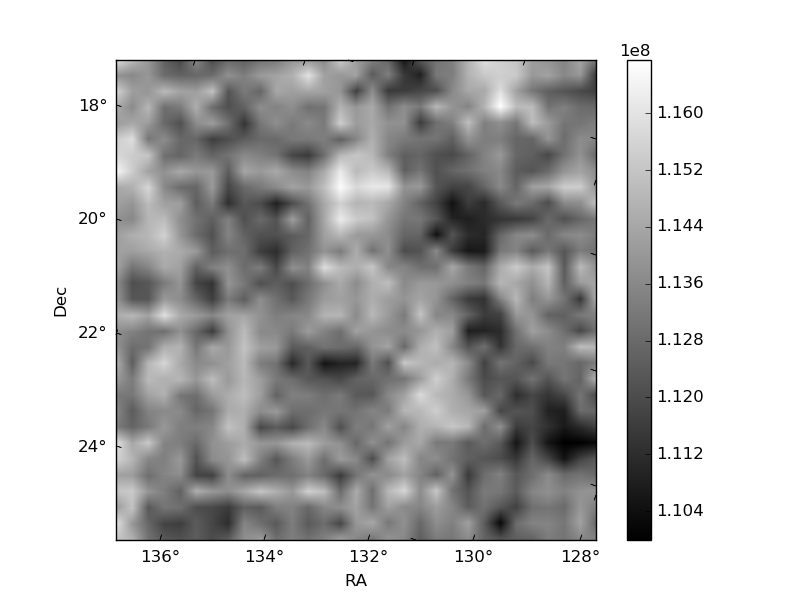
Quadrant B |
|---|---|---|---|
| Quadrant D | 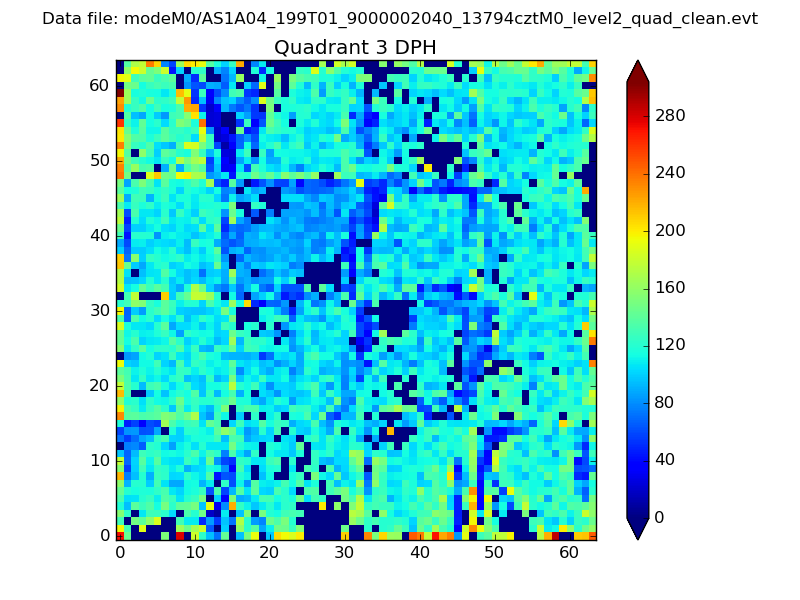 |
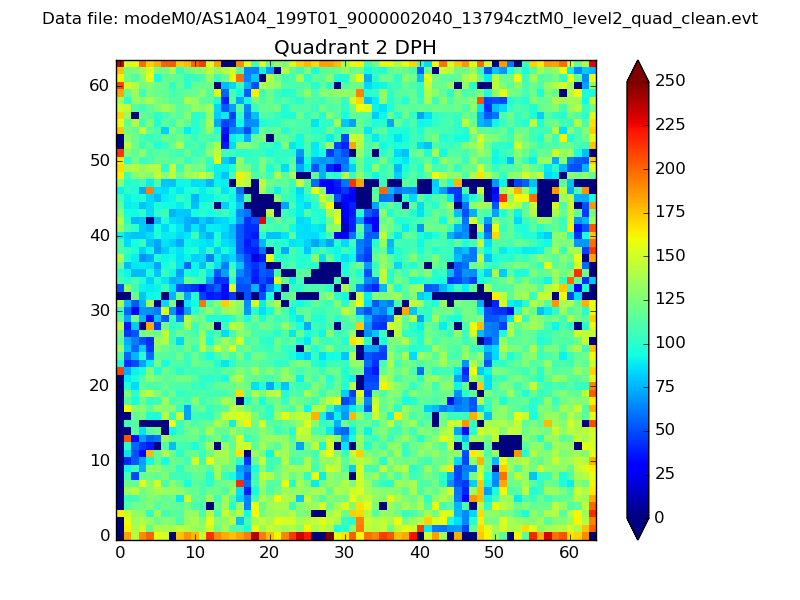 |
Quadrant C |
| Plot type | Count rate plots | Images |
|---|---|---|
| Comparison with Poisson distribution Blue bars denote a histogram of data divided into 1 sec bins. Red curve is a Poisson curve with rate = median count rate of data. |
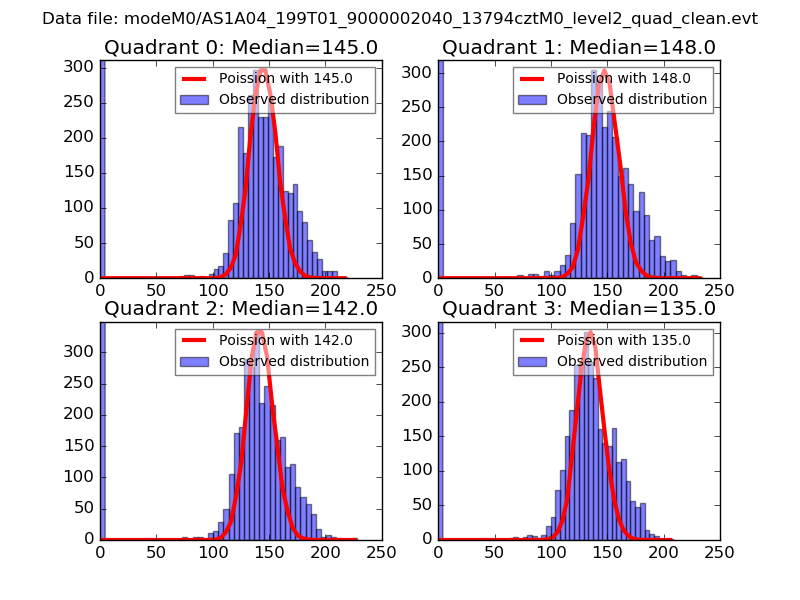 |
 |
| Quadrant-wise count rates Data is divided into 100 sec bins |
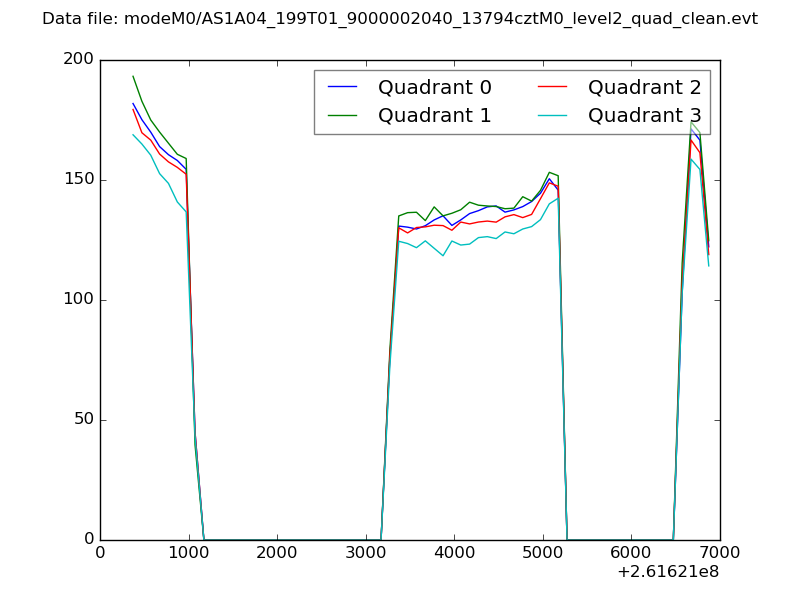 |
|
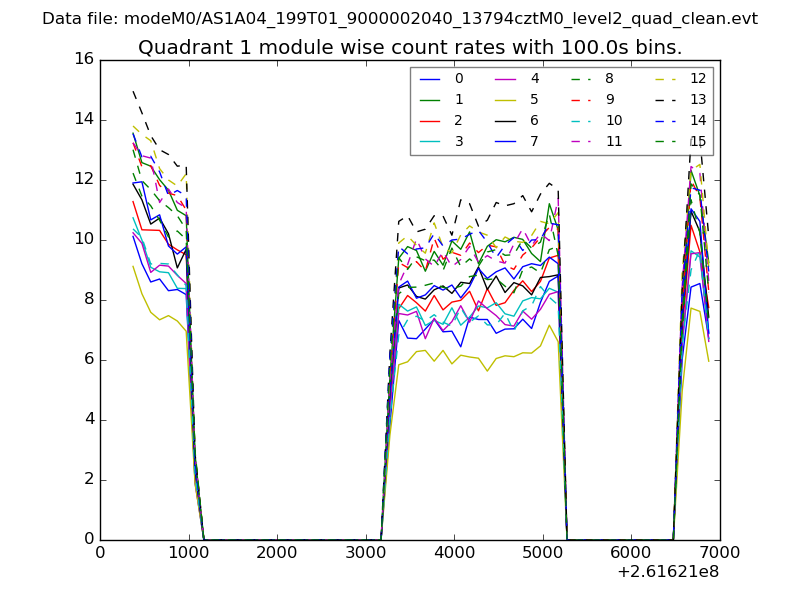
| Module-wise count rates for Quadrant A Data is divided into 100 sec bins |
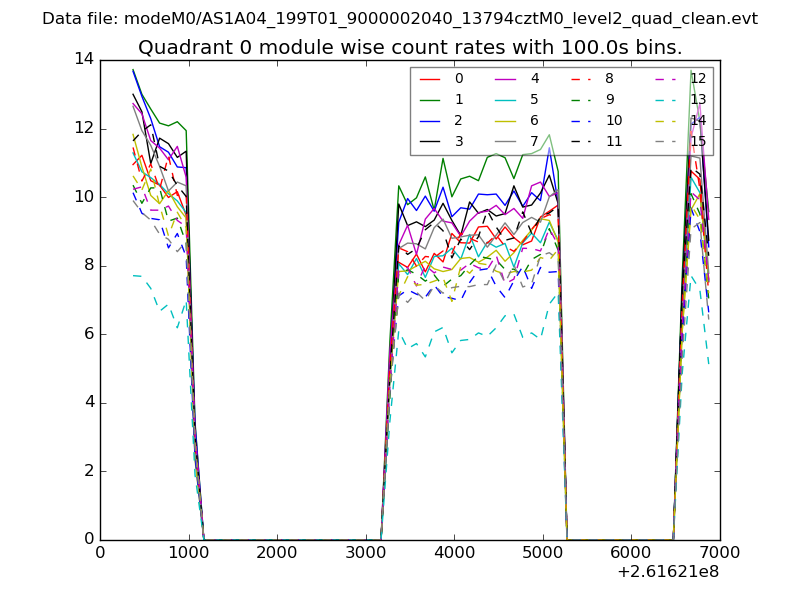 |
 |
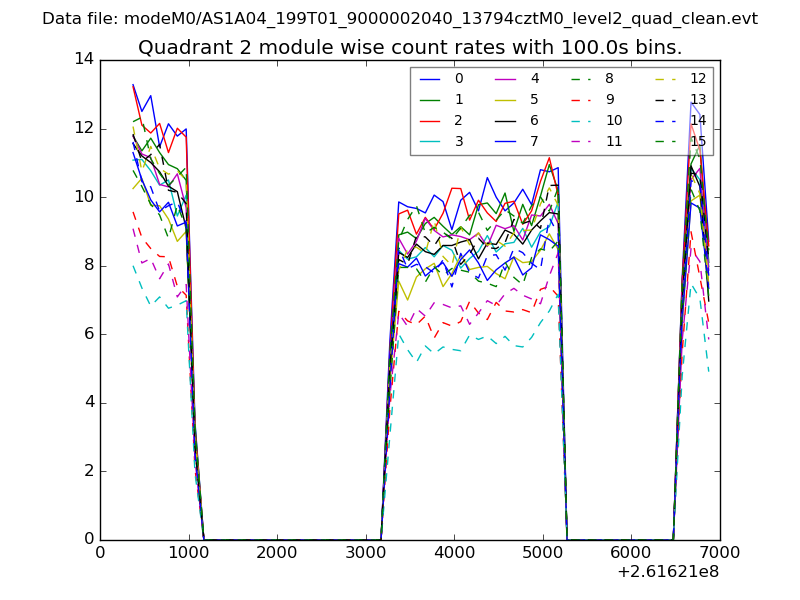
| Module-wise count rates for Quadrant B Data is divided into 100 sec bins |
 |
 |
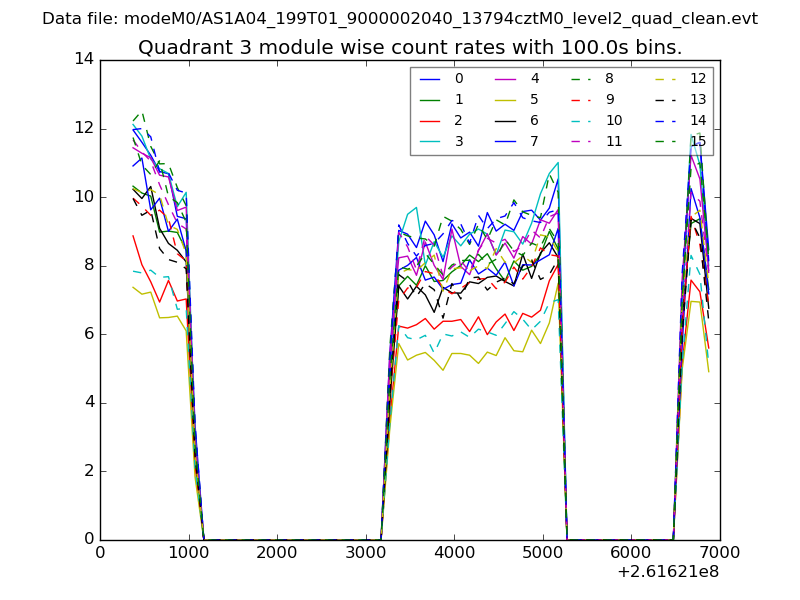
| Module-wise count rates for Quadrant C Data is divided into 100 sec bins |
 |
 |
| Module-wise count rates for Quadrant D Data is divided into 100 sec bins |
 |
 |
| Parameter | Plot |
|---|---|
| CZT HV Monitor | 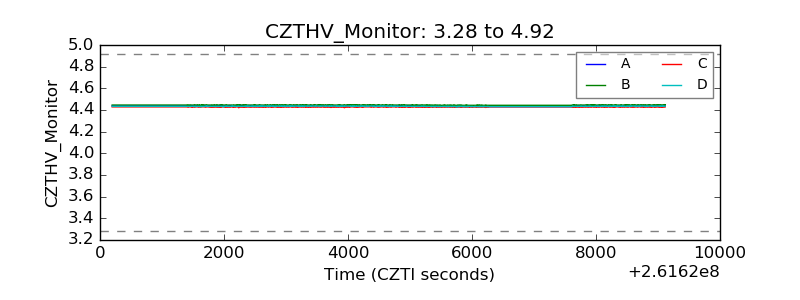 |
| D_VDD | 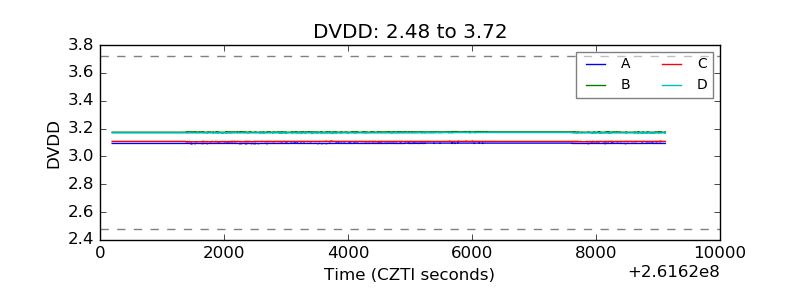 |
| Temperature 1 | 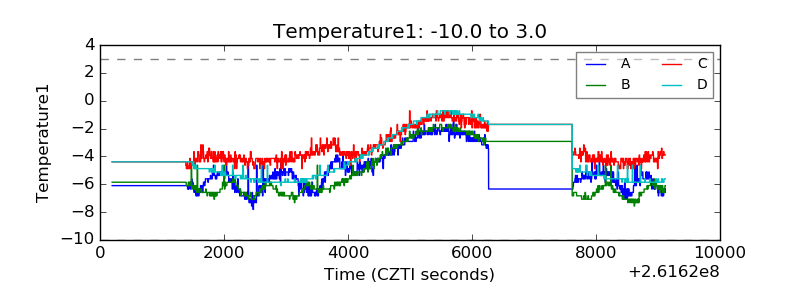 |
| Veto HV Monitor | 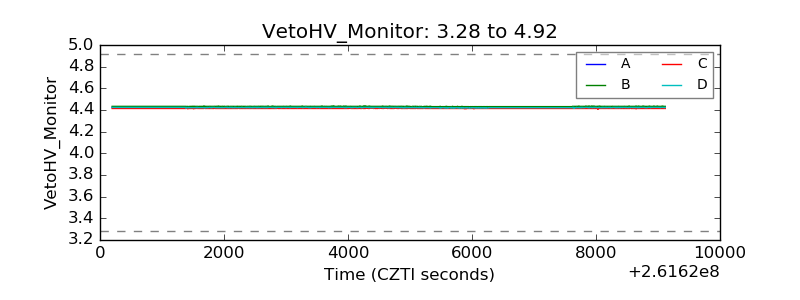 |
| Veto LLD | 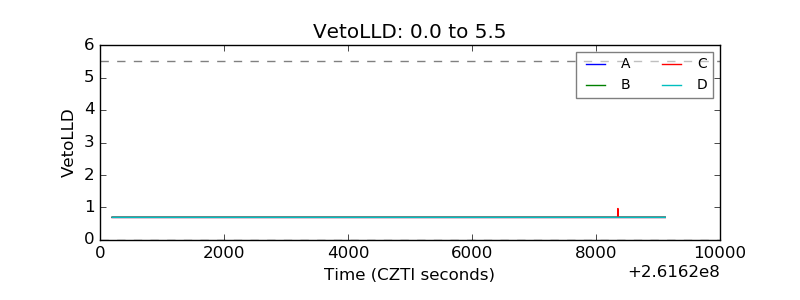 |
| Alpha Counter | 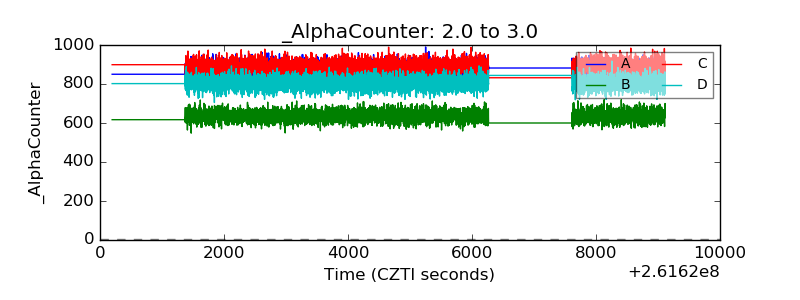 |
| _CPM_Rate | 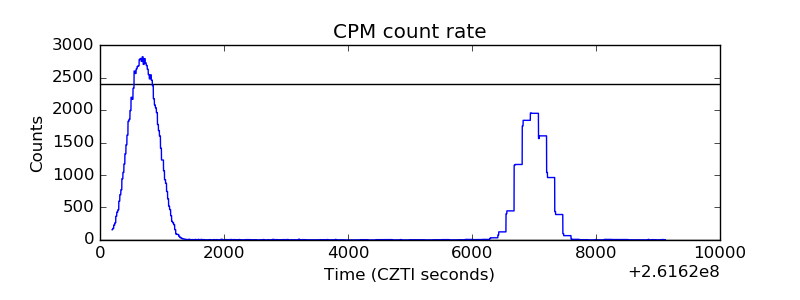 |
| CZT Counter | 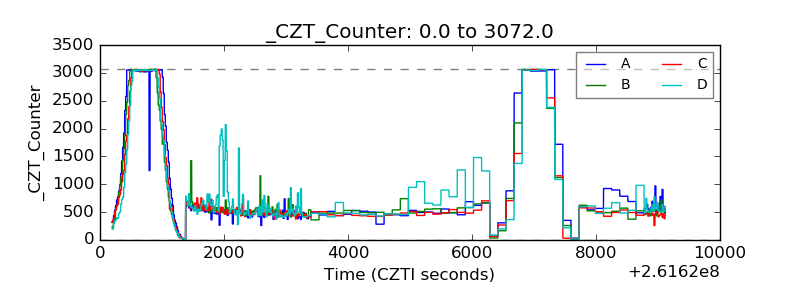 |
| +2.5 Volts monitor | 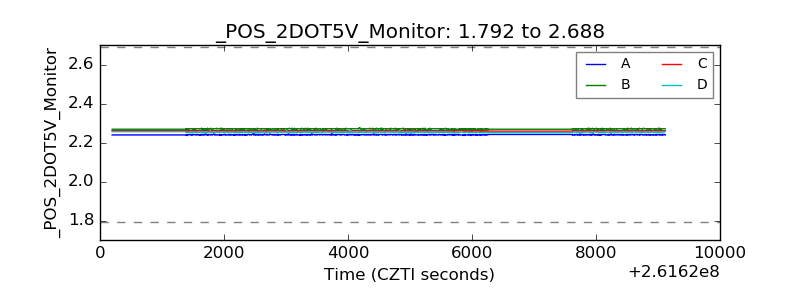 |
| +5 Volts monitor | 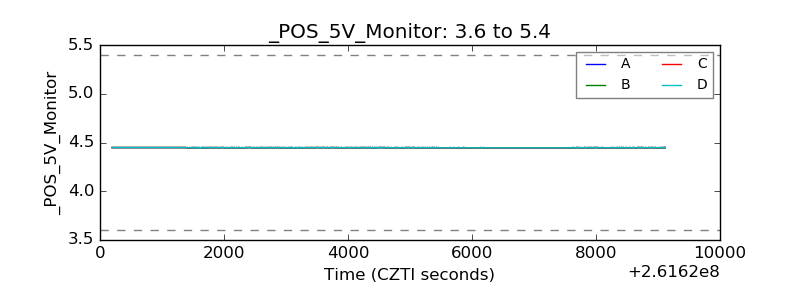 |
| _ROLL_ROT | 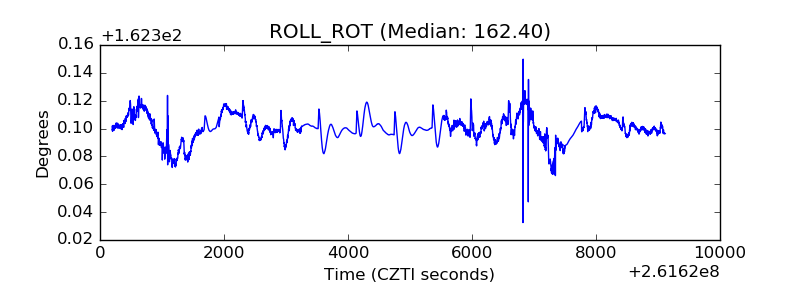 |
| _Roll_DEC |  |
| _Roll_RA | 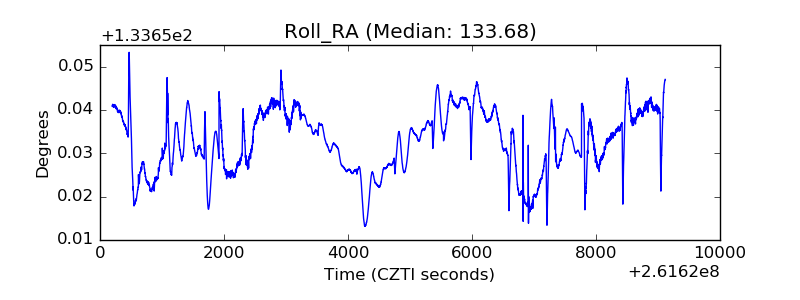 |
| Veto Counter | 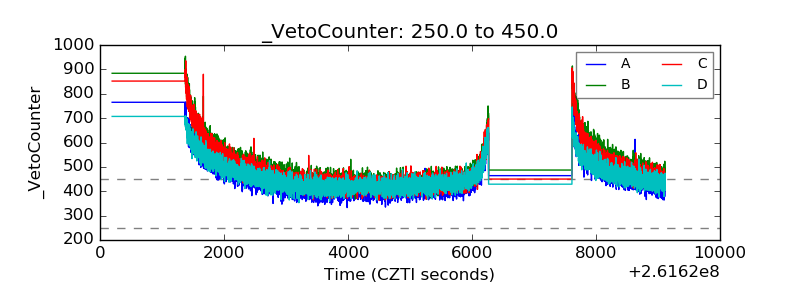 |