| Param | Original file | Final file |
|---|---|---|
| Filename | modeM0/AS1A04_199T01_9000002040_13795cztM0_level2.evt | modeM0/AS1A04_199T01_9000002040_13795cztM0_level2_quad_clean.evt |
| Size (bytes) | 485,876,160 | 64,532,160 |
| Size | 463.4 MB | 61.5 MB |
| Events in quadrant A | 3,854,039 | 380,573 |
| Events in quadrant B | 3,412,493 | 389,998 |
| Events in quadrant C | 3,184,412 | 376,107 |
| Events in quadrant D | 3,828,079 | 359,056 |
| Mode M9 | |||
|---|---|---|---|
| Quadrant | BADHDUFLAG | Total packets | Discarded packets |
| A | 0 | 22 | 0 |
| B | 0 | 22 | 0 |
| C | 0 | 22 | 0 |
| D | 0 | 23 | 0 |
| Mode SS | |||
|---|---|---|---|
| Quadrant | BADHDUFLAG | Total packets | Discarded packets |
| A | 0 | 130 | 0 |
| B | 0 | 130 | 0 |
| C | 0 | 130 | 0 |
| D | 0 | 130 | 0 |
| Mode M0 | |||
|---|---|---|---|
| Quadrant | BADHDUFLAG | Total packets | Discarded packets |
| A | 0 | 15388 | 3 |
| B | 0 | 13847 | 2 |
| C | 0 | 13346 | 2 |
| D | 0 | 15537 | 2 |
| Quadrant | Total seconds | Saturated seconds | Saturation percentage |
|---|---|---|---|
| A | 6423 | 75 | 1.167679% |
| B | 6423 | 87 | 1.354507% |
| C | 6423 | 20 | 0.311381% |
| D | 6423 | 80 | 1.245524% |
Noise dominated data is calculated using 1-second bins in cleaned event files. If a bin has >2000 counts, and if more than 50% of those come from <1% of pixels, then it is considered to be noise-dominated and hence unusable.
| Quadrant | # 1 sec bins | Bins with >0 counts | Bins with >2000 counts | High rate bins dominated by noise | Noise dominated (total time) | Noise dominated (detector-on time) | Marked lightcurve |
|---|---|---|---|---|---|---|---|
| A | 7689 | 6425 | 11 | 11 | 0.14% | 0.17% | 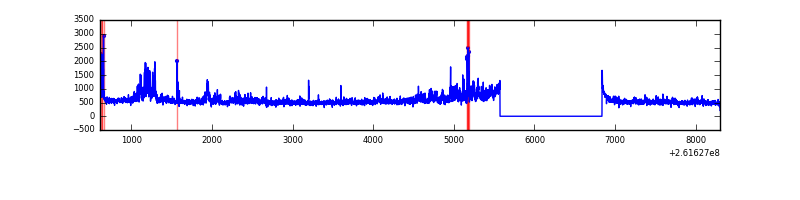 |
| B | 7689 | 6425 | 6 | 6 | 0.08% | 0.09% | 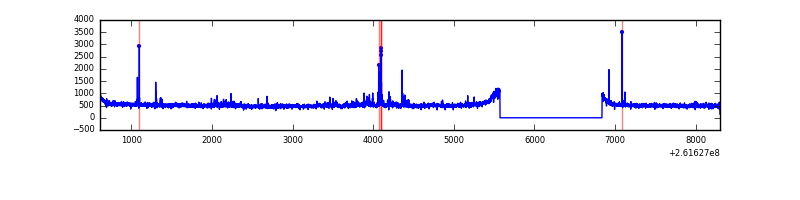 |
| C | 7689 | 6425 | 1 | 1 | 0.01% | 0.02% | 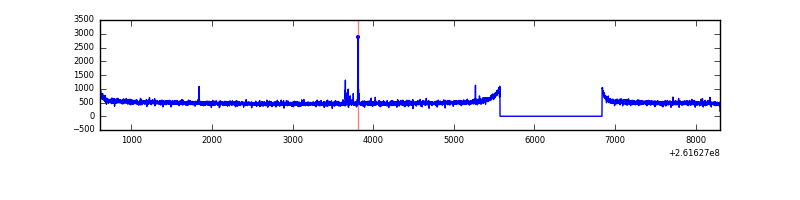 |
| D | 7689 | 6425 | 42 | 42 | 0.55% | 0.65% | 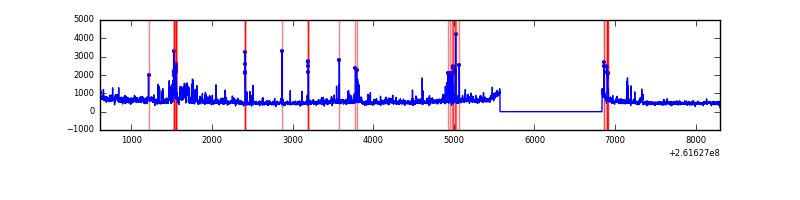 |
Top three noisy pixels from each quadrant. If the there are fewer than three noisy pixels in the level2.evt file, extra rows are filled as -1
| Pixel properties | Quadrant properties | ||||||
|---|---|---|---|---|---|---|---|
| Quadrant | DetID | PixID | Counts | Sigma | Mean | Median | Sigma |
| A | 8 | 15 | 582728 | 3488.62 | 824 | 808 | 166.8 |
| A | 9 | 143 | 64248 | 380.32 | 824 | 808 | 166.8 |
| A | 1 | 162 | 23639 | 136.87 | 824 | 808 | 166.8 |
| B | 15 | 222 | 53599 | 337.75 | 829 | 811 | 156.3 |
| B | 0 | 214 | 45985 | 289.04 | 829 | 811 | 156.3 |
| B | 0 | 219 | 38045 | 238.24 | 829 | 811 | 156.3 |
| C | 3 | 233 | 65396 | 350.67 | 795 | 800 | 184.2 |
| C | 14 | 234 | 19725 | 102.74 | 795 | 800 | 184.2 |
| C | 13 | 61 | 5691 | 26.55 | 795 | 800 | 184.2 |
| D | 1 | 52 | 492382 | 2614.78 | 784 | 766 | 188.0 |
| D | 10 | 157 | 257110 | 1363.43 | 784 | 766 | 188.0 |
| D | 13 | 249 | 73771 | 388.3 | 784 | 766 | 188.0 |
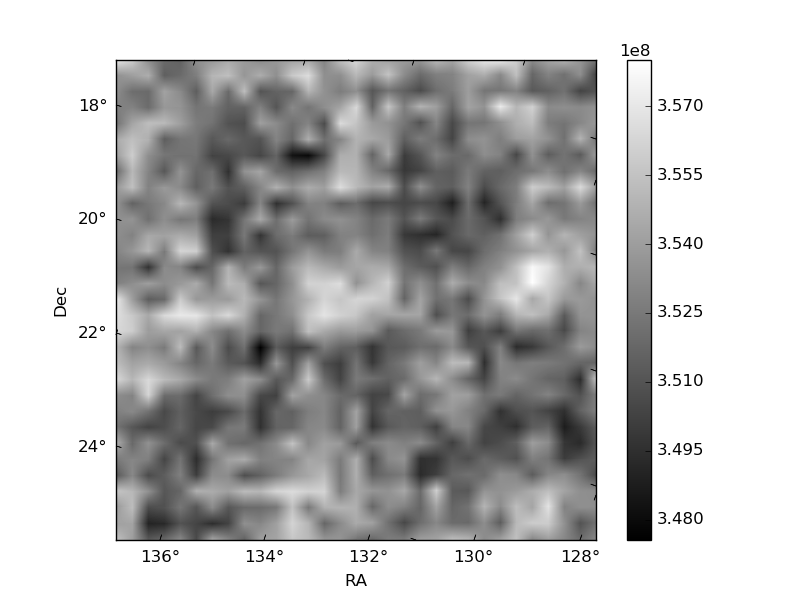
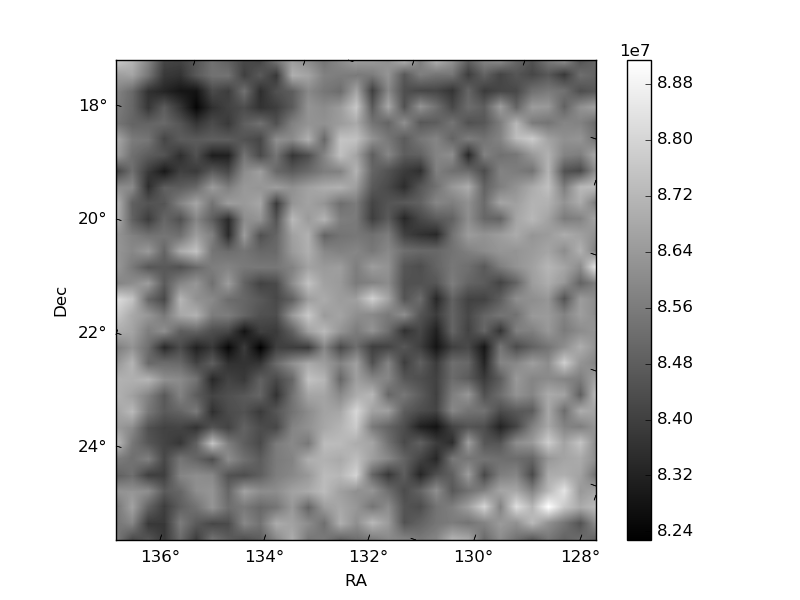
Histogram calculated using DETX and DETY for each event in the final _common_clean file
| Quadrant A | 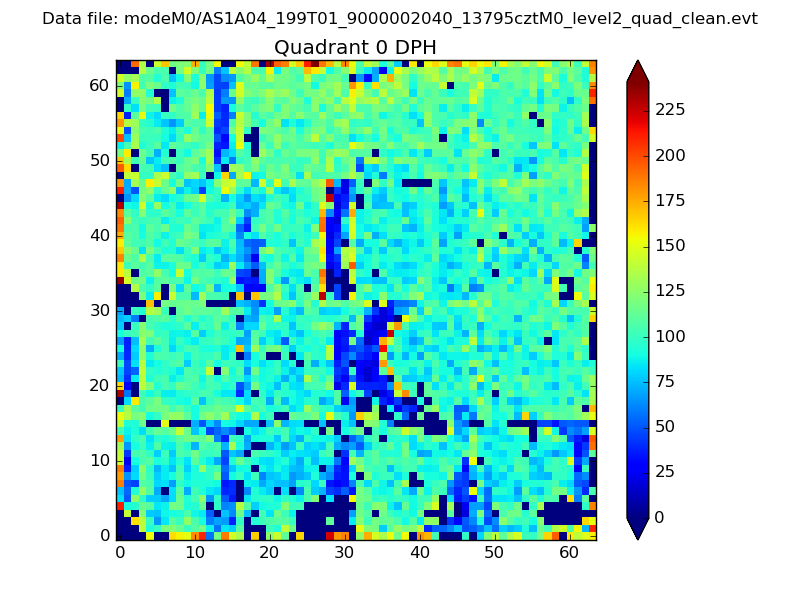 |
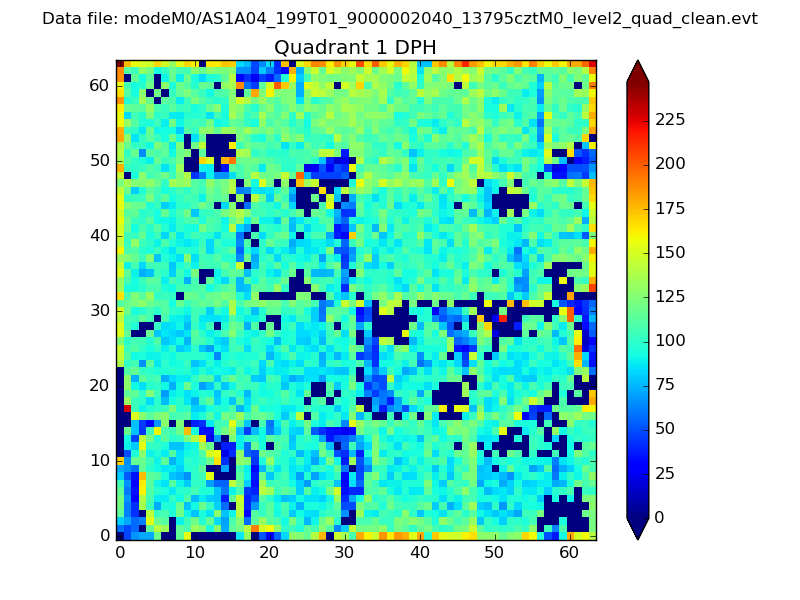 |
Quadrant B |
|---|---|---|---|
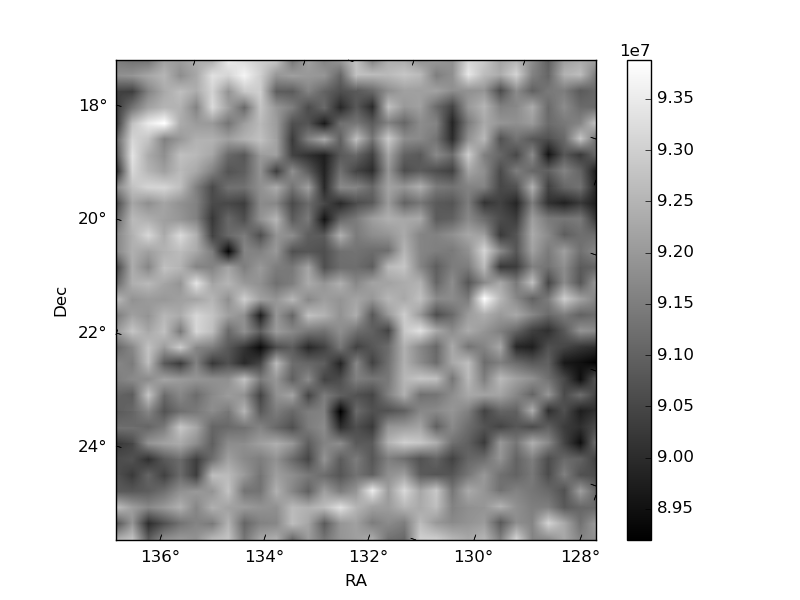
| Quadrant D | 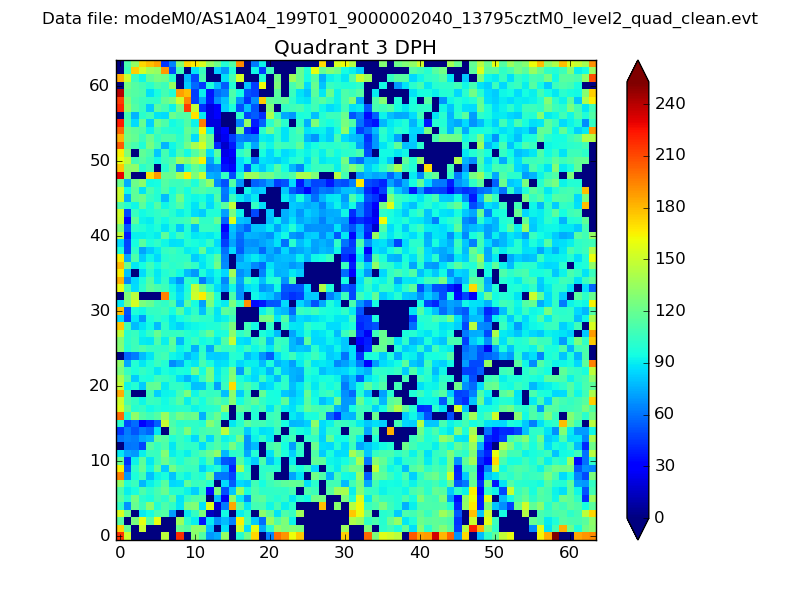 |
 |
Quadrant C |
| Plot type | Count rate plots | Images |
|---|---|---|
| Comparison with Poisson distribution Blue bars denote a histogram of data divided into 1 sec bins. Red curve is a Poisson curve with rate = median count rate of data. |
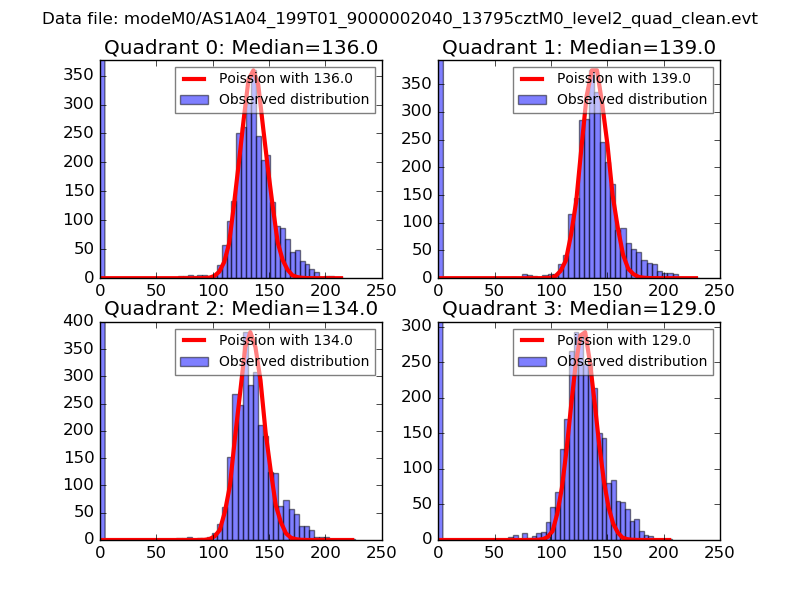 |
 |
| Quadrant-wise count rates Data is divided into 100 sec bins |
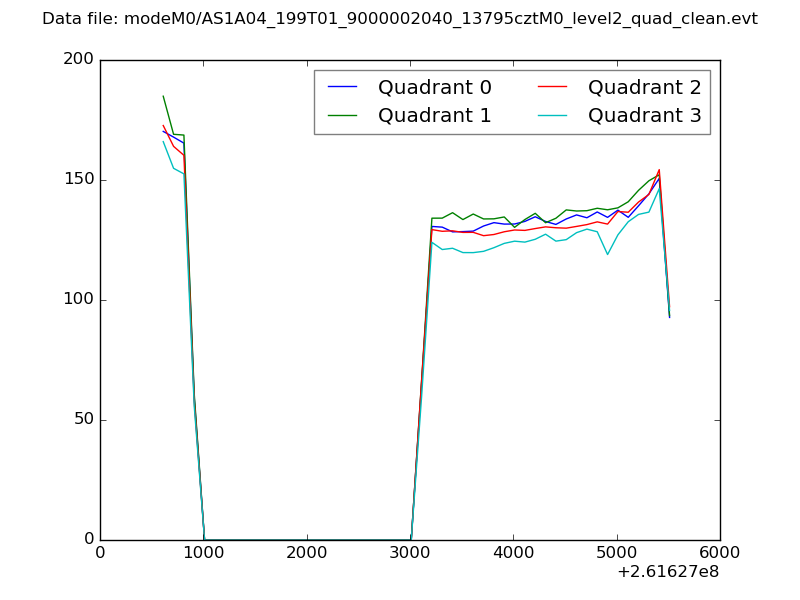 |
|
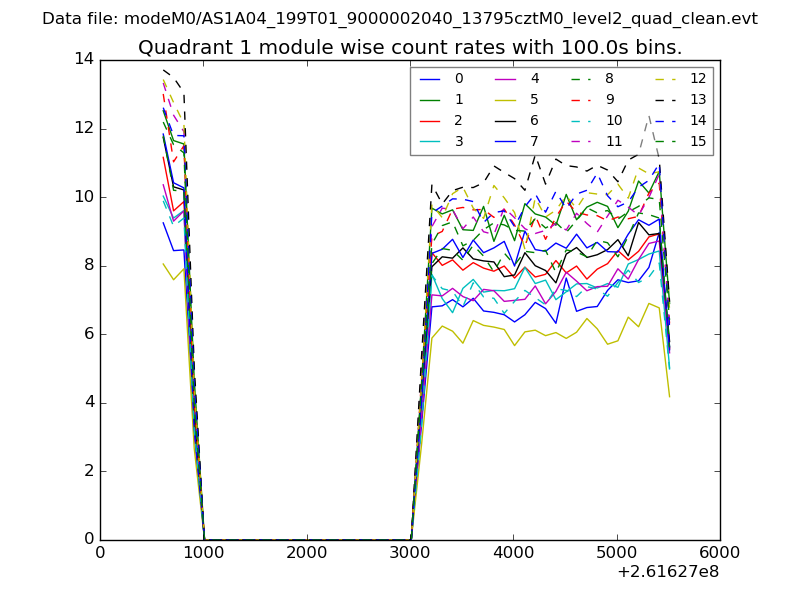
| Module-wise count rates for Quadrant A Data is divided into 100 sec bins |
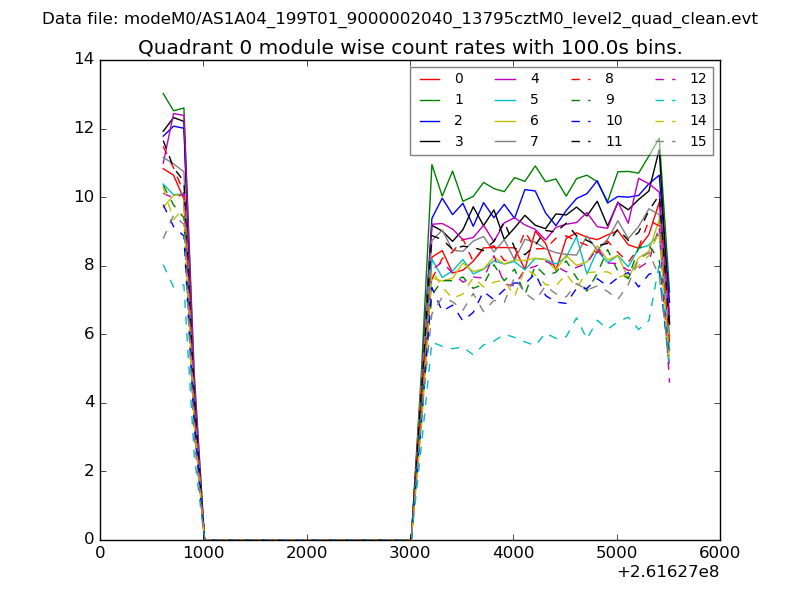 |
 |
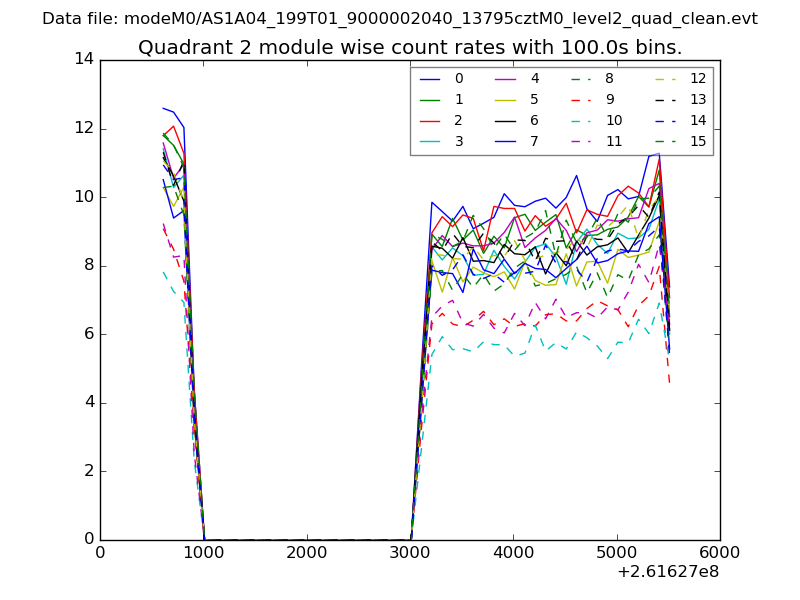
| Module-wise count rates for Quadrant B Data is divided into 100 sec bins |
 |
 |
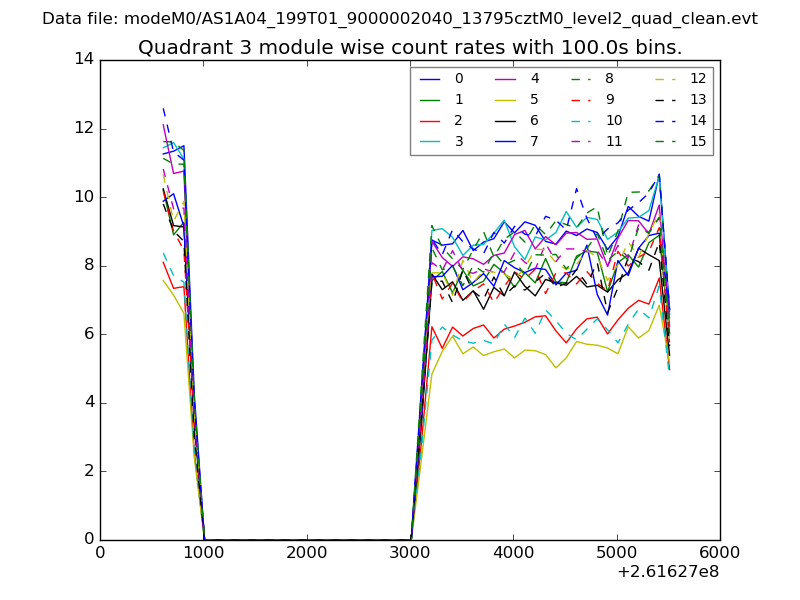
| Module-wise count rates for Quadrant C Data is divided into 100 sec bins |
 |
 |
| Module-wise count rates for Quadrant D Data is divided into 100 sec bins |
 |
 |
| Parameter | Plot |
|---|---|
| CZT HV Monitor | 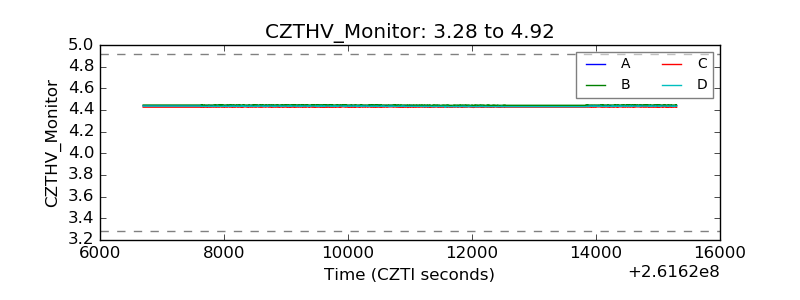 |
| D_VDD | 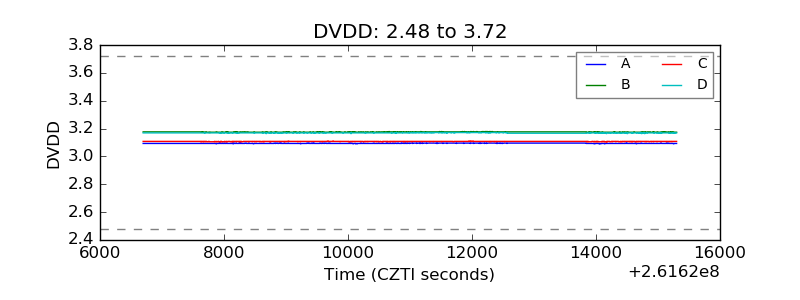 |
| Temperature 1 | 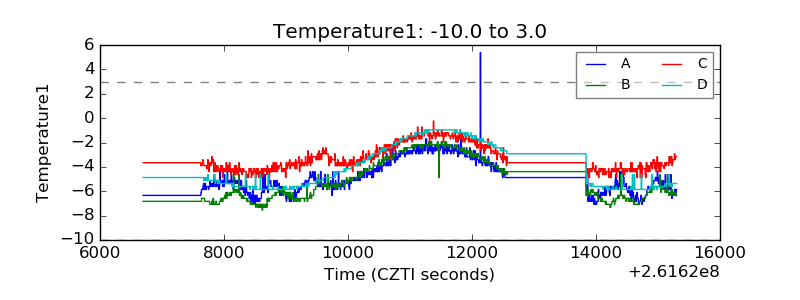 |
| Veto HV Monitor | 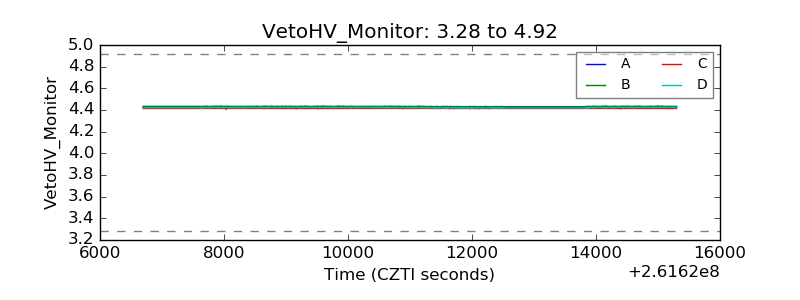 |
| Veto LLD | 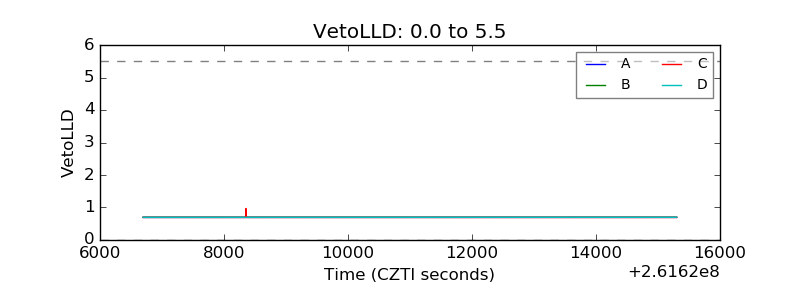 |
| Alpha Counter | 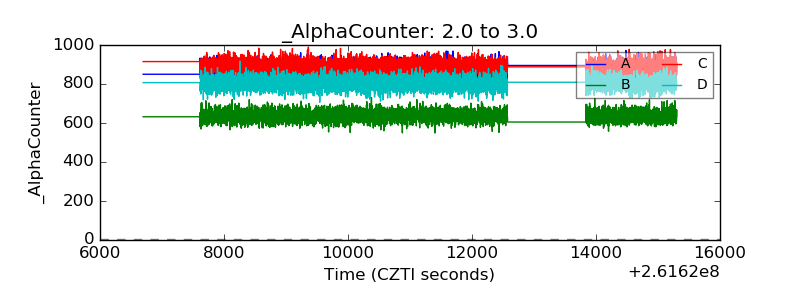 |
| _CPM_Rate |  |
| CZT Counter | 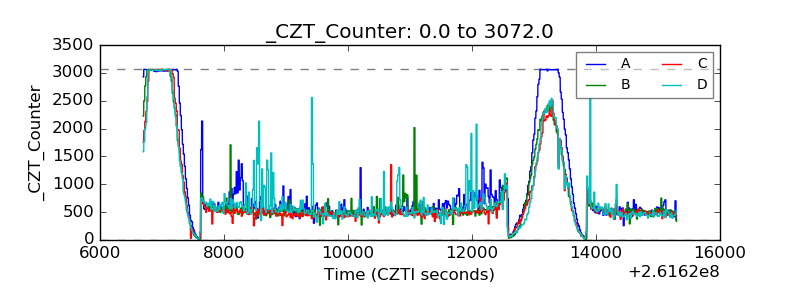 |
| +2.5 Volts monitor |  |
| +5 Volts monitor |  |
| _ROLL_ROT | 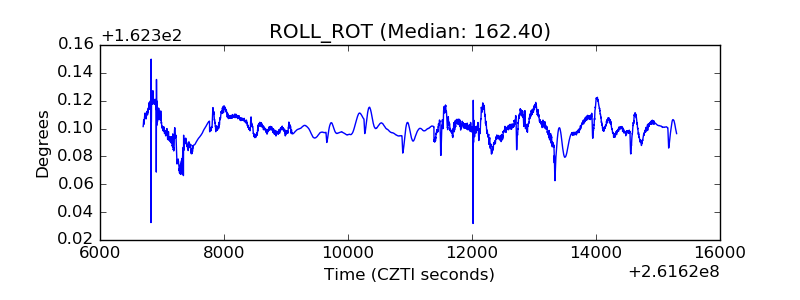 |
| _Roll_DEC | 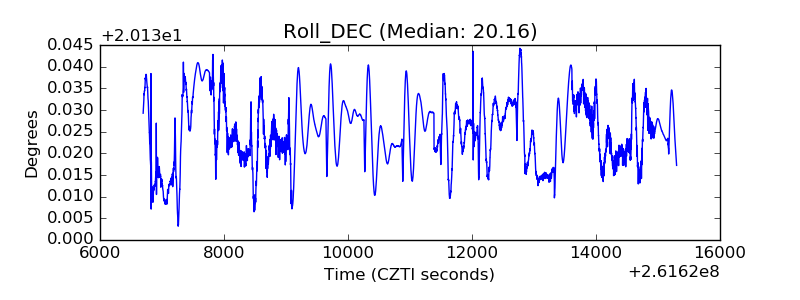 |
| _Roll_RA | 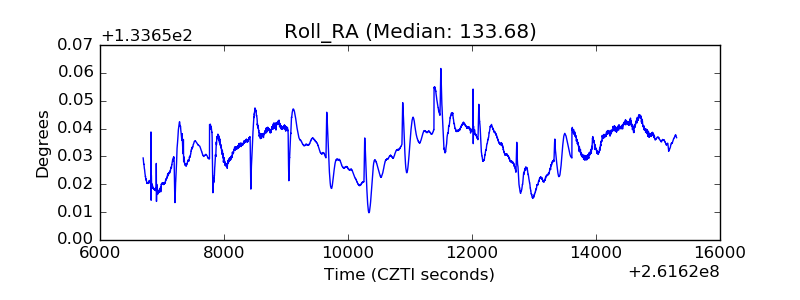 |
| Veto Counter | 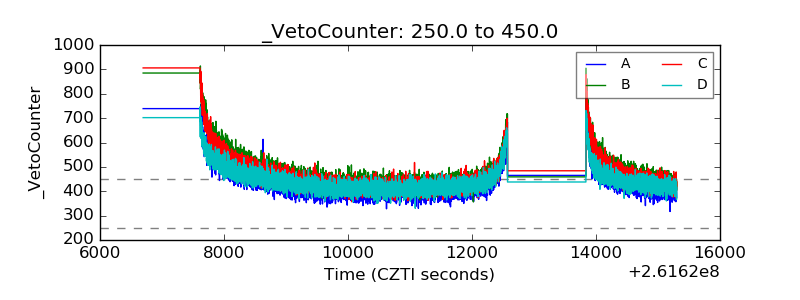 |