| Param | Original file | Final file |
|---|---|---|
| Filename | modeM0/AS1A04_199T01_9000002040_13796cztM0_level2.evt | modeM0/AS1A04_199T01_9000002040_13796cztM0_level2_quad_clean.evt |
| Size (bytes) | 475,485,120 | 68,497,920 |
| Size | 453.5 MB | 65.3 MB |
| Events in quadrant A | 3,439,842 | 406,471 |
| Events in quadrant B | 3,620,618 | 409,384 |
| Events in quadrant C | 3,306,999 | 401,063 |
| Events in quadrant D | 3,573,873 | 386,345 |
| Mode M9 | |||
|---|---|---|---|
| Quadrant | BADHDUFLAG | Total packets | Discarded packets |
| A | 0 | 15 | 0 |
| B | 0 | 15 | 0 |
| C | 0 | 15 | 0 |
| D | 0 | 16 | 0 |
| Mode SS | |||
|---|---|---|---|
| Quadrant | BADHDUFLAG | Total packets | Discarded packets |
| A | 0 | 138 | 0 |
| B | 0 | 138 | 0 |
| C | 0 | 138 | 0 |
| D | 0 | 138 | 0 |
| Mode M0 | |||
|---|---|---|---|
| Quadrant | BADHDUFLAG | Total packets | Discarded packets |
| A | 0 | 14243 | 3 |
| B | 0 | 14832 | 2 |
| C | 0 | 14034 | 2 |
| D | 0 | 14905 | 2 |
| Quadrant | Total seconds | Saturated seconds | Saturation percentage |
|---|---|---|---|
| A | 6750 | 103 | 1.525926% |
| B | 6750 | 169 | 2.503704% |
| C | 6750 | 76 | 1.125926% |
| D | 6750 | 120 | 1.777778% |
Noise dominated data is calculated using 1-second bins in cleaned event files. If a bin has >2000 counts, and if more than 50% of those come from <1% of pixels, then it is considered to be noise-dominated and hence unusable.
| Quadrant | # 1 sec bins | Bins with >0 counts | Bins with >2000 counts | High rate bins dominated by noise | Noise dominated (total time) | Noise dominated (detector-on time) | Marked lightcurve |
|---|---|---|---|---|---|---|---|
| A | 7721 | 6751 | 1 | 1 | 0.01% | 0.01% |  |
| B | 7721 | 6751 | 27 | 27 | 0.35% | 0.40% | 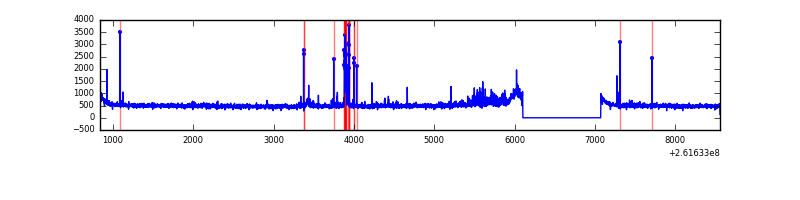 |
| C | 7721 | 6752 | 3 | 3 | 0.04% | 0.04% | 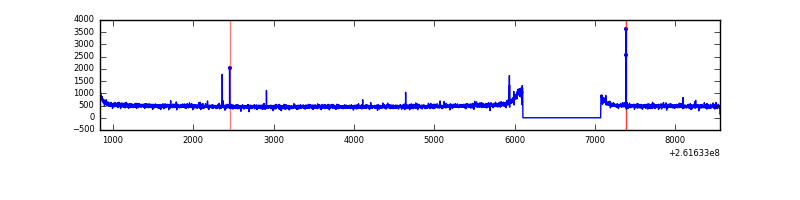 |
| D | 7721 | 6752 | 47 | 47 | 0.61% | 0.70% | 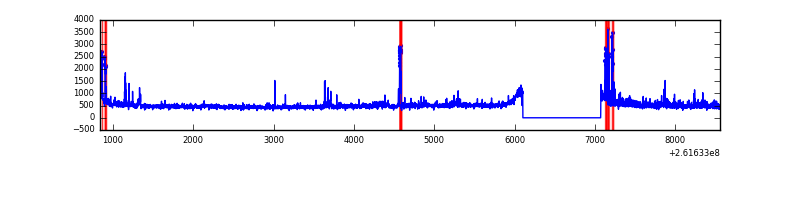 |
Top three noisy pixels from each quadrant. If the there are fewer than three noisy pixels in the level2.evt file, extra rows are filled as -1
| Pixel properties | Quadrant properties | ||||||
|---|---|---|---|---|---|---|---|
| Quadrant | DetID | PixID | Counts | Sigma | Mean | Median | Sigma |
| A | 8 | 15 | 130189 | 743.26 | 852 | 835 | 174.0 |
| A | 1 | 162 | 14920 | 80.93 | 852 | 835 | 174.0 |
| A | 0 | 23 | 10425 | 55.1 | 852 | 835 | 174.0 |
| B | 0 | 219 | 126454 | 770.27 | 851 | 831 | 163.1 |
| B | 15 | 222 | 89112 | 541.3 | 851 | 831 | 163.1 |
| B | 12 | 111 | 19064 | 111.79 | 851 | 831 | 163.1 |
| C | 3 | 233 | 70325 | 361.32 | 825 | 829 | 192.3 |
| C | 14 | 234 | 15051 | 73.94 | 825 | 829 | 192.3 |
| C | 13 | 61 | 5914 | 26.44 | 825 | 829 | 192.3 |
| D | 1 | 52 | 300998 | 1513.21 | 814 | 793 | 198.4 |
| D | 10 | 157 | 78912 | 393.77 | 814 | 793 | 198.4 |
| D | 13 | 249 | 50987 | 253.01 | 814 | 793 | 198.4 |
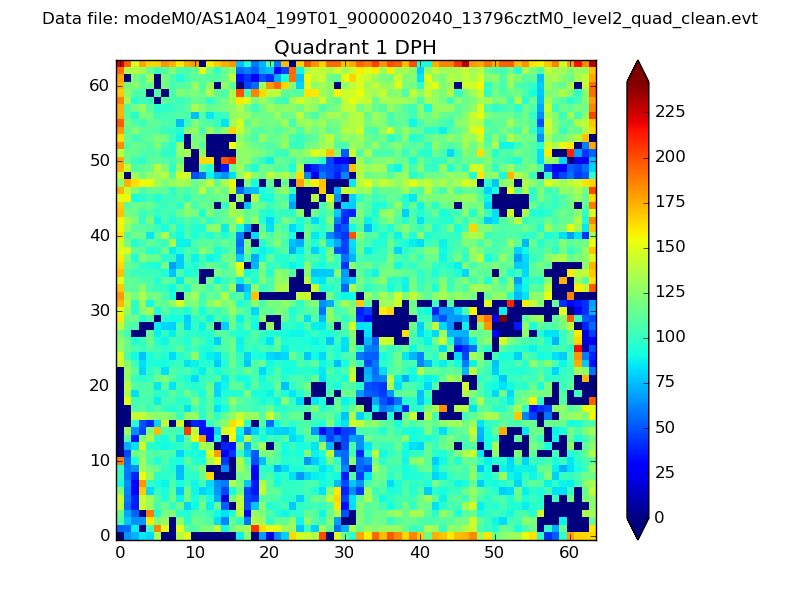
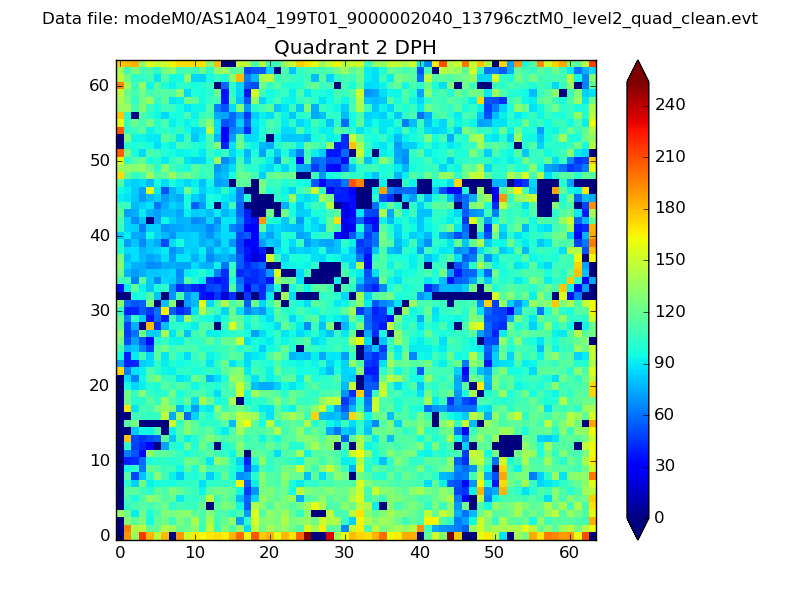
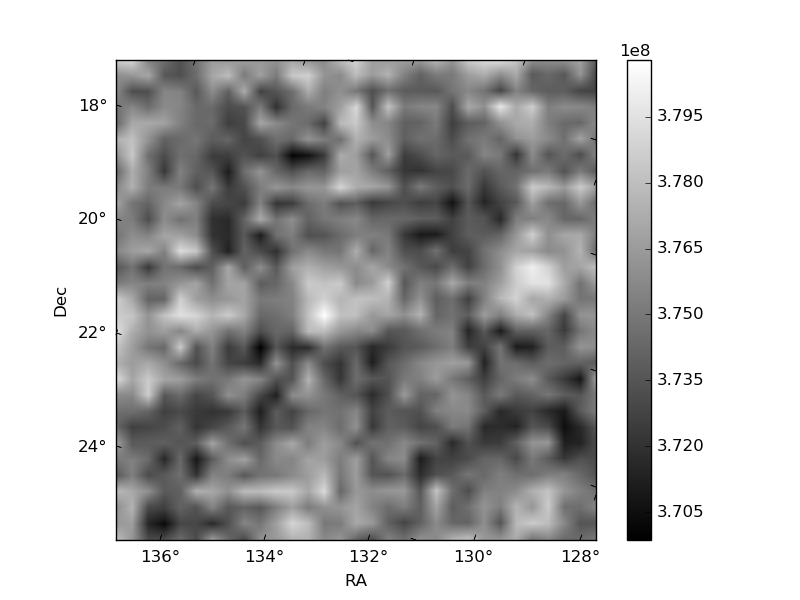
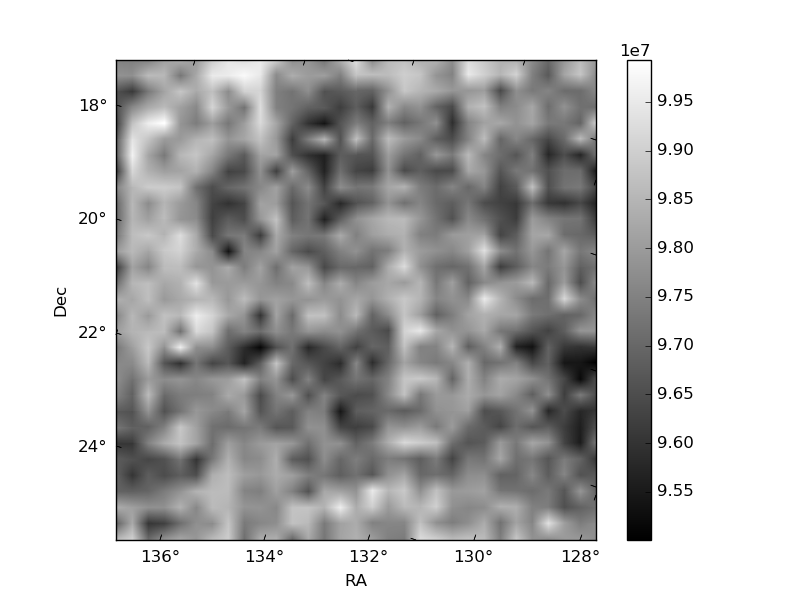
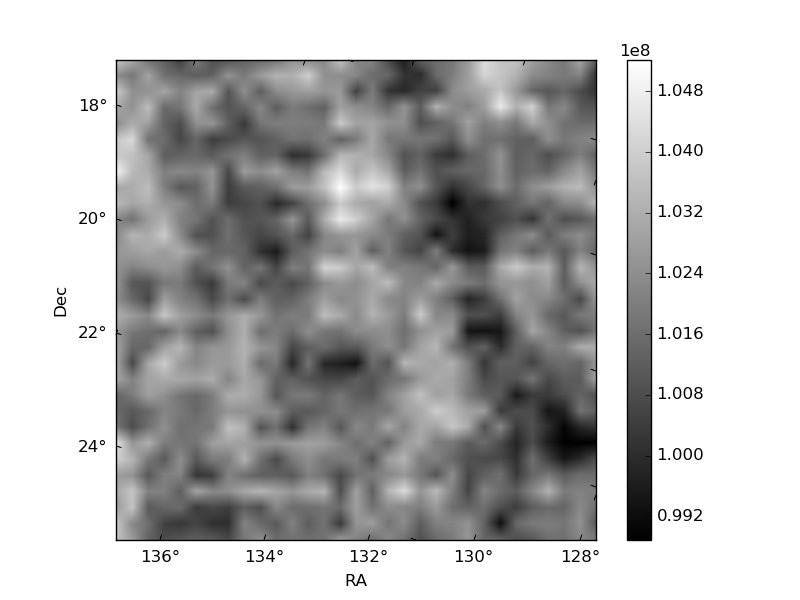
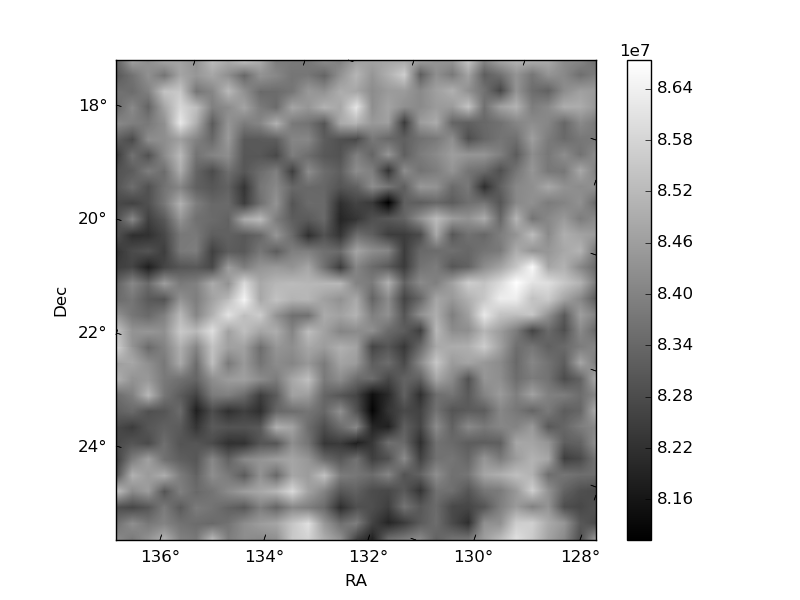
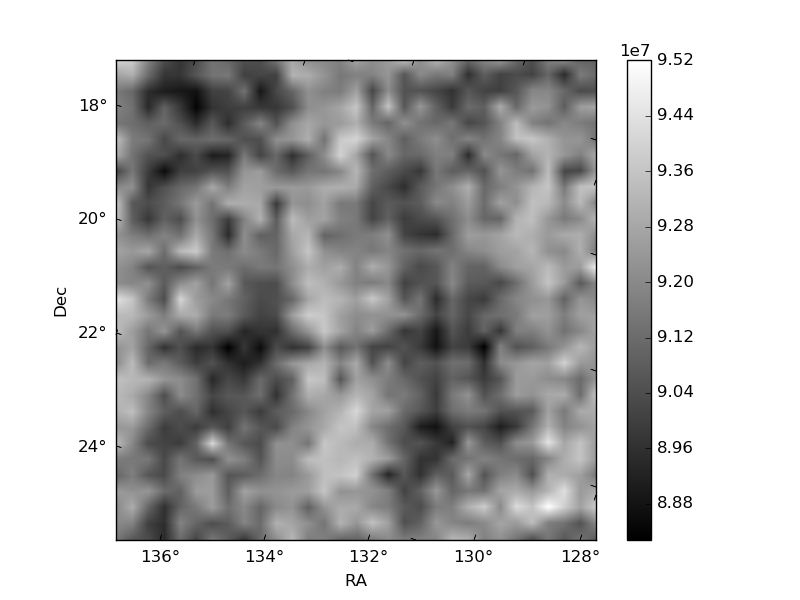
Histogram calculated using DETX and DETY for each event in the final _common_clean file
| Quadrant A | 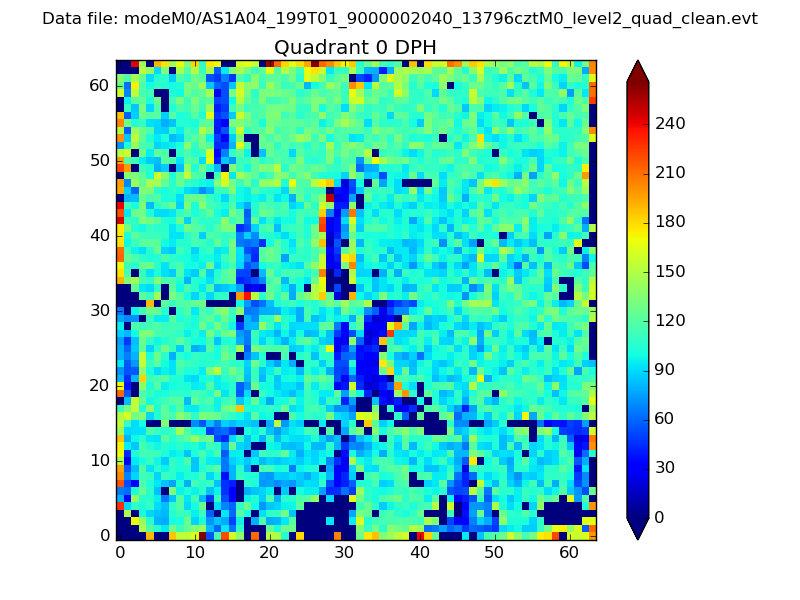 |
 |
Quadrant B |
|---|---|---|---|
| Quadrant D | 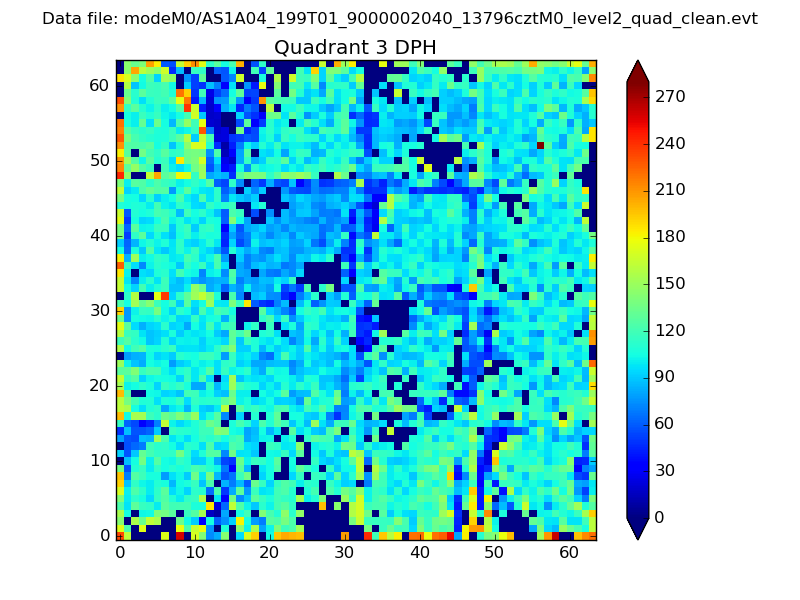 |
 |
Quadrant C |
| Plot type | Count rate plots | Images |
|---|---|---|
| Comparison with Poisson distribution Blue bars denote a histogram of data divided into 1 sec bins. Red curve is a Poisson curve with rate = median count rate of data. |
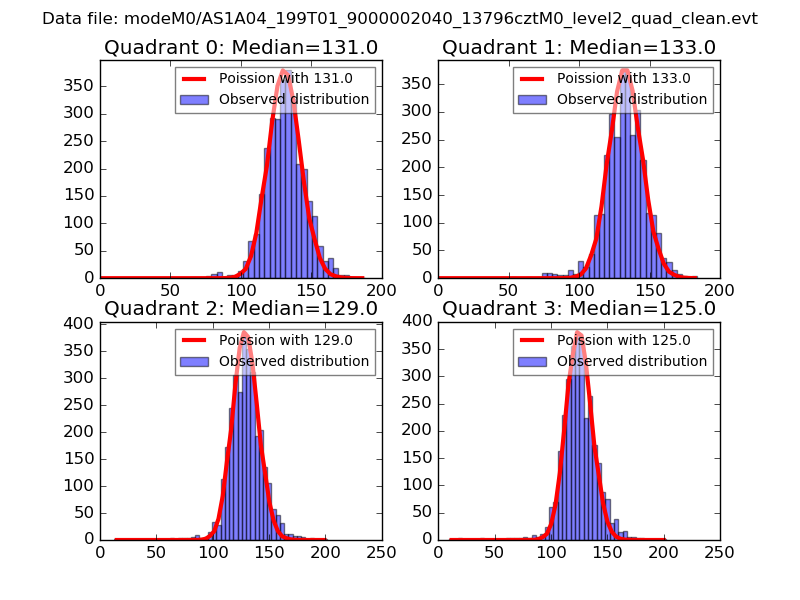 |
 |
| Quadrant-wise count rates Data is divided into 100 sec bins |
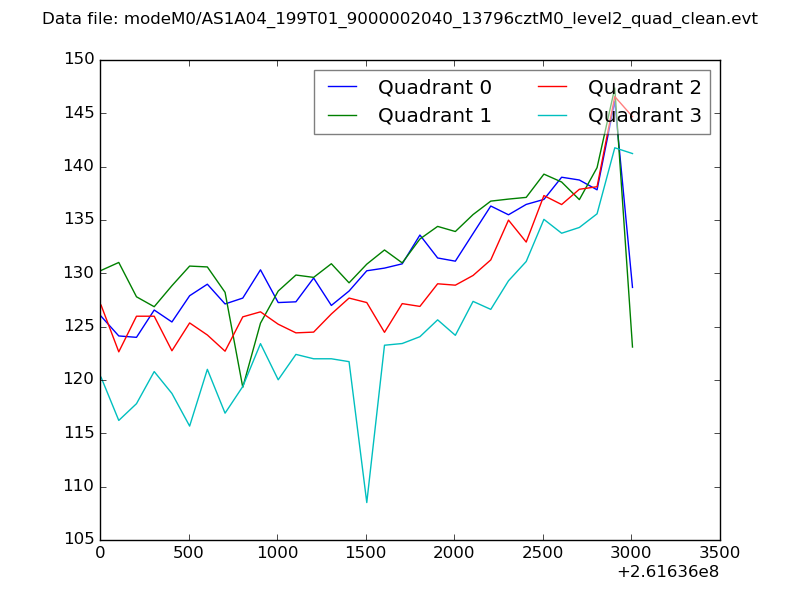 |
|
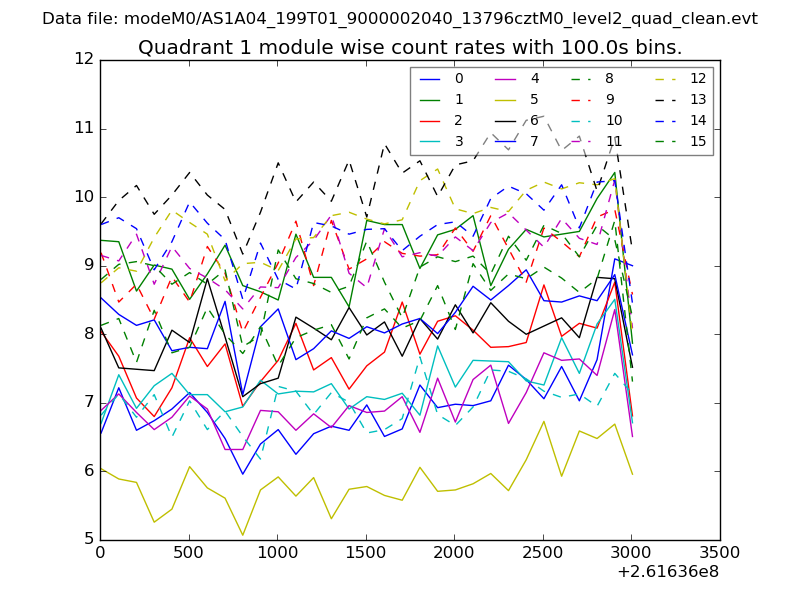
| Module-wise count rates for Quadrant A Data is divided into 100 sec bins |
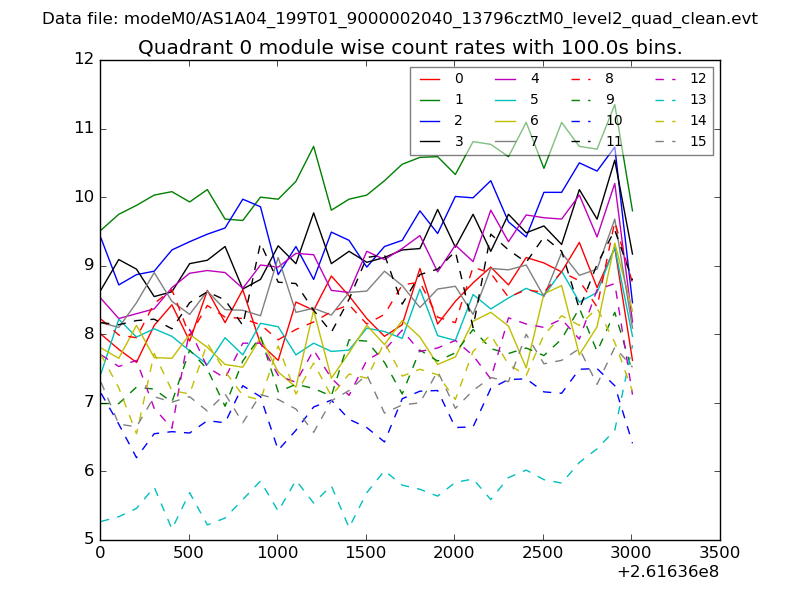 |
 |
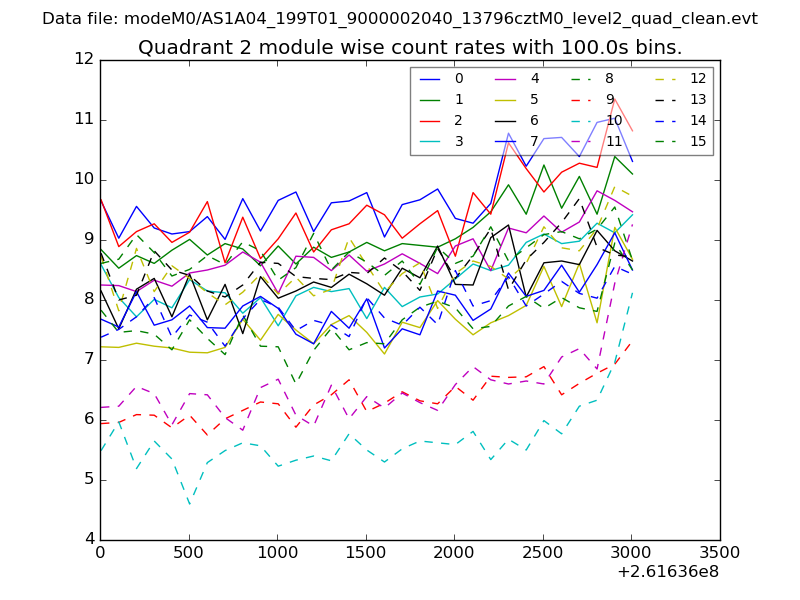
| Module-wise count rates for Quadrant B Data is divided into 100 sec bins |
 |
 |
| Module-wise count rates for Quadrant C Data is divided into 100 sec bins |
 |
 |
| Module-wise count rates for Quadrant D Data is divided into 100 sec bins |
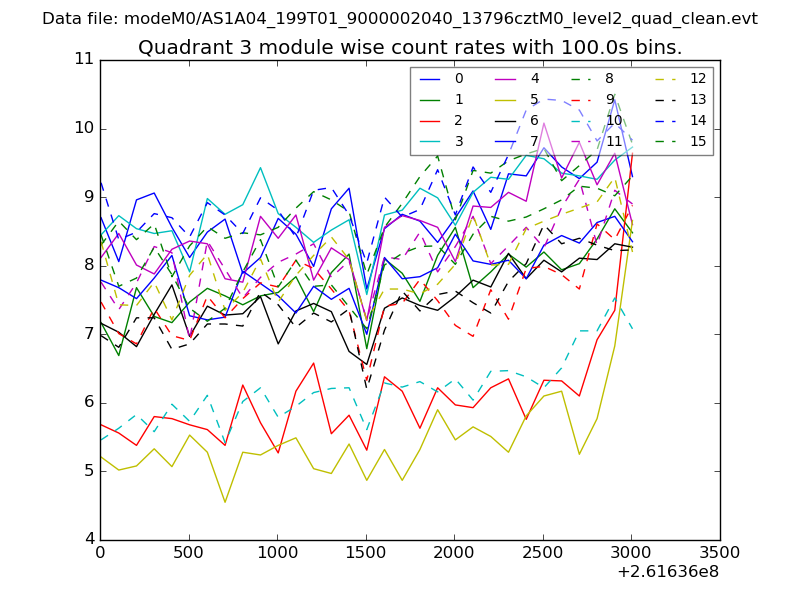 |
 |
| Parameter | Plot |
|---|---|
| CZT HV Monitor | 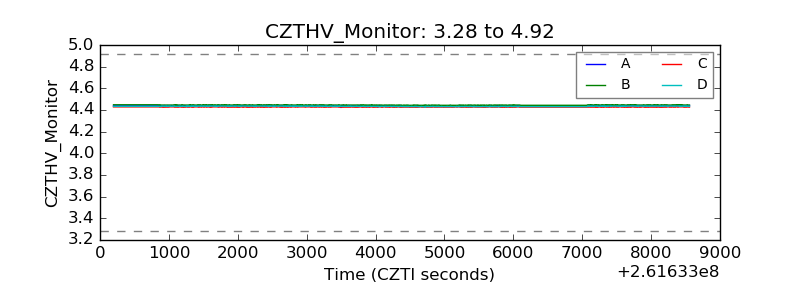 |
| D_VDD | 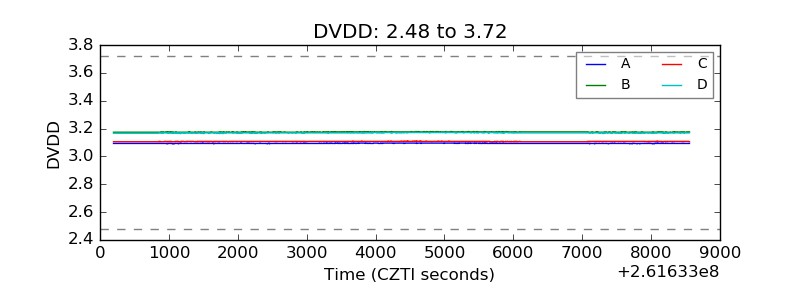 |
| Temperature 1 | 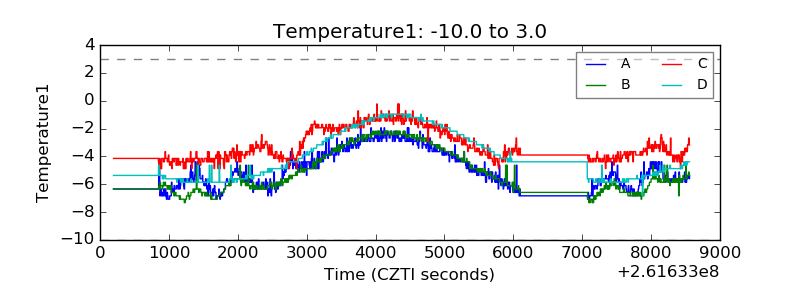 |
| Veto HV Monitor | 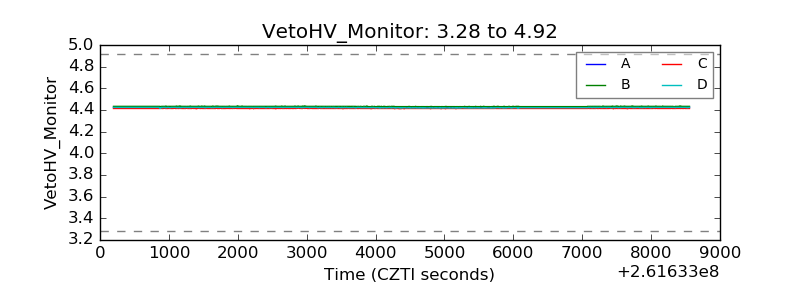 |
| Veto LLD | 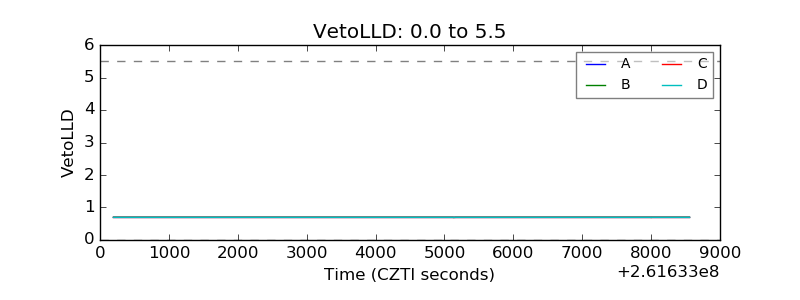 |
| Alpha Counter | 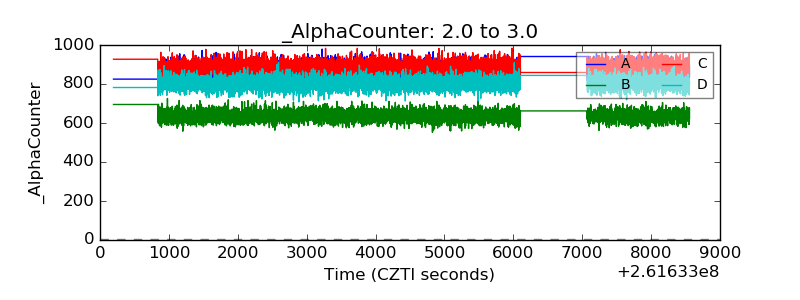 |
| _CPM_Rate | 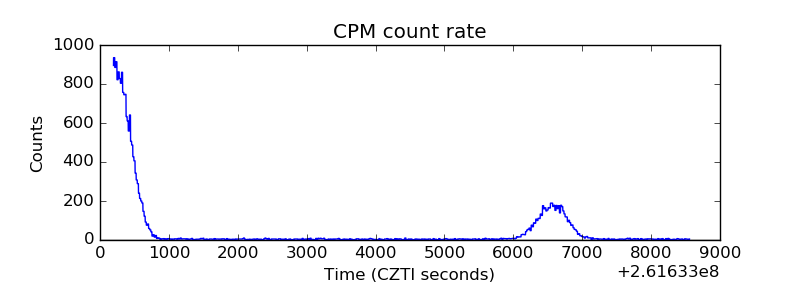 |
| CZT Counter | 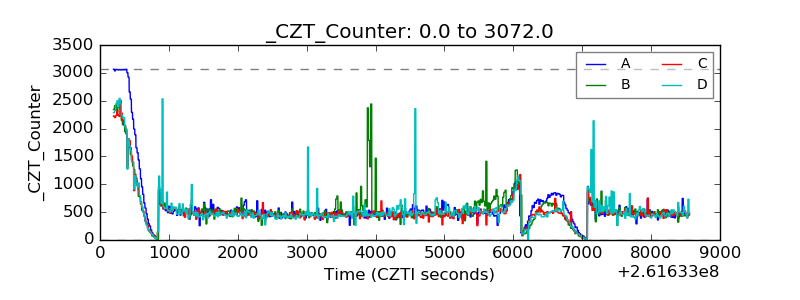 |
| +2.5 Volts monitor |  |
| +5 Volts monitor |  |
| _ROLL_ROT | 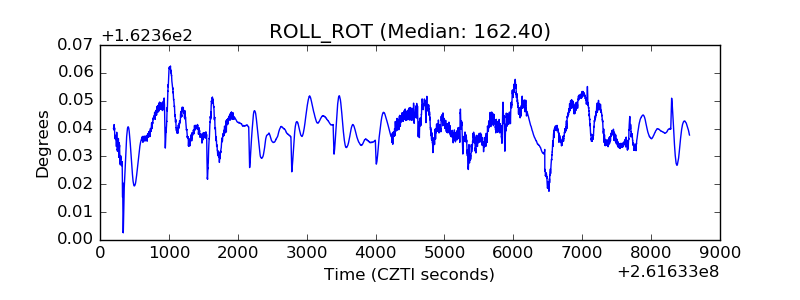 |
| _Roll_DEC | 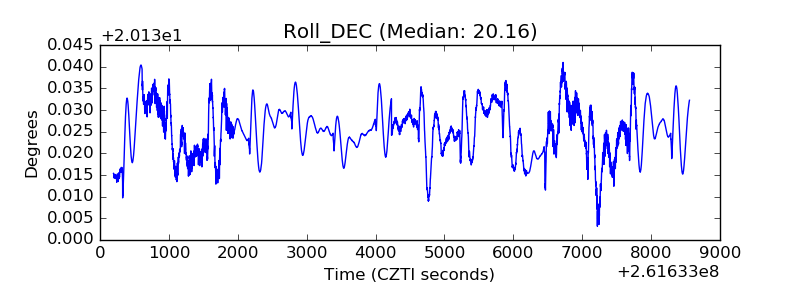 |
| _Roll_RA | 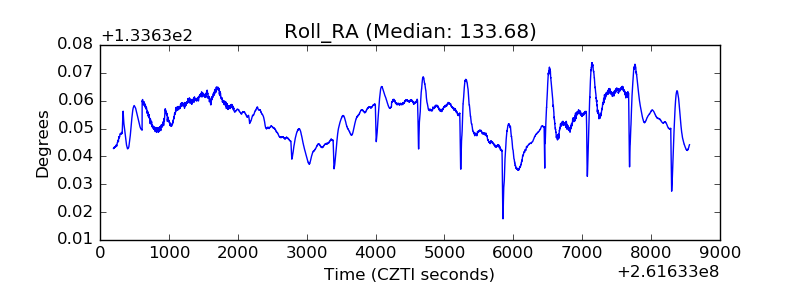 |
| Veto Counter | 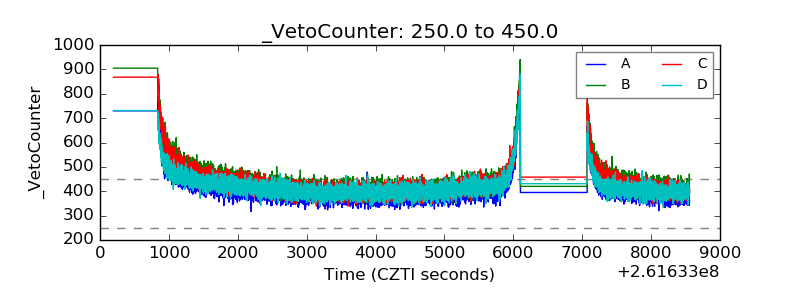 |