| Param | Original file | Final file |
|---|---|---|
| Filename | modeM0/AS1A04_199T01_9000002040_13797cztM0_level2.evt | modeM0/AS1A04_199T01_9000002040_13797cztM0_level2_quad_clean.evt |
| Size (bytes) | 569,848,320 | 94,861,440 |
| Size | 543.4 MB | 90.5 MB |
| Events in quadrant A | 3,976,601 | 585,138 |
| Events in quadrant B | 4,198,910 | 590,015 |
| Events in quadrant C | 3,957,491 | 578,811 |
| Events in quadrant D | 4,579,542 | 560,284 |
| Mode M9 | |||
|---|---|---|---|
| Quadrant | BADHDUFLAG | Total packets | Discarded packets |
| A | 0 | 14 | 0 |
| B | 0 | 14 | 0 |
| C | 0 | 14 | 0 |
| D | 0 | 14 | 0 |
| Mode SS | |||
|---|---|---|---|
| Quadrant | BADHDUFLAG | Total packets | Discarded packets |
| A | 0 | 166 | 0 |
| B | 0 | 166 | 0 |
| C | 0 | 166 | 0 |
| D | 0 | 166 | 0 |
| Mode M0 | |||
|---|---|---|---|
| Quadrant | BADHDUFLAG | Total packets | Discarded packets |
| A | 0 | 16841 | 3 |
| B | 0 | 17394 | 2 |
| C | 0 | 16846 | 2 |
| D | 0 | 18568 | 2 |
| Quadrant | Total seconds | Saturated seconds | Saturation percentage |
|---|---|---|---|
| A | 8029 | 246 | 3.063893% |
| B | 8029 | 307 | 3.823639% |
| C | 8029 | 184 | 2.291693% |
| D | 8029 | 245 | 3.051439% |
Noise dominated data is calculated using 1-second bins in cleaned event files. If a bin has >2000 counts, and if more than 50% of those come from <1% of pixels, then it is considered to be noise-dominated and hence unusable.
| Quadrant | # 1 sec bins | Bins with >0 counts | Bins with >2000 counts | High rate bins dominated by noise | Noise dominated (total time) | Noise dominated (detector-on time) | Marked lightcurve |
|---|---|---|---|---|---|---|---|
| A | 9535 | 8030 | 0 | 0 | 0.00% | 0.00% | 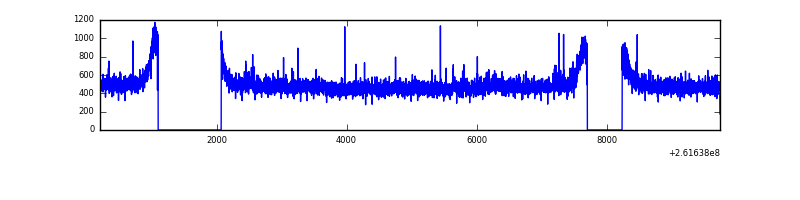 |
| B | 9535 | 8031 | 9 | 9 | 0.09% | 0.11% | 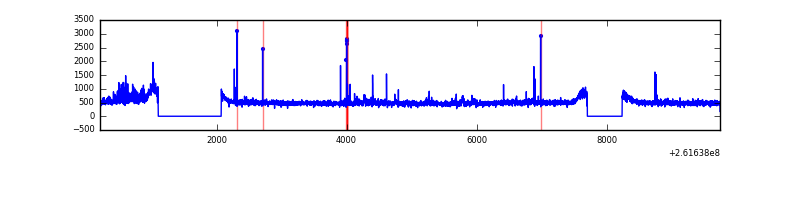 |
| C | 9535 | 8032 | 2 | 2 | 0.02% | 0.02% | 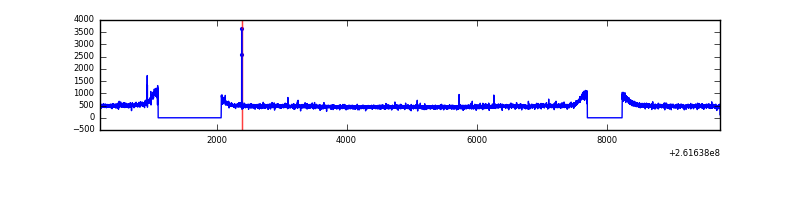 |
| D | 9535 | 8032 | 59 | 59 | 0.62% | 0.73% | 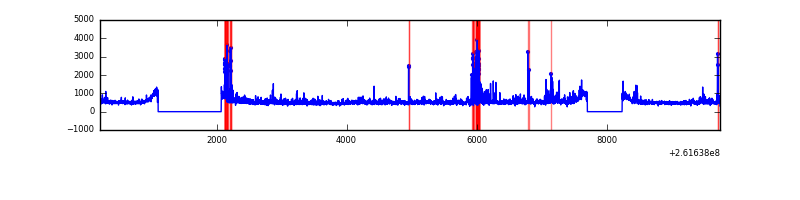 |
Top three noisy pixels from each quadrant. If the there are fewer than three noisy pixels in the level2.evt file, extra rows are filled as -1
| Pixel properties | Quadrant properties | ||||||
|---|---|---|---|---|---|---|---|
| Quadrant | DetID | PixID | Counts | Sigma | Mean | Median | Sigma |
| A | 8 | 15 | 48032 | 228.12 | 1011 | 986 | 206.2 |
| A | 1 | 162 | 23794 | 110.59 | 1011 | 986 | 206.2 |
| A | 0 | 226 | 9167 | 39.67 | 1011 | 986 | 206.2 |
| B | 0 | 219 | 146669 | 744.38 | 1010 | 984 | 195.7 |
| B | 3 | 209 | 30795 | 152.32 | 1010 | 984 | 195.7 |
| B | 12 | 111 | 23301 | 114.03 | 1010 | 984 | 195.7 |
| C | 3 | 233 | 101805 | 434.84 | 986 | 990 | 231.8 |
| C | 14 | 234 | 12315 | 48.85 | 986 | 990 | 231.8 |
| C | 13 | 61 | 7202 | 26.79 | 986 | 990 | 231.8 |
| D | 1 | 52 | 547754 | 2289.2 | 975 | 950 | 238.9 |
| D | 10 | 157 | 265636 | 1108.11 | 975 | 950 | 238.9 |
| D | 13 | 249 | 49188 | 201.95 | 975 | 950 | 238.9 |
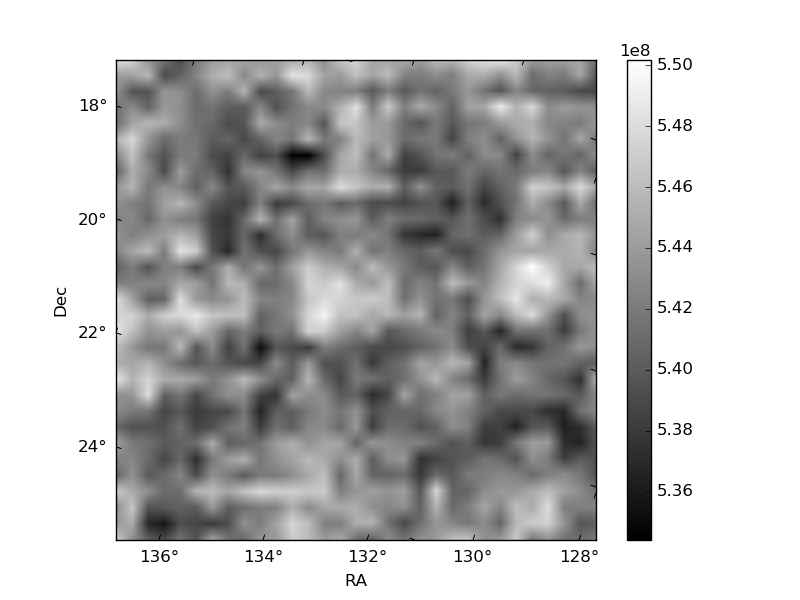
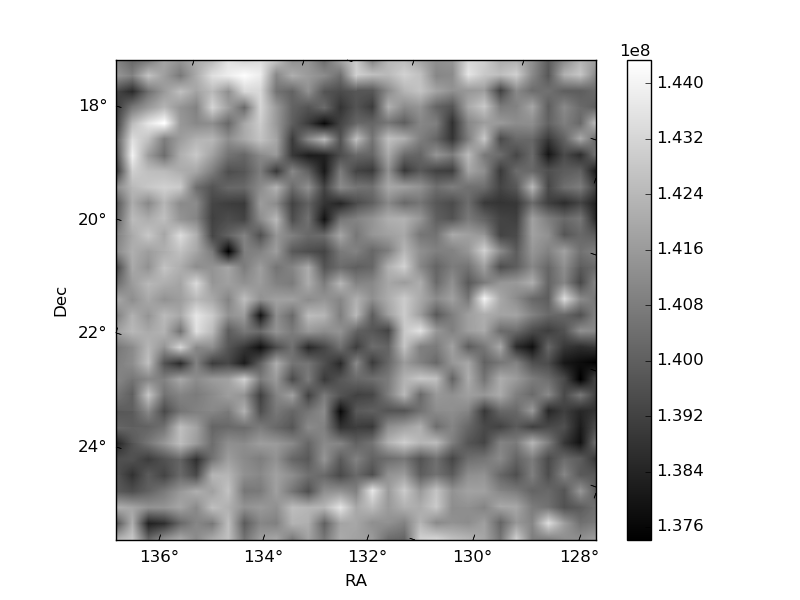
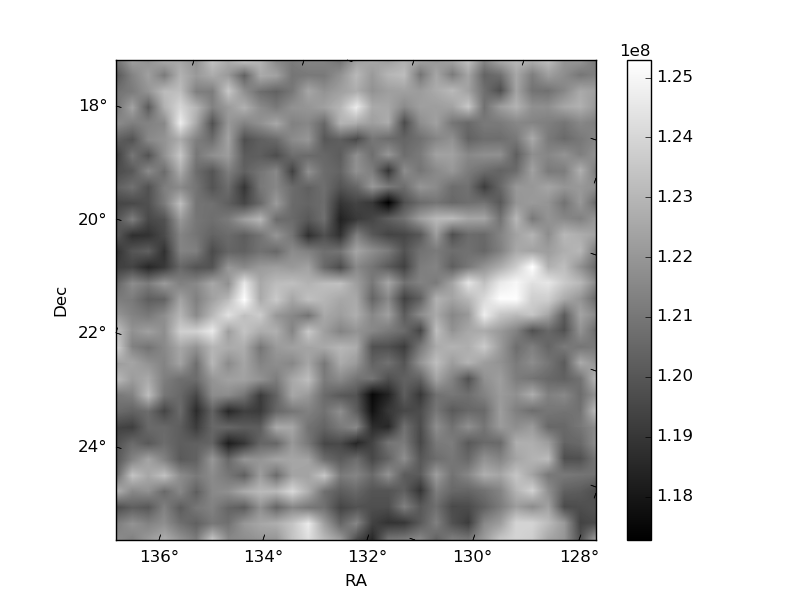
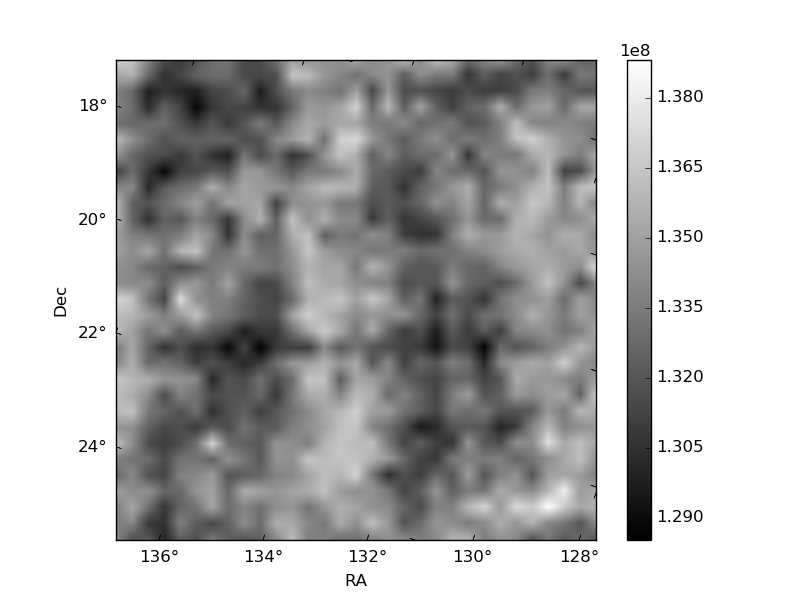
Histogram calculated using DETX and DETY for each event in the final _common_clean file
| Quadrant A | 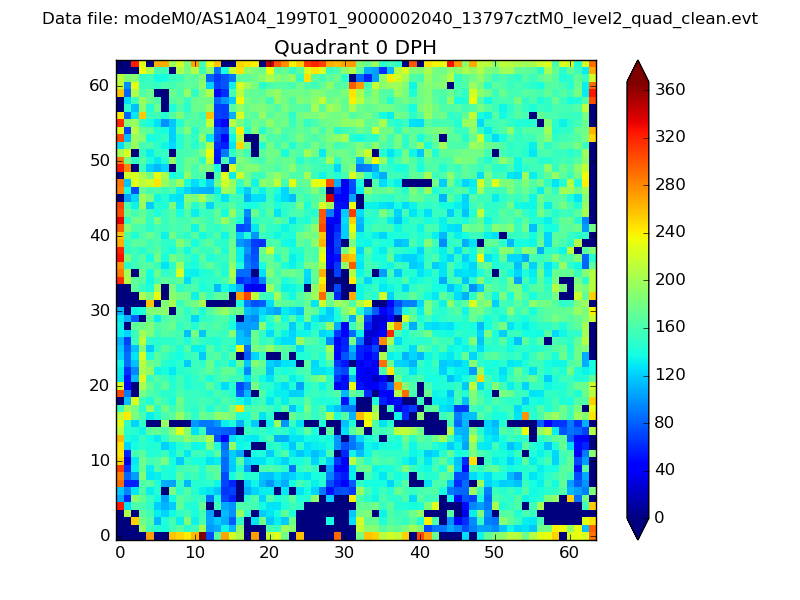 |
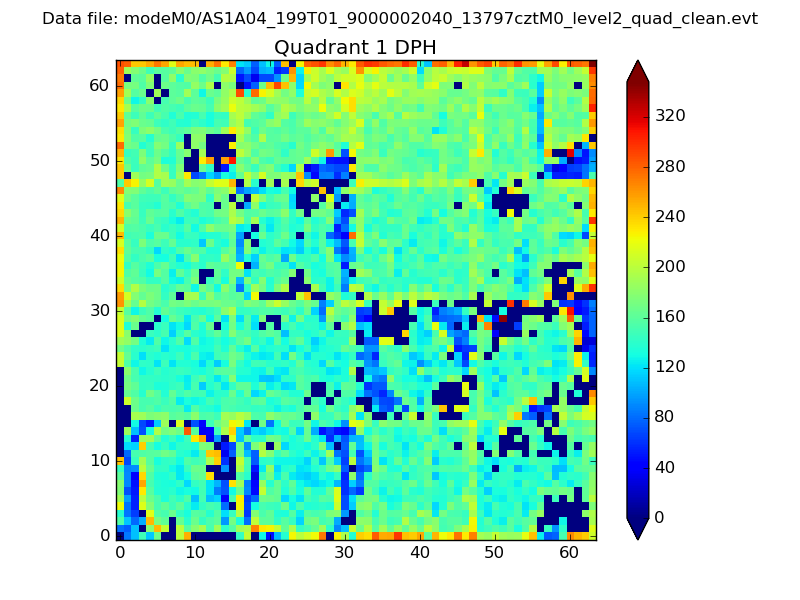 |
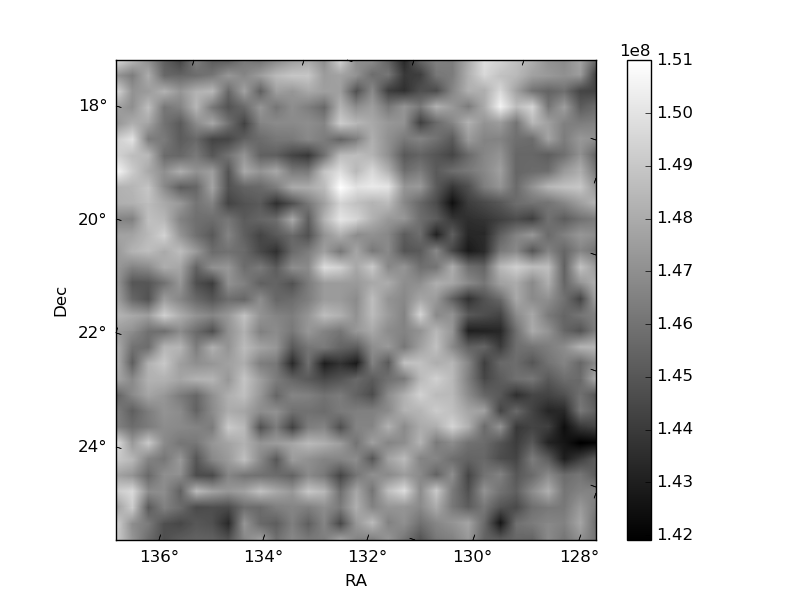
Quadrant B |
|---|---|---|---|
| Quadrant D | 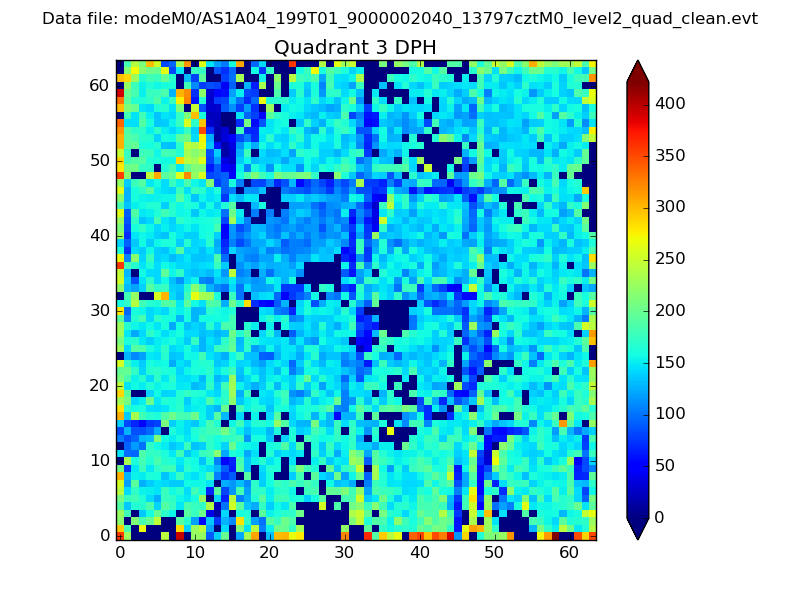 |
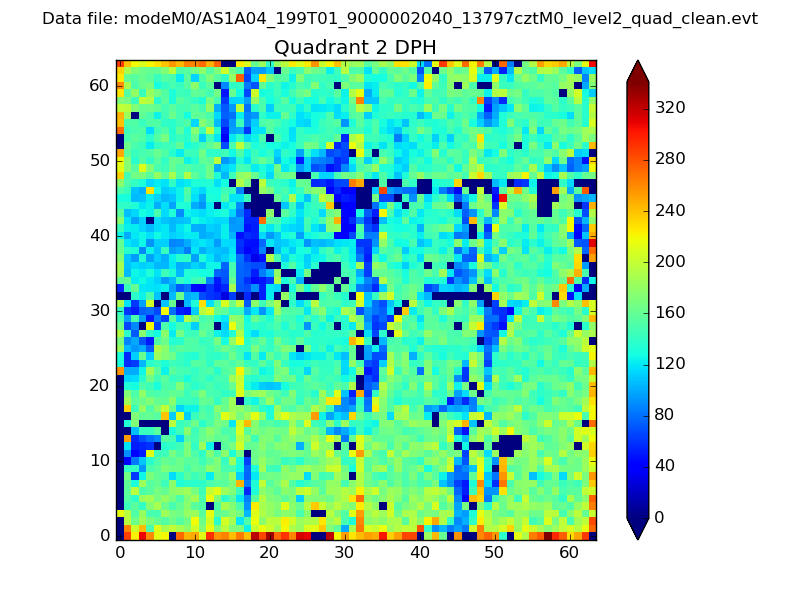 |
Quadrant C |
| Plot type | Count rate plots | Images |
|---|---|---|
| Comparison with Poisson distribution Blue bars denote a histogram of data divided into 1 sec bins. Red curve is a Poisson curve with rate = median count rate of data. |
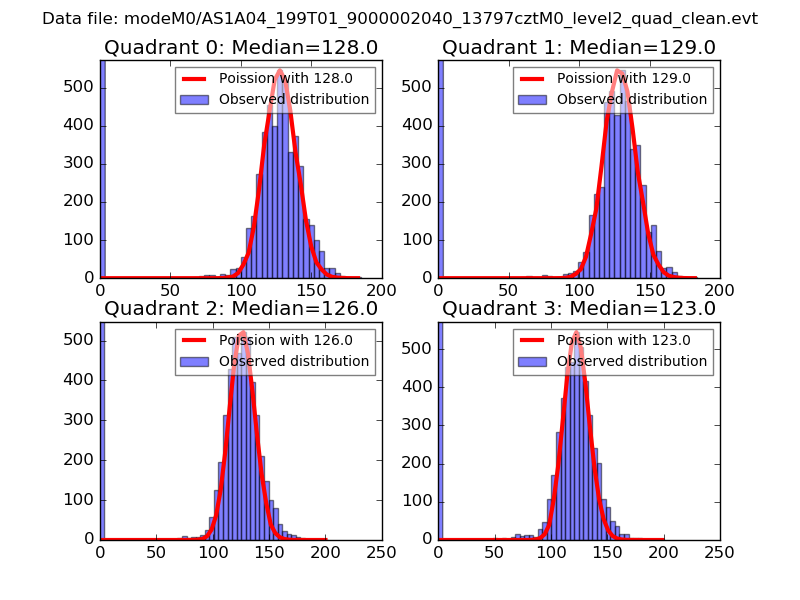 |
 |
| Quadrant-wise count rates Data is divided into 100 sec bins |
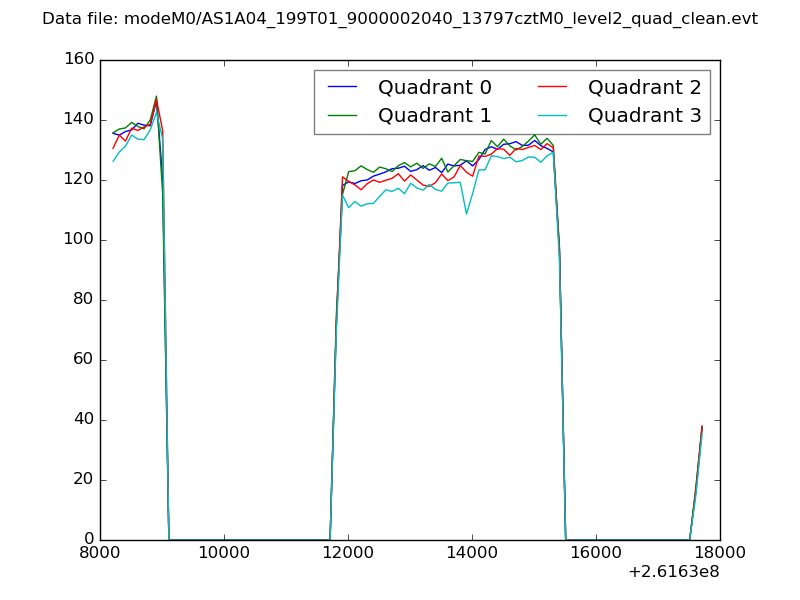 |
|
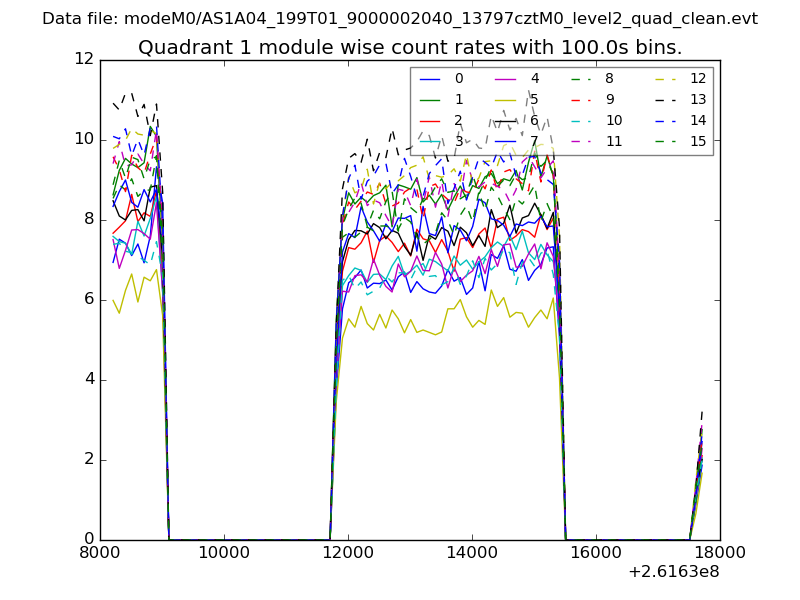
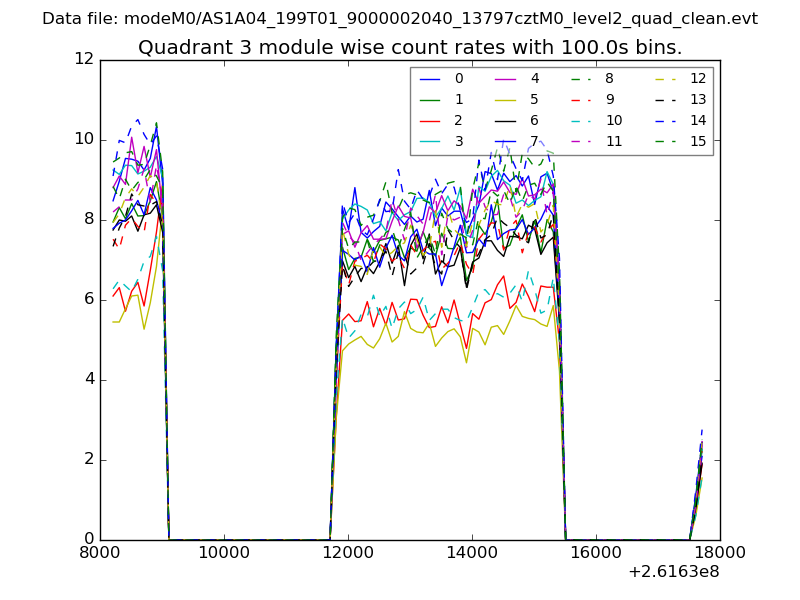
| Module-wise count rates for Quadrant A Data is divided into 100 sec bins |
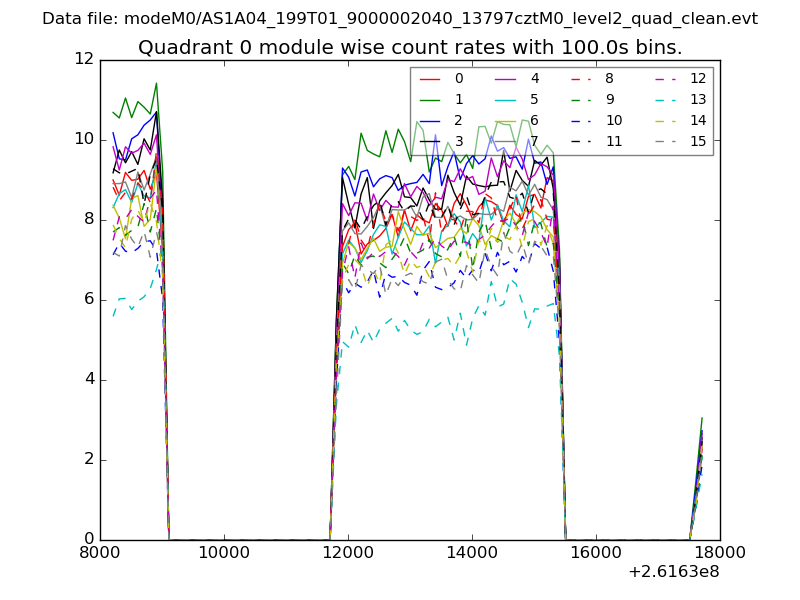 |
 |
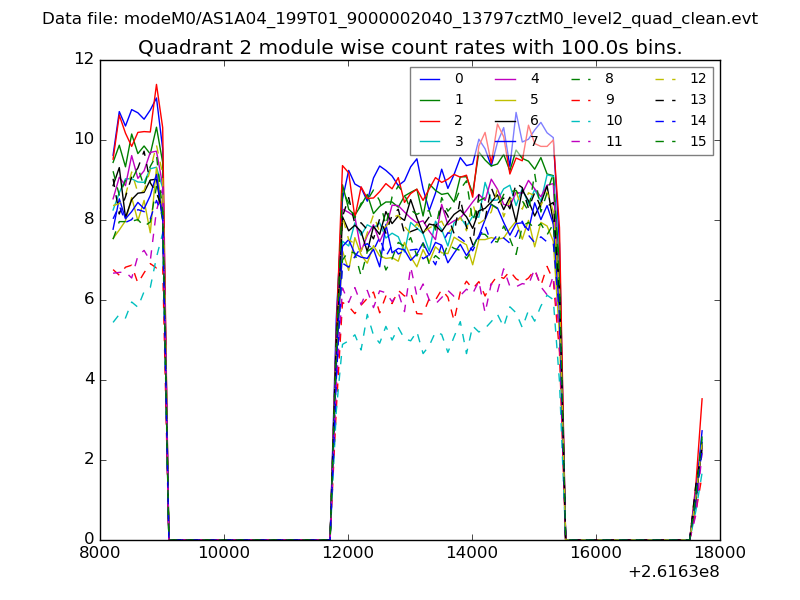
| Module-wise count rates for Quadrant B Data is divided into 100 sec bins |
 |
 |
| Module-wise count rates for Quadrant C Data is divided into 100 sec bins |
 |
 |
| Module-wise count rates for Quadrant D Data is divided into 100 sec bins |
 |
 |
| Parameter | Plot |
|---|---|
| CZT HV Monitor | 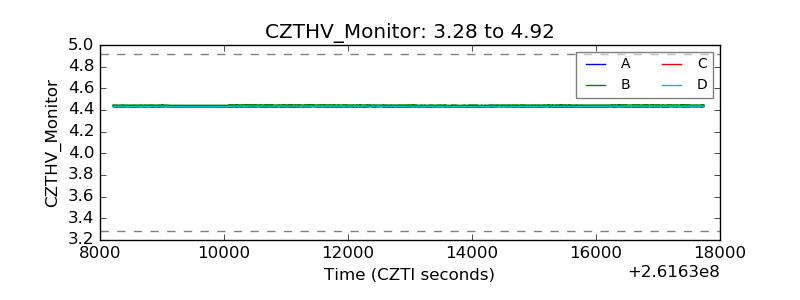 |
| D_VDD | 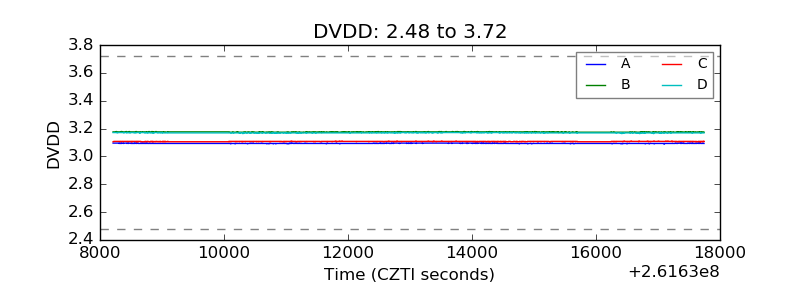 |
| Temperature 1 | 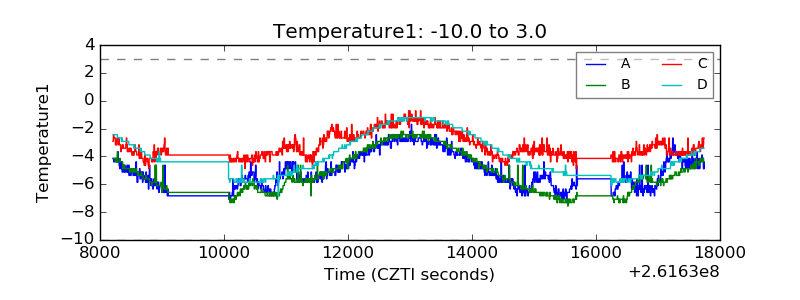 |
| Veto HV Monitor |  |
| Veto LLD | 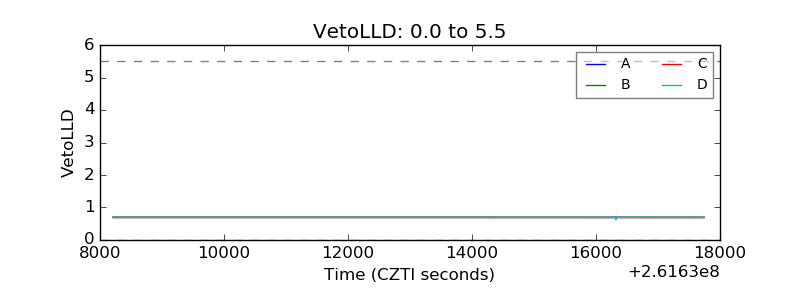 |
| Alpha Counter | 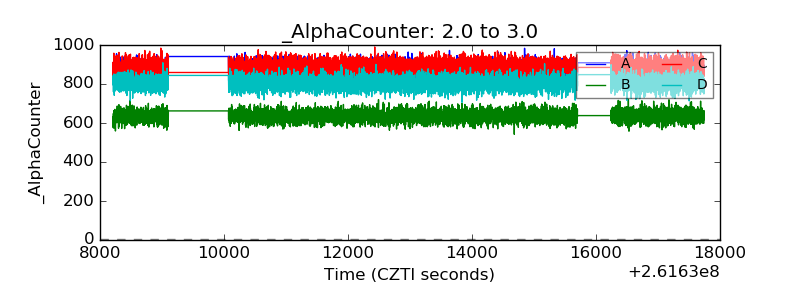 |
| _CPM_Rate | 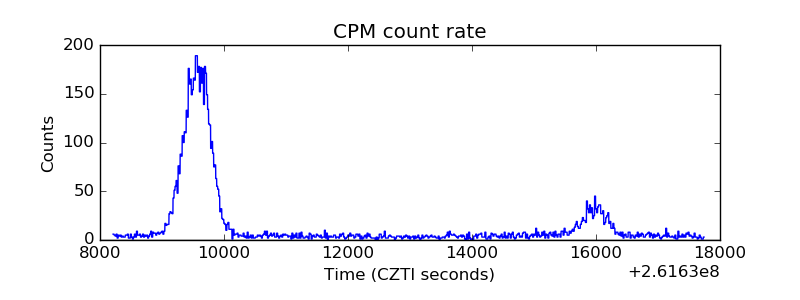 |
| CZT Counter | 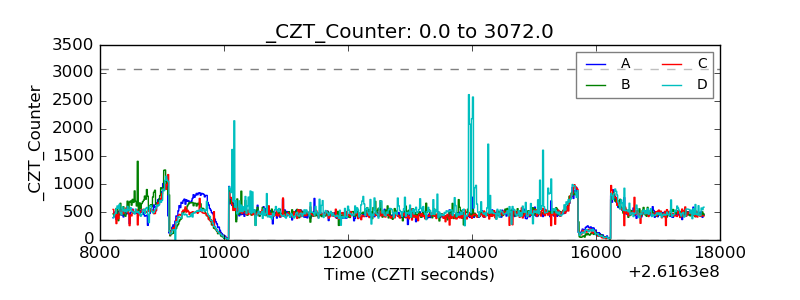 |
| +2.5 Volts monitor |  |
| +5 Volts monitor |  |
| _ROLL_ROT | 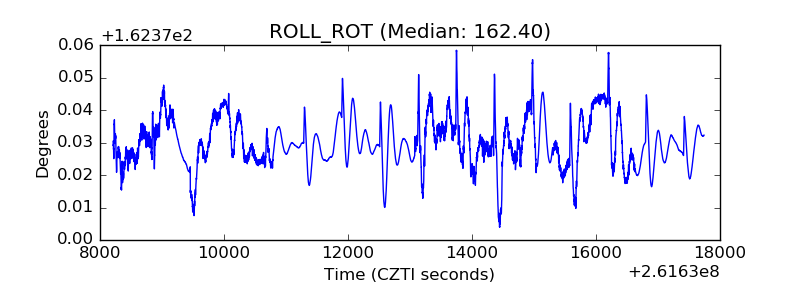 |
| _Roll_DEC | 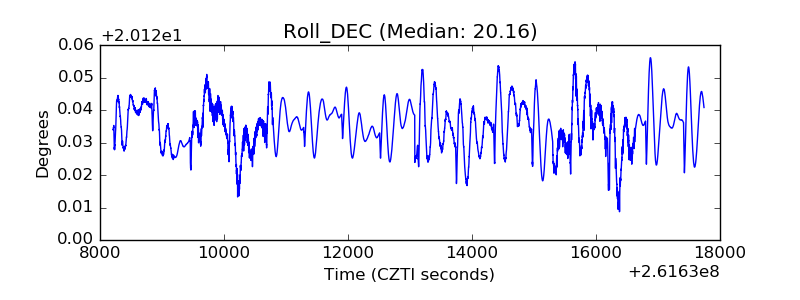 |
| _Roll_RA | 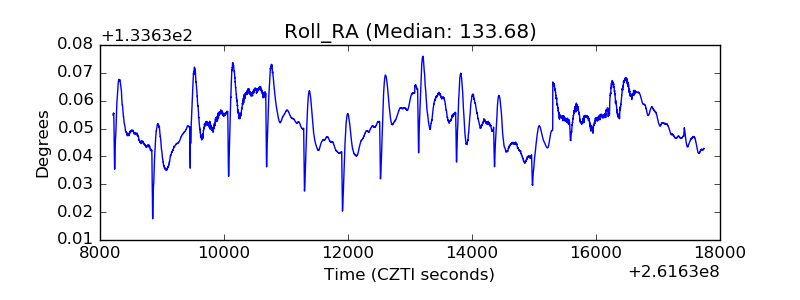 |
| Veto Counter | 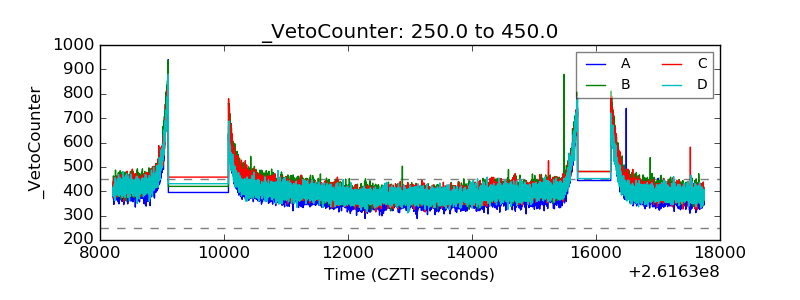 |