| Param | Original file | Final file |
|---|---|---|
| Filename | modeM0/AS1A04_199T01_9000002040_13798cztM0_level2.evt | modeM0/AS1A04_199T01_9000002040_13798cztM0_level2_quad_clean.evt |
| Size (bytes) | 615,804,480 | 86,325,120 |
| Size | 587.3 MB | 82.3 MB |
| Events in quadrant A | 3,941,784 | 518,421 |
| Events in quadrant B | 4,143,334 | 527,478 |
| Events in quadrant C | 4,003,762 | 514,294 |
| Events in quadrant D | 6,009,835 | 489,598 |
| Mode M9 | |||
|---|---|---|---|
| Quadrant | BADHDUFLAG | Total packets | Discarded packets |
| A | 0 | 5 | 0 |
| B | 0 | 5 | 0 |
| C | 0 | 5 | 0 |
| D | 0 | 5 | 0 |
| Mode SS | |||
|---|---|---|---|
| Quadrant | BADHDUFLAG | Total packets | Discarded packets |
| A | 0 | 166 | 0 |
| B | 0 | 166 | 0 |
| C | 0 | 166 | 0 |
| D | 0 | 166 | 0 |
| Mode M0 | |||
|---|---|---|---|
| Quadrant | BADHDUFLAG | Total packets | Discarded packets |
| A | 0 | 17095 | 4 |
| B | 0 | 17517 | 3 |
| C | 0 | 17142 | 3 |
| D | 0 | 23225 | 3 |
| Quadrant | Total seconds | Saturated seconds | Saturation percentage |
|---|---|---|---|
| A | 8112 | 484 | 5.966469% |
| B | 8112 | 548 | 6.755424% |
| C | 8112 | 364 | 4.487179% |
| D | 8112 | 486 | 5.991124% |
Noise dominated data is calculated using 1-second bins in cleaned event files. If a bin has >2000 counts, and if more than 50% of those come from <1% of pixels, then it is considered to be noise-dominated and hence unusable.
| Quadrant | # 1 sec bins | Bins with >0 counts | Bins with >2000 counts | High rate bins dominated by noise | Noise dominated (total time) | Noise dominated (detector-on time) | Marked lightcurve |
|---|---|---|---|---|---|---|---|
| A | 8693 | 8114 | 0 | 0 | 0.00% | 0.00% | 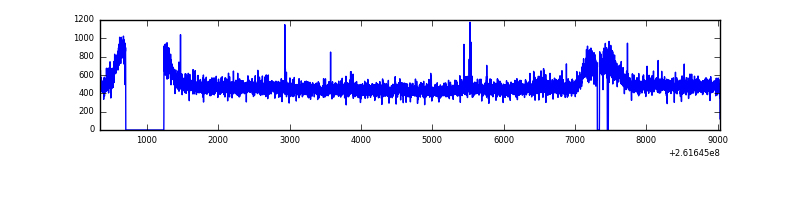 |
| B | 8693 | 8116 | 14 | 14 | 0.16% | 0.17% | 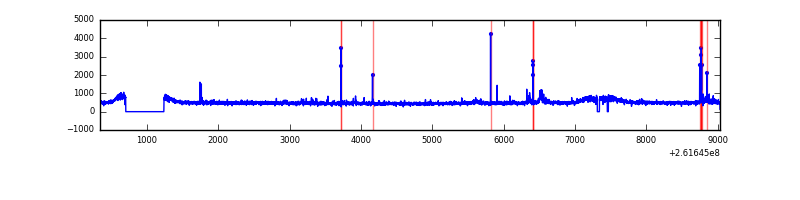 |
| C | 8693 | 8116 | 0 | 0 | 0.00% | 0.00% | 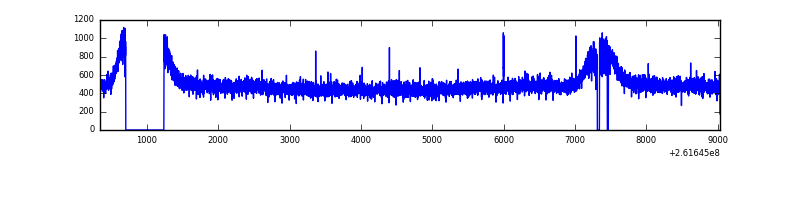 |
| D | 8693 | 8116 | 87 | 87 | 1.00% | 1.07% | 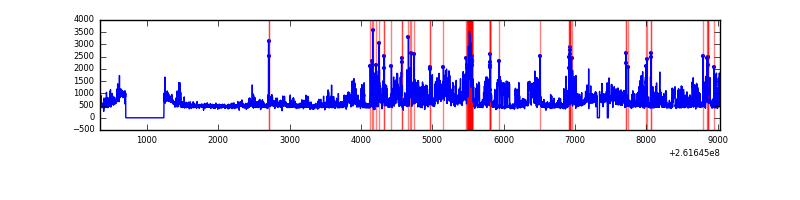 |
Top three noisy pixels from each quadrant. If the there are fewer than three noisy pixels in the level2.evt file, extra rows are filled as -1
| Pixel properties | Quadrant properties | ||||||
|---|---|---|---|---|---|---|---|
| Quadrant | DetID | PixID | Counts | Sigma | Mean | Median | Sigma |
| A | 1 | 162 | 15431 | 68.32 | 1015 | 987 | 211.4 |
| A | 8 | 15 | 13487 | 59.12 | 1015 | 987 | 211.4 |
| A | 0 | 226 | 8971 | 37.76 | 1015 | 987 | 211.4 |
| B | 4 | 80 | 55690 | 277.52 | 1014 | 985 | 197.1 |
| B | 8 | 250 | 53803 | 267.95 | 1014 | 985 | 197.1 |
| B | 0 | 219 | 47110 | 233.99 | 1014 | 985 | 197.1 |
| C | 3 | 233 | 108477 | 463.38 | 996 | 999 | 231.9 |
| C | 13 | 61 | 7234 | 26.88 | 996 | 999 | 231.9 |
| C | 14 | 234 | 5887 | 21.07 | 996 | 999 | 231.9 |
| D | 10 | 157 | 1244110 | 5139.85 | 983 | 956 | 241.9 |
| D | 1 | 52 | 885353 | 3656.56 | 983 | 956 | 241.9 |
| D | 10 | 172 | 123122 | 505.1 | 983 | 956 | 241.9 |
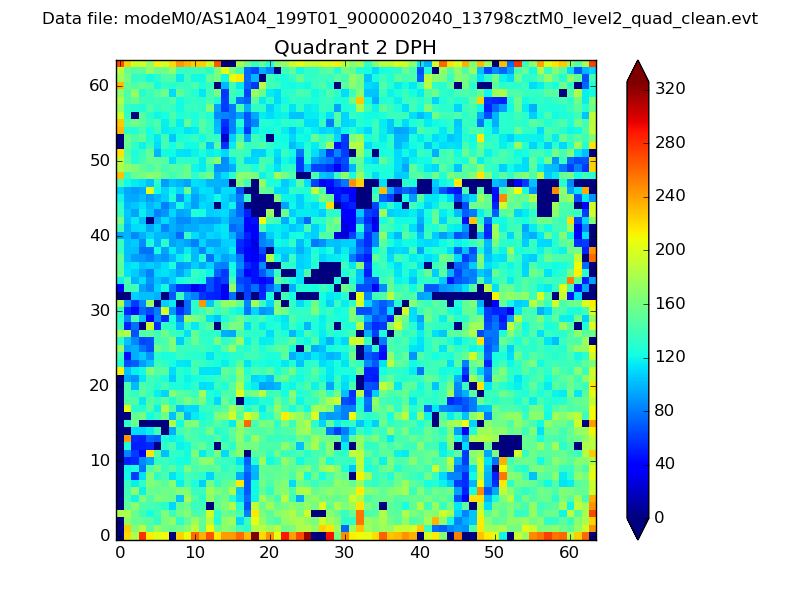
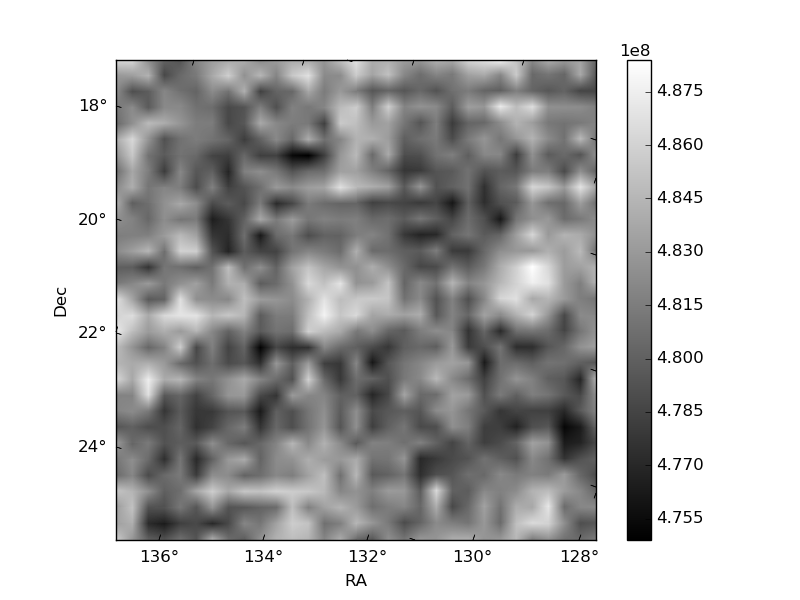
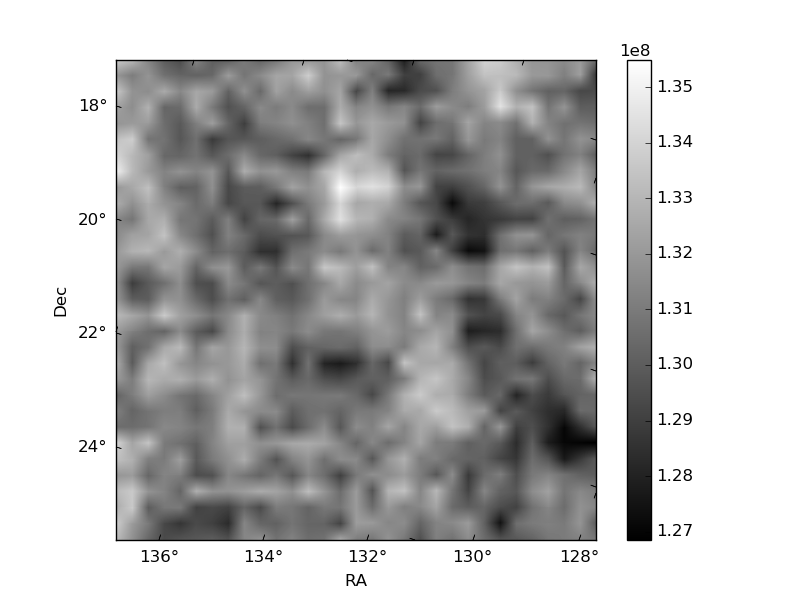
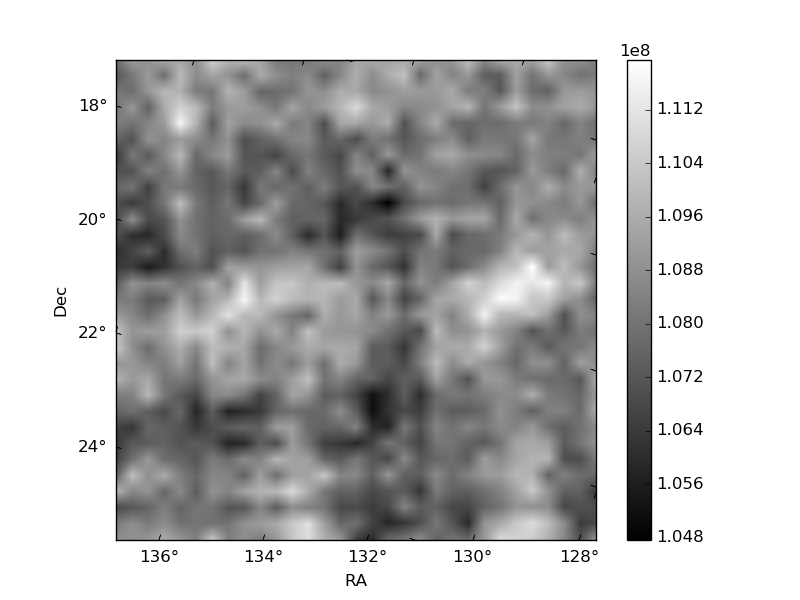
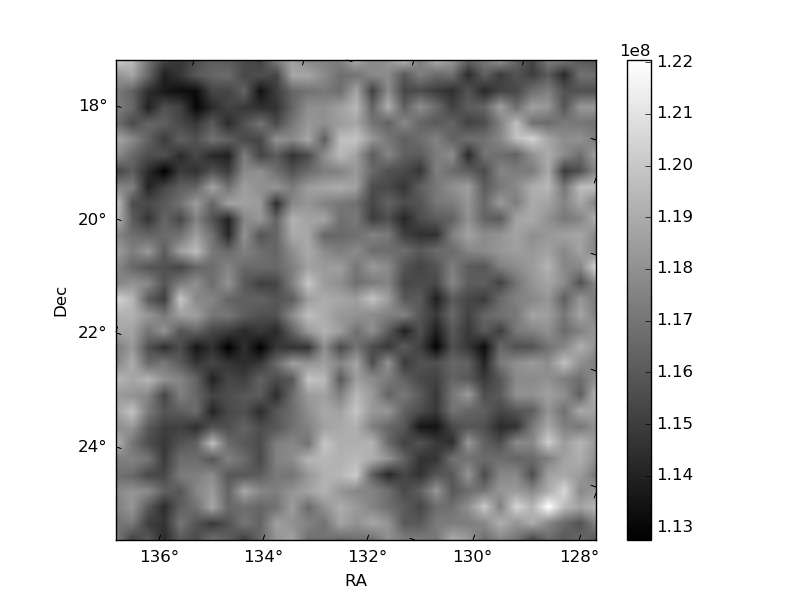
Histogram calculated using DETX and DETY for each event in the final _common_clean file
| Quadrant A | 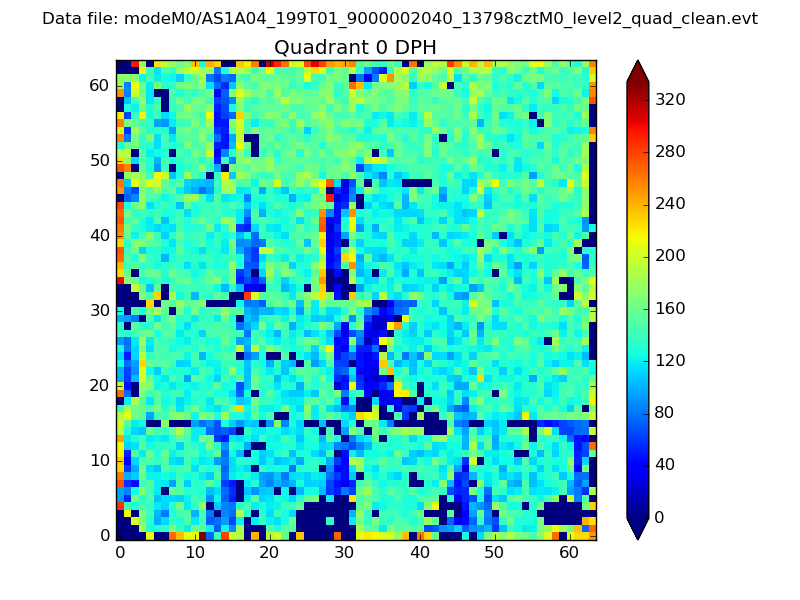 |
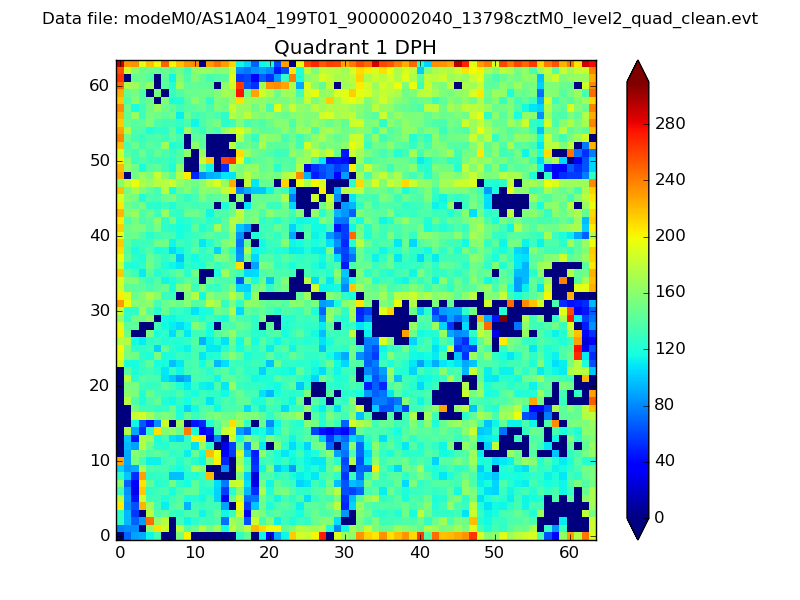 |
Quadrant B |
|---|---|---|---|
| Quadrant D | 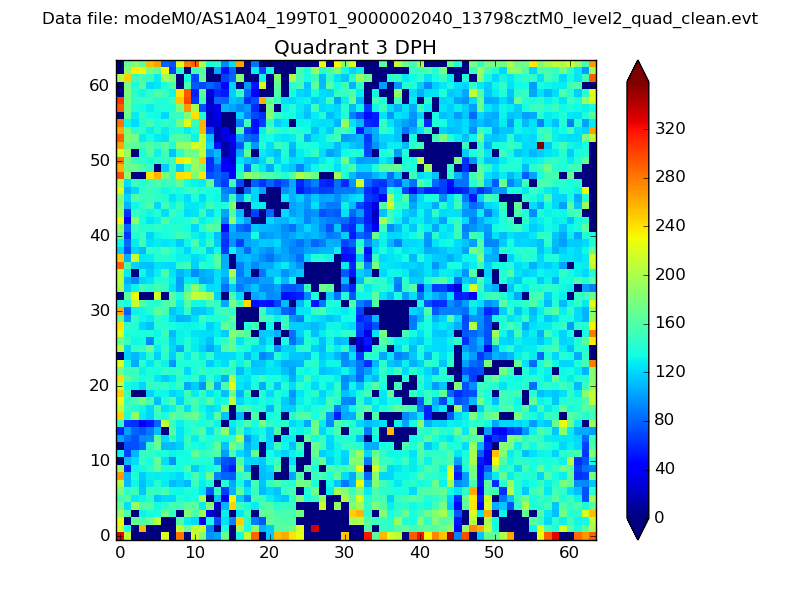 |
 |
Quadrant C |
| Plot type | Count rate plots | Images |
|---|---|---|
| Comparison with Poisson distribution Blue bars denote a histogram of data divided into 1 sec bins. Red curve is a Poisson curve with rate = median count rate of data. |
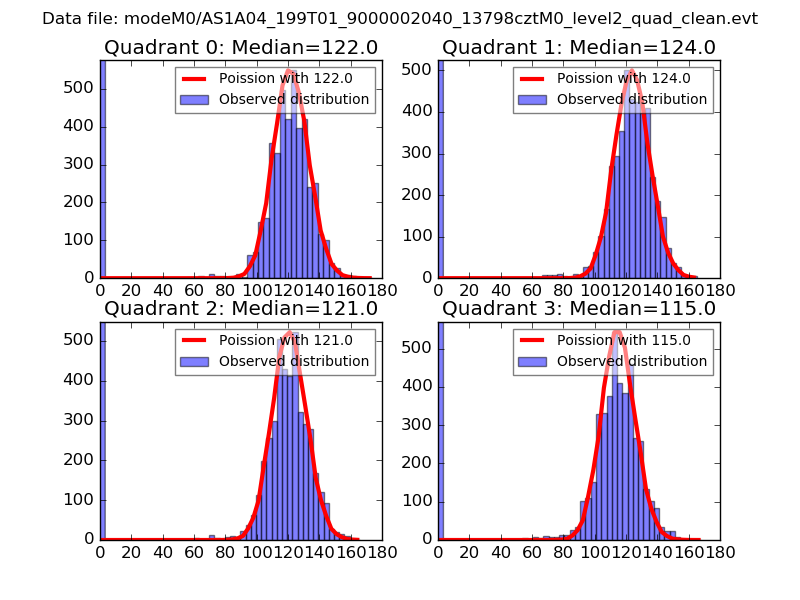 |
 |
| Quadrant-wise count rates Data is divided into 100 sec bins |
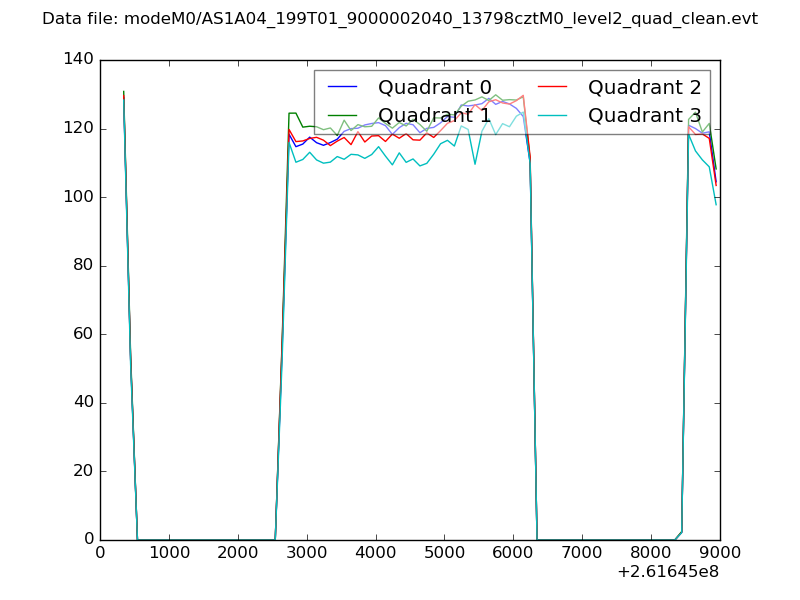 |
|
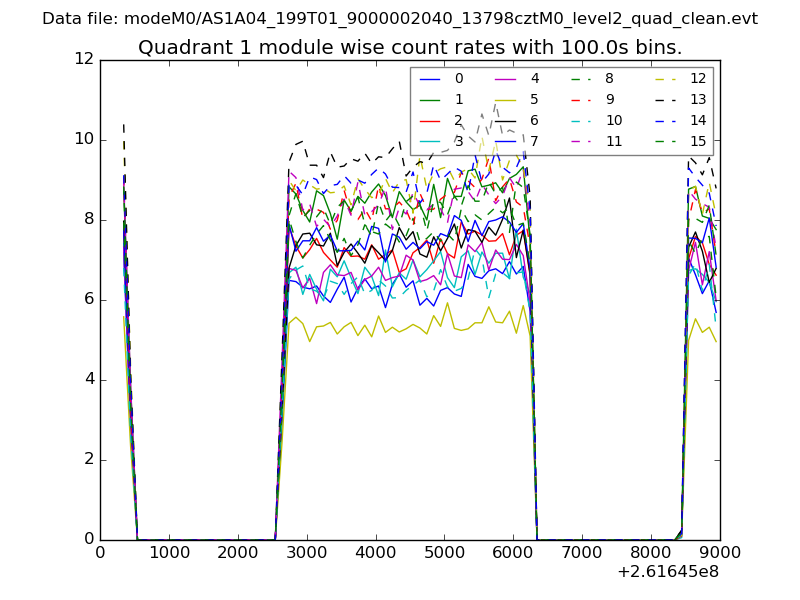
| Module-wise count rates for Quadrant A Data is divided into 100 sec bins |
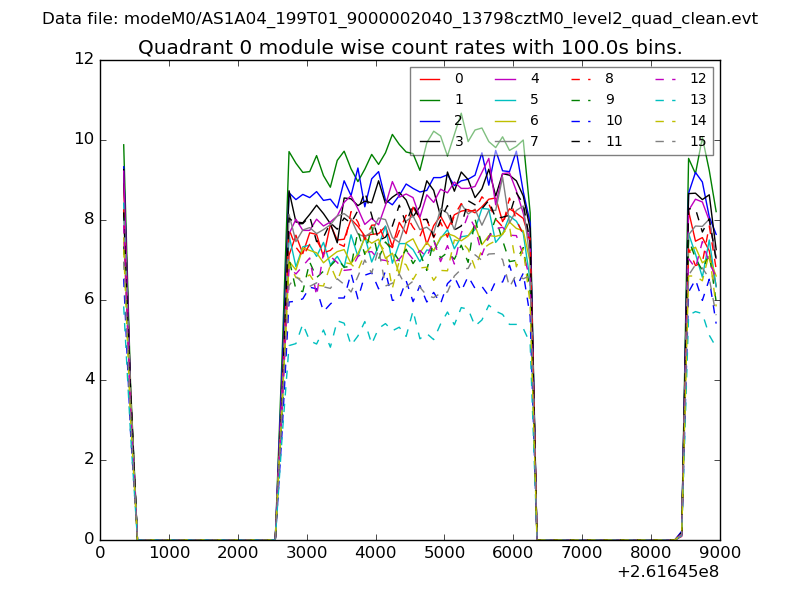 |
 |
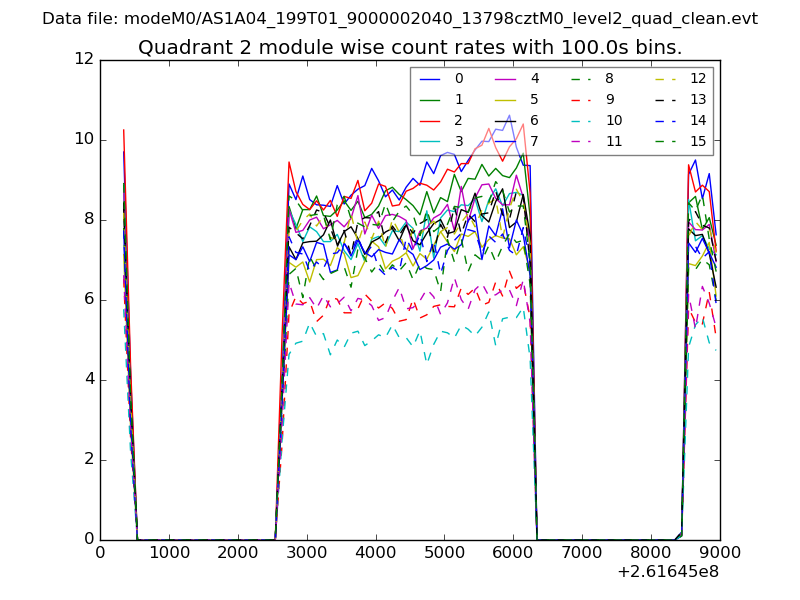
| Module-wise count rates for Quadrant B Data is divided into 100 sec bins |
 |
 |
| Module-wise count rates for Quadrant C Data is divided into 100 sec bins |
 |
 |
| Module-wise count rates for Quadrant D Data is divided into 100 sec bins |
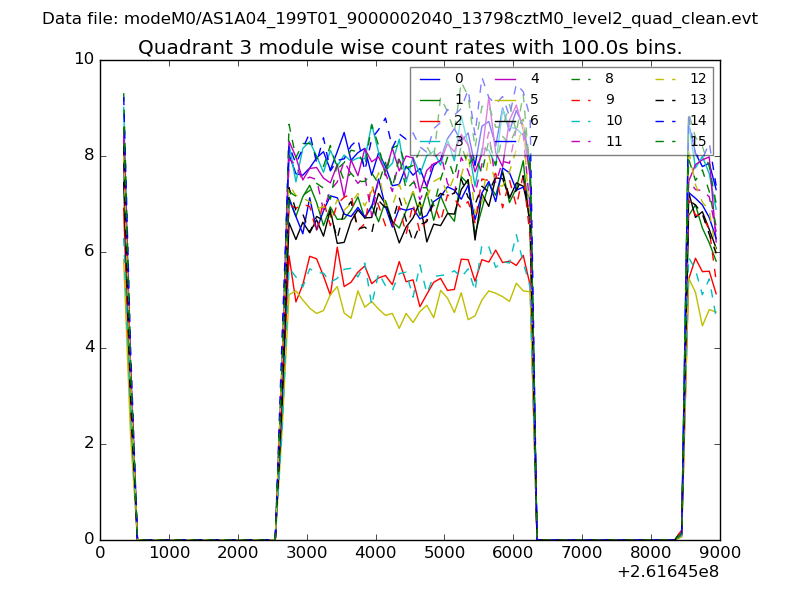 |
 |
| Parameter | Plot |
|---|---|
| CZT HV Monitor | 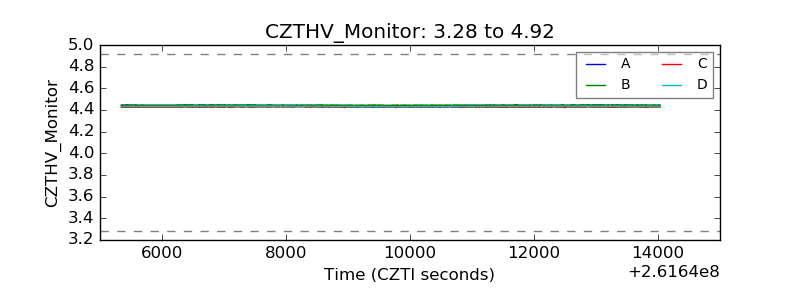 |
| D_VDD | 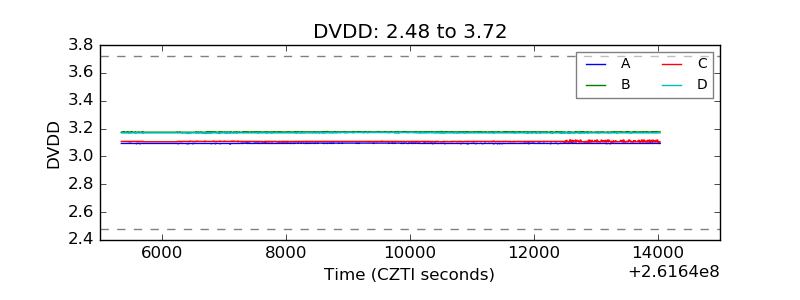 |
| Temperature 1 | 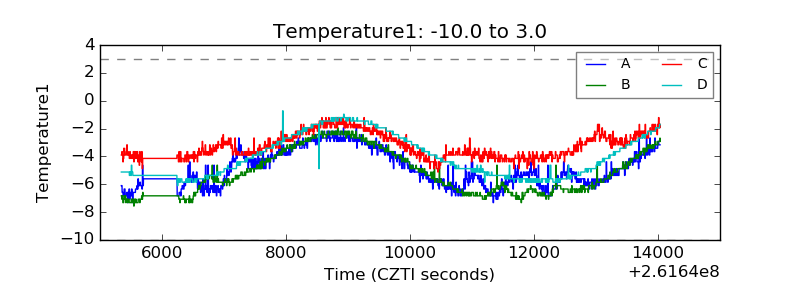 |
| Veto HV Monitor |  |
| Veto LLD | 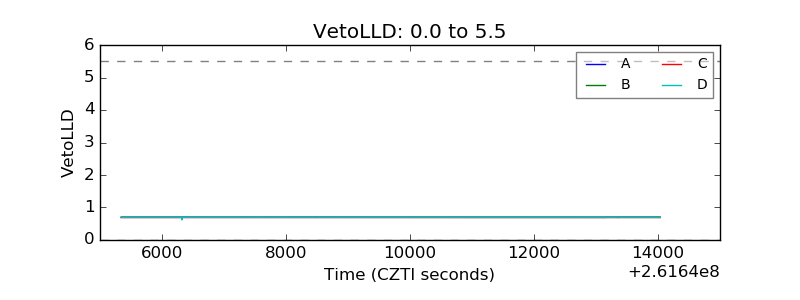 |
| Alpha Counter | 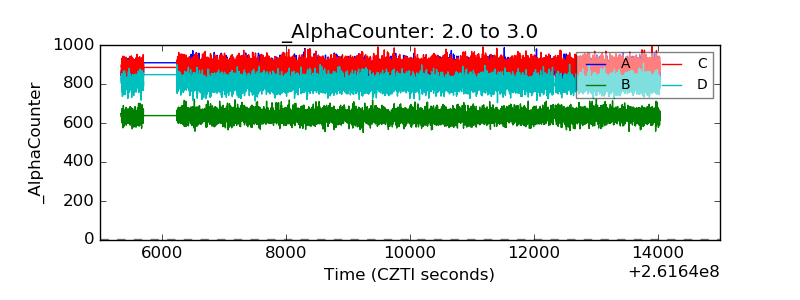 |
| _CPM_Rate | 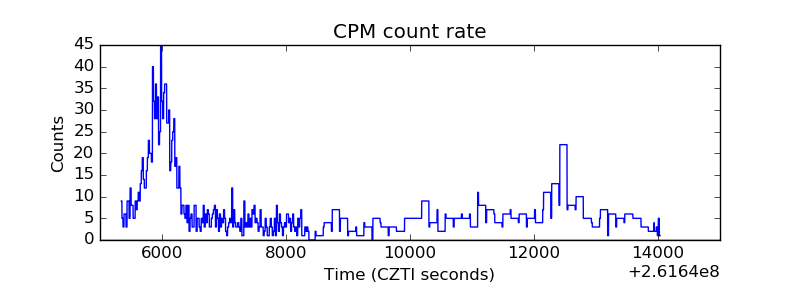 |
| CZT Counter | 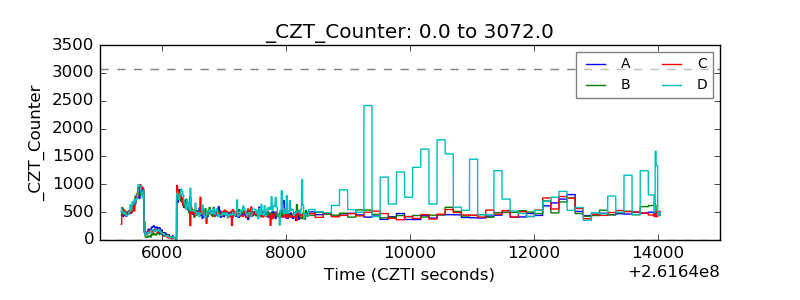 |
| +2.5 Volts monitor |  |
| +5 Volts monitor | 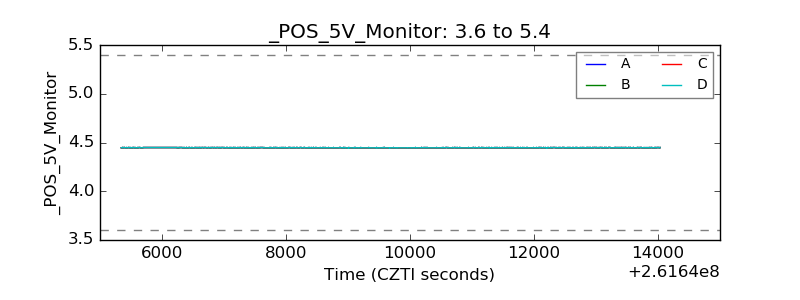 |
| _ROLL_ROT | 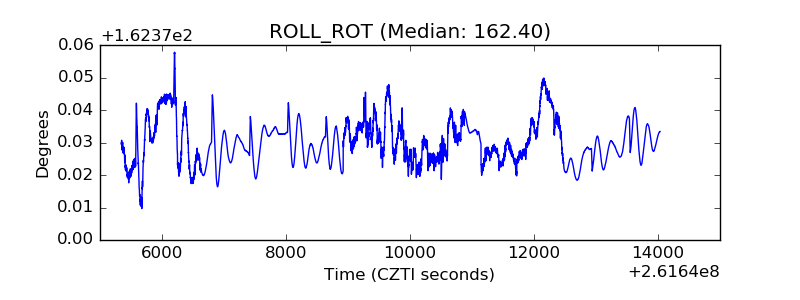 |
| _Roll_DEC | 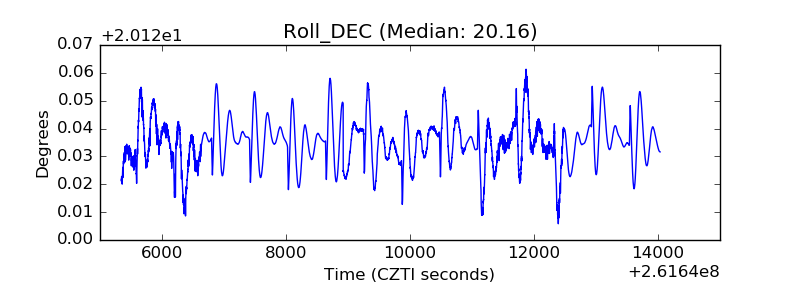 |
| _Roll_RA | 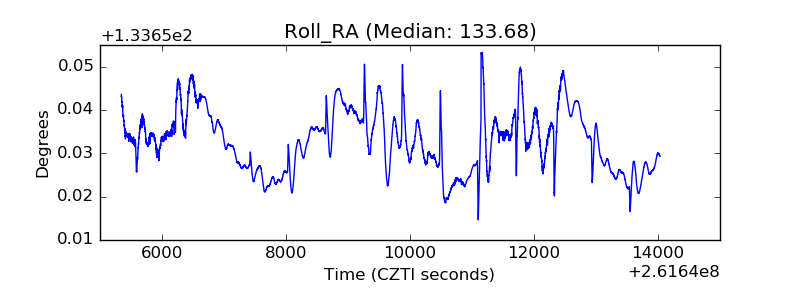 |
| Veto Counter |  |