| Param | Original file | Final file |
|---|---|---|
| Filename | modeM0/AS1A04_199T01_9000002040_13799cztM0_level2.evt | modeM0/AS1A04_199T01_9000002040_13799cztM0_level2_quad_clean.evt |
| Size (bytes) | 642,156,480 | 94,196,160 |
| Size | 612.4 MB | 89.8 MB |
| Events in quadrant A | 4,096,723 | 574,542 |
| Events in quadrant B | 4,496,165 | 581,826 |
| Events in quadrant C | 4,081,641 | 572,589 |
| Events in quadrant D | 6,206,698 | 543,287 |
| Mode M9 | |||
|---|---|---|---|
| Quadrant | BADHDUFLAG | Total packets | Discarded packets |
| A | 0 | 2 | 0 |
| B | 0 | 2 | 0 |
| C | 0 | 2 | 0 |
| D | 0 | 2 | 0 |
| Mode SS | |||
|---|---|---|---|
| Quadrant | BADHDUFLAG | Total packets | Discarded packets |
| A | 0 | 170 | 0 |
| B | 0 | 170 | 0 |
| C | 0 | 170 | 0 |
| D | 0 | 170 | 0 |
| Mode M0 | |||
|---|---|---|---|
| Quadrant | BADHDUFLAG | Total packets | Discarded packets |
| A | 0 | 17671 | 5 |
| B | 0 | 18650 | 4 |
| C | 0 | 17584 | 4 |
| D | 0 | 24030 | 4 |
| Quadrant | Total seconds | Saturated seconds | Saturation percentage |
|---|---|---|---|
| A | 8350 | 493 | 5.904192% |
| B | 8350 | 562 | 6.730539% |
| C | 8350 | 351 | 4.203593% |
| D | 8350 | 567 | 6.790419% |
Noise dominated data is calculated using 1-second bins in cleaned event files. If a bin has >2000 counts, and if more than 50% of those come from <1% of pixels, then it is considered to be noise-dominated and hence unusable.
| Quadrant | # 1 sec bins | Bins with >0 counts | Bins with >2000 counts | High rate bins dominated by noise | Noise dominated (total time) | Noise dominated (detector-on time) | Marked lightcurve |
|---|---|---|---|---|---|---|---|
| A | 8611 | 8354 | 6 | 6 | 0.07% | 0.07% |  |
| B | 8611 | 8355 | 40 | 40 | 0.46% | 0.48% | 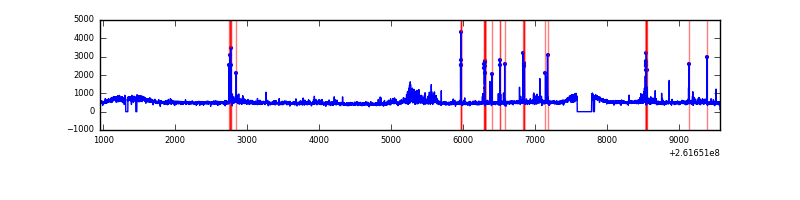 |
| C | 8611 | 8355 | 0 | 0 | 0.00% | 0.00% | 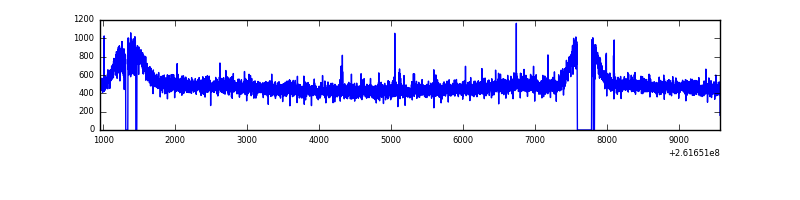 |
| D | 8611 | 8354 | 108 | 108 | 1.25% | 1.29% |  |
Top three noisy pixels from each quadrant. If the there are fewer than three noisy pixels in the level2.evt file, extra rows are filled as -1
| Pixel properties | Quadrant properties | ||||||
|---|---|---|---|---|---|---|---|
| Quadrant | DetID | PixID | Counts | Sigma | Mean | Median | Sigma |
| A | 8 | 15 | 54383 | 247.27 | 1038 | 1010 | 215.8 |
| A | 9 | 143 | 31402 | 140.8 | 1038 | 1010 | 215.8 |
| A | 1 | 162 | 16362 | 71.12 | 1038 | 1010 | 215.8 |
| B | 0 | 219 | 193218 | 960.46 | 1032 | 1003 | 200.1 |
| B | 4 | 80 | 121974 | 604.47 | 1032 | 1003 | 200.1 |
| B | 8 | 250 | 57567 | 282.64 | 1032 | 1003 | 200.1 |
| C | 3 | 233 | 72507 | 302.15 | 1018 | 1020 | 236.6 |
| C | 0 | 207 | 19018 | 76.07 | 1018 | 1020 | 236.6 |
| C | 8 | 128 | 12441 | 48.27 | 1018 | 1020 | 236.6 |
| D | 10 | 157 | 1330502 | 5531.42 | 1006 | 981 | 240.4 |
| D | 1 | 52 | 646817 | 2686.98 | 1006 | 981 | 240.4 |
| D | 5 | 222 | 218755 | 906.04 | 1006 | 981 | 240.4 |
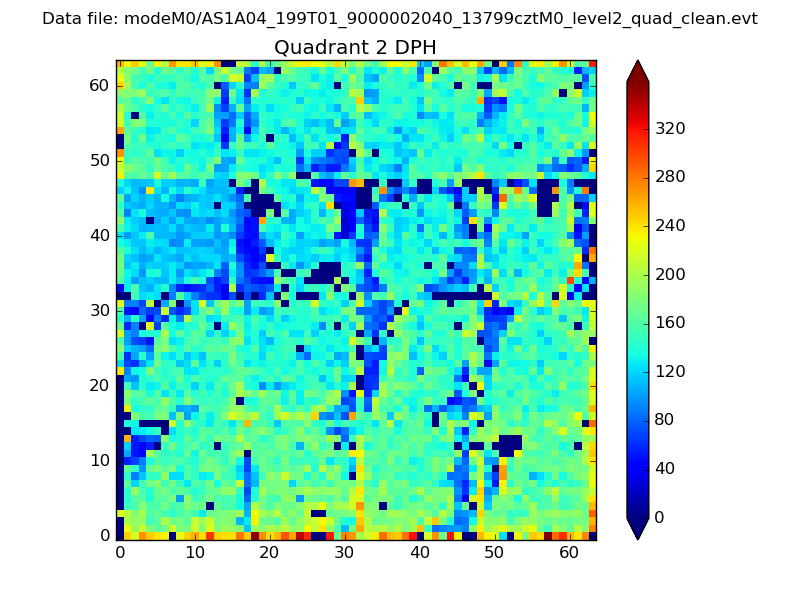
Histogram calculated using DETX and DETY for each event in the final _common_clean file
| Quadrant A | 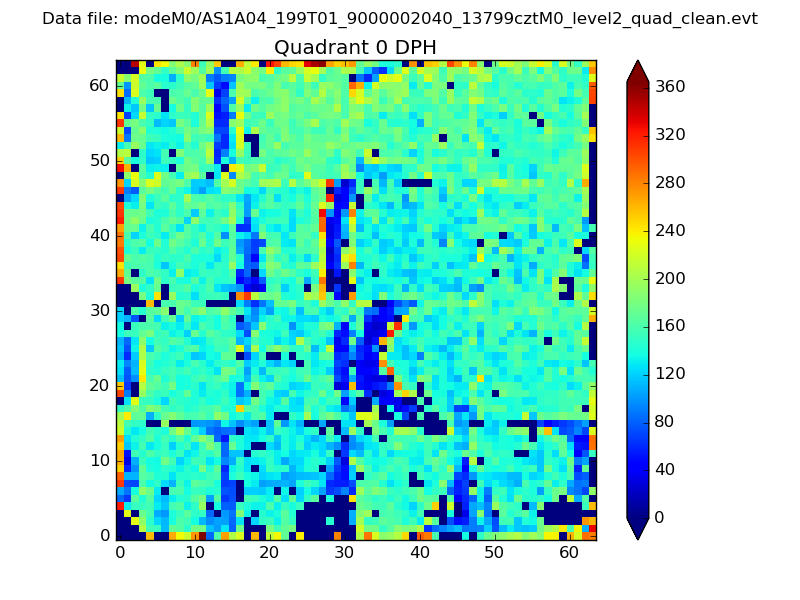 |
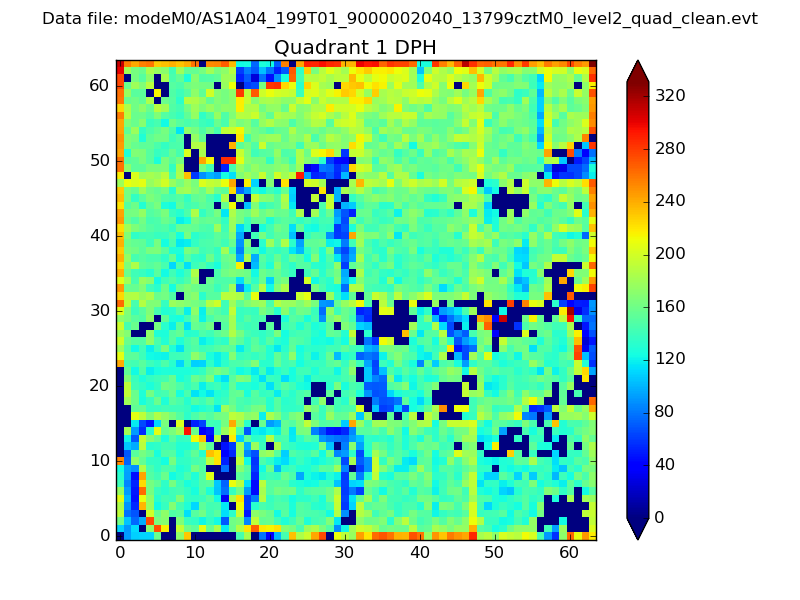 |
Quadrant B |
|---|---|---|---|
| Quadrant D | 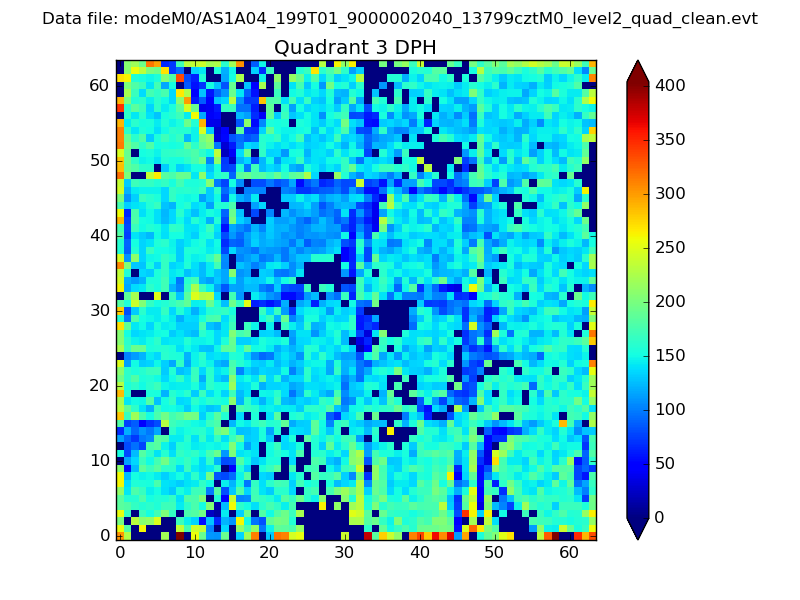 |
 |
Quadrant C |
| Plot type | Count rate plots | Images |
|---|---|---|
| Comparison with Poisson distribution Blue bars denote a histogram of data divided into 1 sec bins. Red curve is a Poisson curve with rate = median count rate of data. |
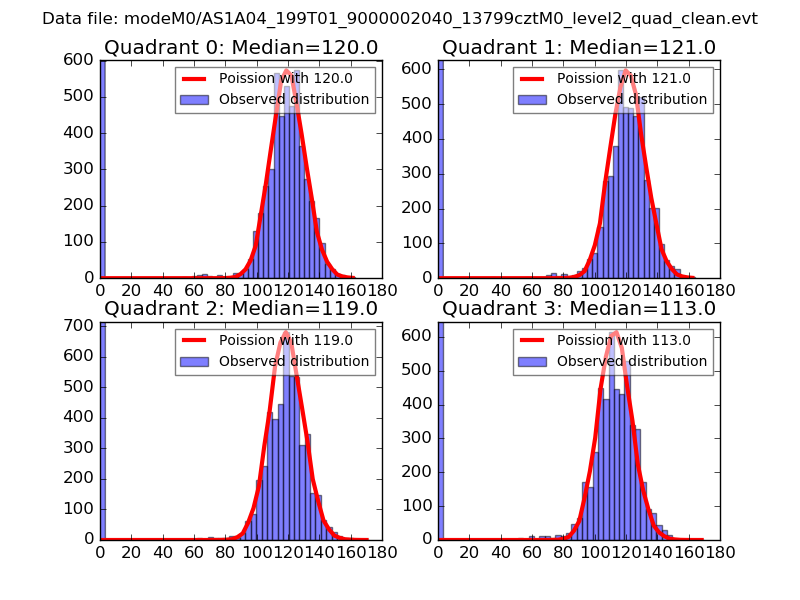 |
 |
| Quadrant-wise count rates Data is divided into 100 sec bins |
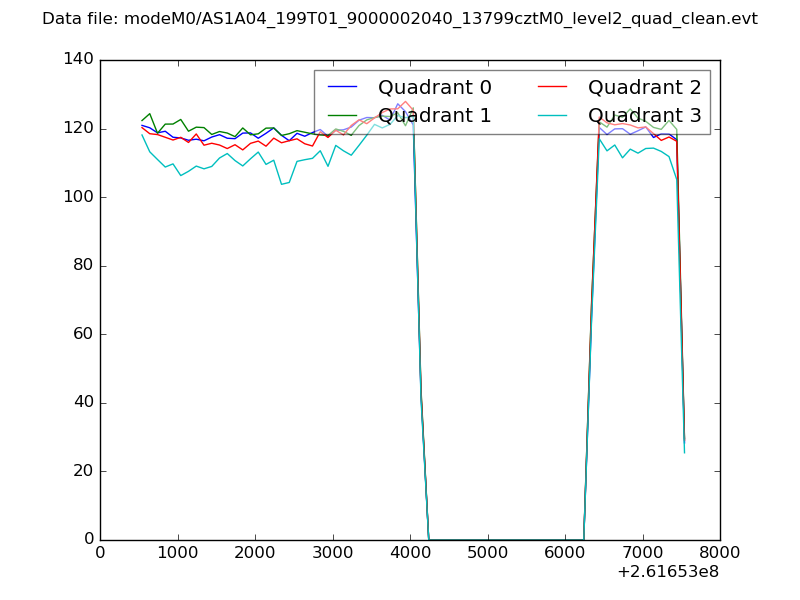 |
|
| Module-wise count rates for Quadrant A Data is divided into 100 sec bins |
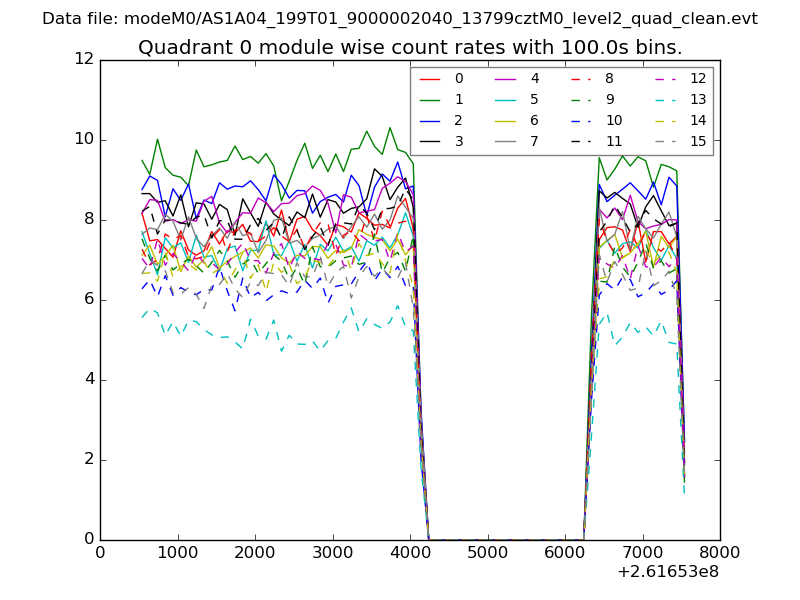 |
 |
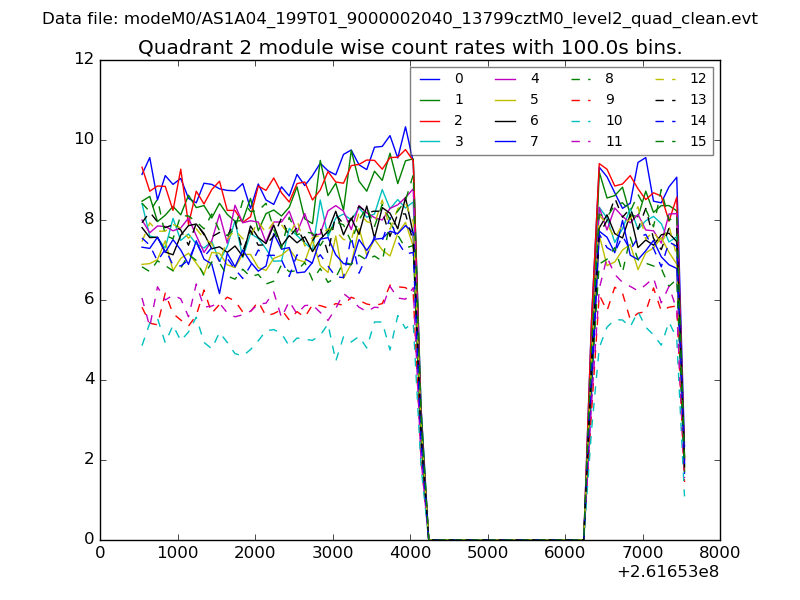
| Module-wise count rates for Quadrant B Data is divided into 100 sec bins |
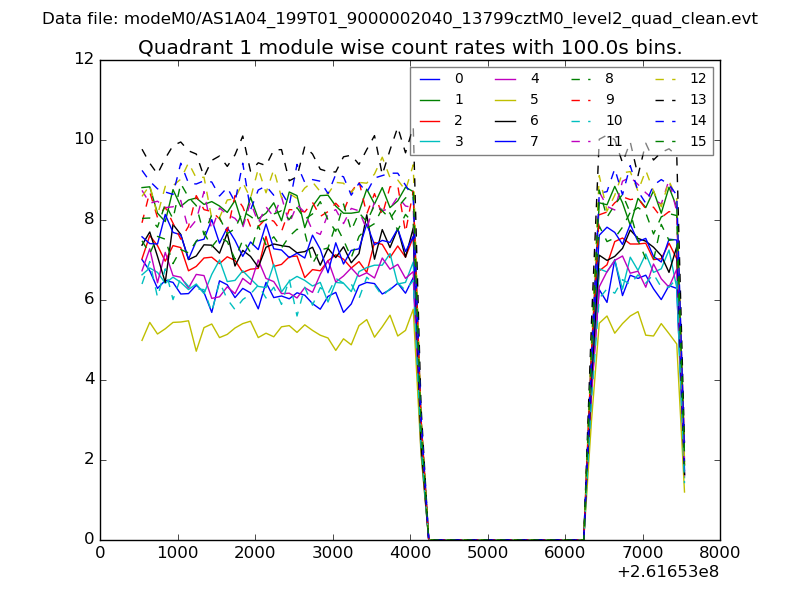 |
 |
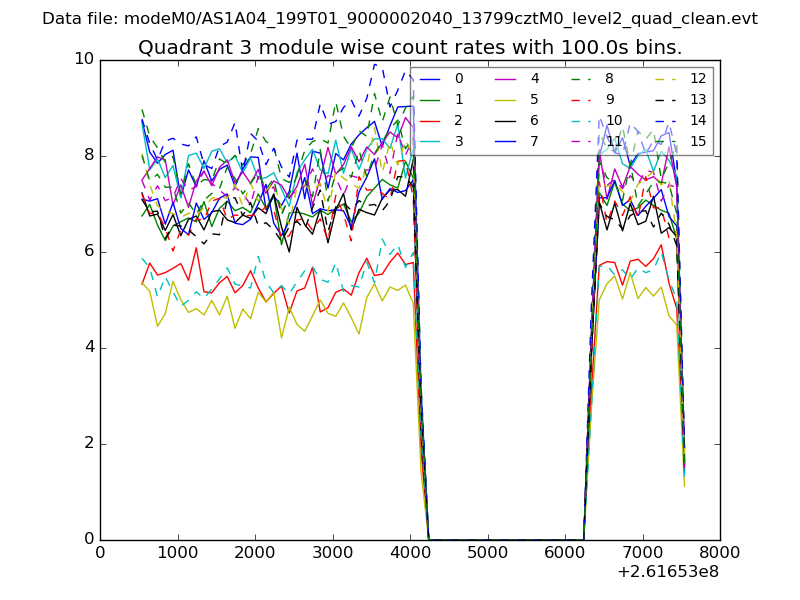
| Module-wise count rates for Quadrant C Data is divided into 100 sec bins |
 |
 |
| Module-wise count rates for Quadrant D Data is divided into 100 sec bins |
 |
 |
| Parameter | Plot |
|---|---|
| CZT HV Monitor | 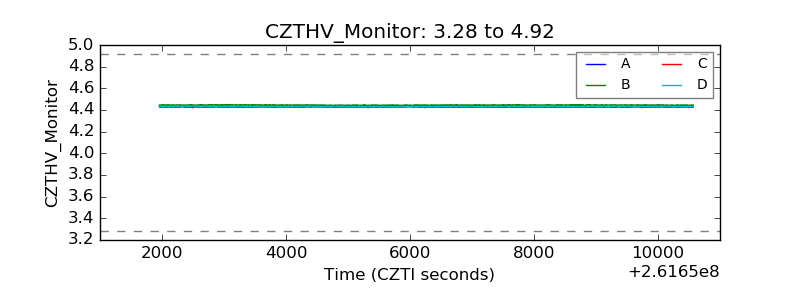 |
| D_VDD |  |
| Temperature 1 | 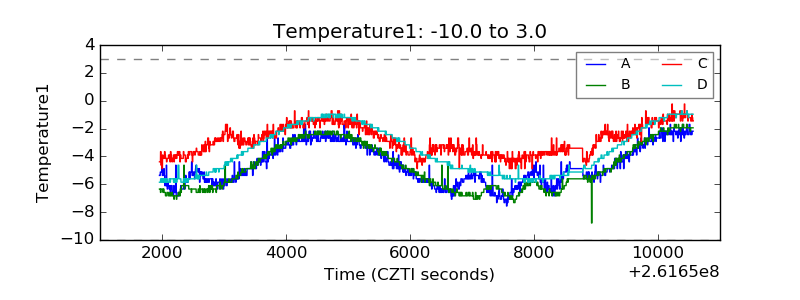 |
| Veto HV Monitor |  |
| Veto LLD | 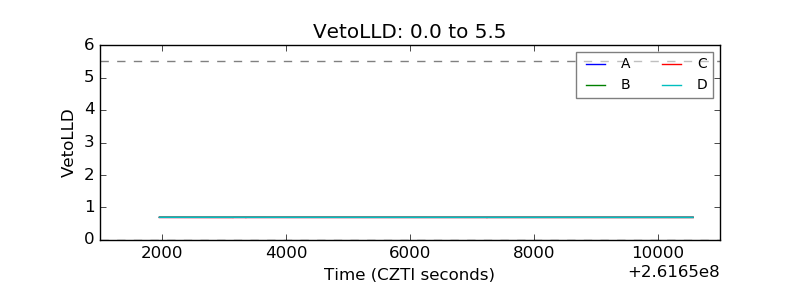 |
| Alpha Counter | 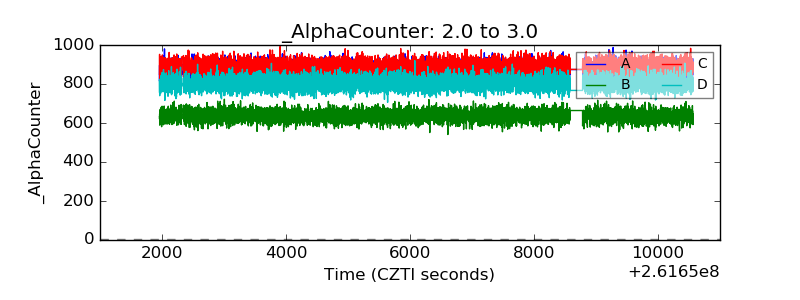 |
| _CPM_Rate | 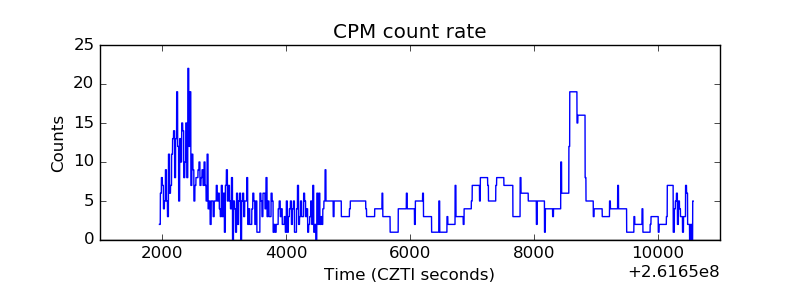 |
| CZT Counter | 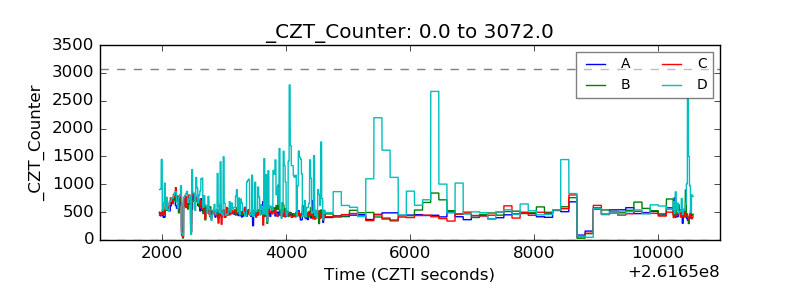 |
| +2.5 Volts monitor |  |
| +5 Volts monitor |  |
| _ROLL_ROT | 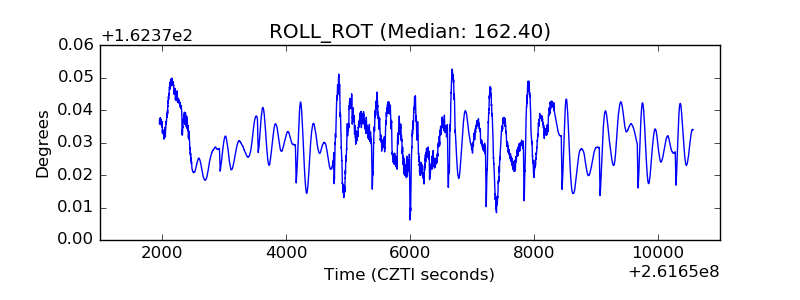 |
| _Roll_DEC | 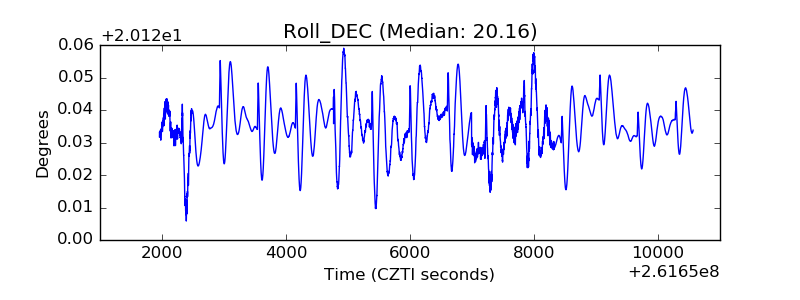 |
| _Roll_RA |  |
| Veto Counter | 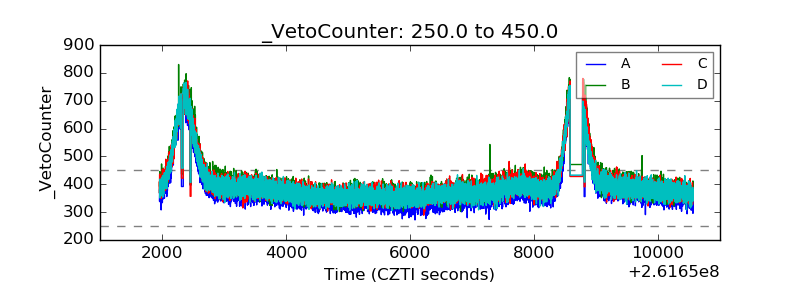 |