| Param | Original file | Final file |
|---|---|---|
| Filename | modeM0/AS1A04_199T01_9000002040_13802cztM0_level2.evt | modeM0/AS1A04_199T01_9000002040_13802cztM0_level2_quad_clean.evt |
| Size (bytes) | 1,350,864,000 | 225,881,280 |
| Size | 1.3 GB | 215.4 MB |
| Events in quadrant A | 8,522,352 | 1,428,091 |
| Events in quadrant B | 8,757,953 | 1,440,313 |
| Events in quadrant C | 8,252,309 | 1,421,130 |
| Events in quadrant D | 14,170,646 | 1,318,871 |
| Mode M9 | |||
|---|---|---|---|
| Quadrant | BADHDUFLAG | Total packets | Discarded packets |
| A | 0 | 18 | 0 |
| B | 0 | 18 | 0 |
| C | 0 | 18 | 0 |
| D | 0 | 18 | 0 |
| Mode SS | |||
|---|---|---|---|
| Quadrant | BADHDUFLAG | Total packets | Discarded packets |
| A | 0 | 364 | 0 |
| B | 0 | 364 | 0 |
| C | 0 | 364 | 0 |
| D | 0 | 364 | 0 |
| Mode M0 | |||
|---|---|---|---|
| Quadrant | BADHDUFLAG | Total packets | Discarded packets |
| A | 0 | 37325 | 4 |
| B | 0 | 37674 | 3 |
| C | 0 | 36573 | 3 |
| D | 0 | 53874 | 3 |
| Quadrant | Total seconds | Saturated seconds | Saturation percentage |
|---|---|---|---|
| A | 17881 | 227 | 1.269504% |
| B | 17881 | 224 | 1.252726% |
| C | 17881 | 116 | 0.648733% |
| D | 17881 | 1190 | 6.655109% |
Noise dominated data is calculated using 1-second bins in cleaned event files. If a bin has >2000 counts, and if more than 50% of those come from <1% of pixels, then it is considered to be noise-dominated and hence unusable.
| Quadrant | # 1 sec bins | Bins with >0 counts | Bins with >2000 counts | High rate bins dominated by noise | Noise dominated (total time) | Noise dominated (detector-on time) | Marked lightcurve |
|---|---|---|---|---|---|---|---|
| A | 19657 | 17883 | 37 | 37 | 0.19% | 0.21% | 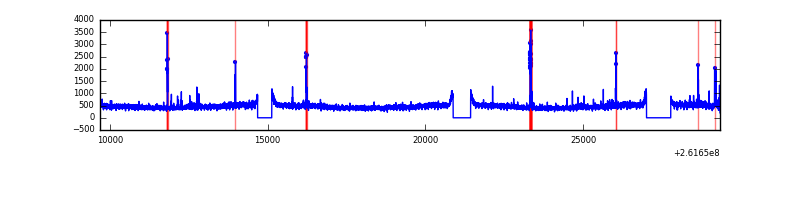 |
| B | 19657 | 17883 | 23 | 23 | 0.12% | 0.13% | 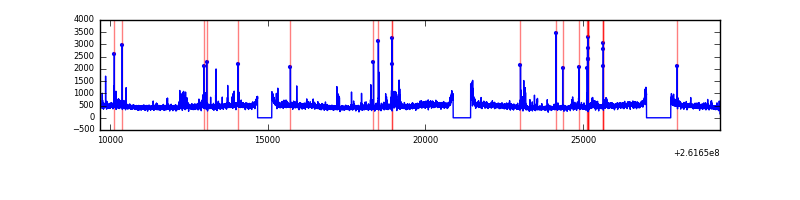 |
| C | 19657 | 17884 | 1 | 1 | 0.01% | 0.01% |  |
| D | 19657 | 17883 | 936 | 936 | 4.76% | 5.23% | 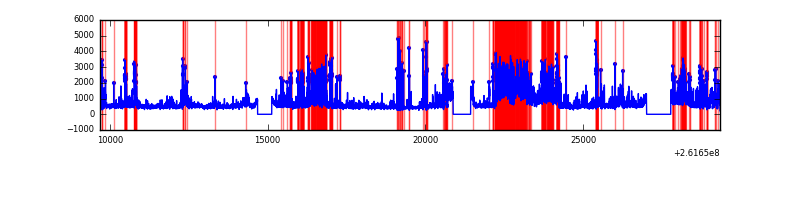 |
Top three noisy pixels from each quadrant. If the there are fewer than three noisy pixels in the level2.evt file, extra rows are filled as -1
| Pixel properties | Quadrant properties | ||||||
|---|---|---|---|---|---|---|---|
| Quadrant | DetID | PixID | Counts | Sigma | Mean | Median | Sigma |
| A | 9 | 143 | 124622 | 282.61 | 2117 | 2067 | 433.7 |
| A | 0 | 23 | 111496 | 252.34 | 2117 | 2067 | 433.7 |
| A | 8 | 15 | 75520 | 169.38 | 2117 | 2067 | 433.7 |
| B | 8 | 250 | 159963 | 390.27 | 2113 | 2055 | 404.6 |
| B | 0 | 219 | 98426 | 238.18 | 2113 | 2055 | 404.6 |
| B | 4 | 80 | 74363 | 178.71 | 2113 | 2055 | 404.6 |
| C | 3 | 233 | 187171 | 385.3 | 2065 | 2074 | 480.4 |
| C | 13 | 61 | 14936 | 26.77 | 2065 | 2074 | 480.4 |
| C | 14 | 234 | 10629 | 17.81 | 2065 | 2074 | 480.4 |
| D | 1 | 52 | 4683713 | 9036.29 | 2004 | 1962 | 518.1 |
| D | 5 | 222 | 956681 | 1842.71 | 2004 | 1962 | 518.1 |
| D | 10 | 157 | 520415 | 1000.67 | 2004 | 1962 | 518.1 |
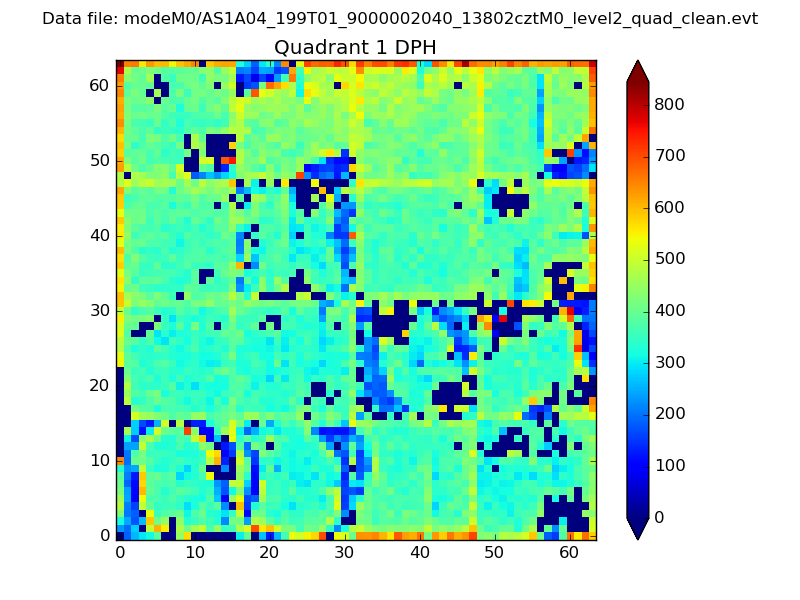
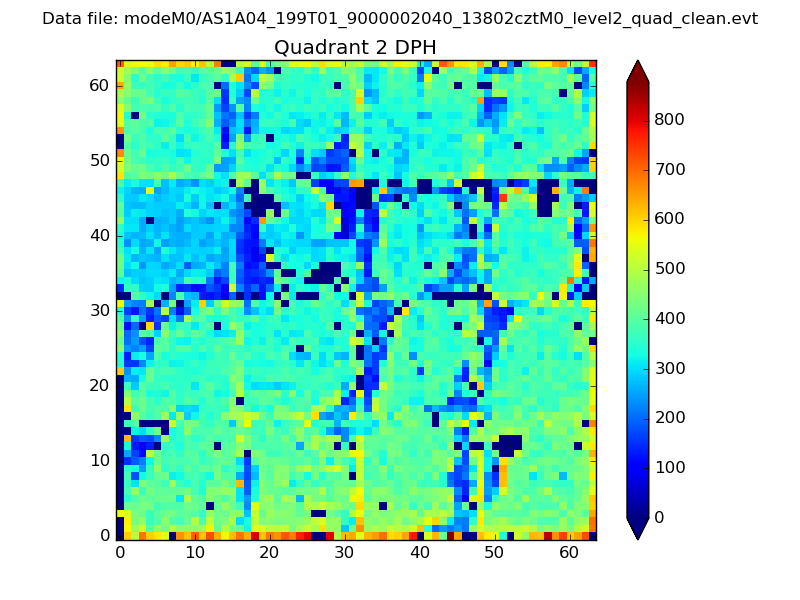
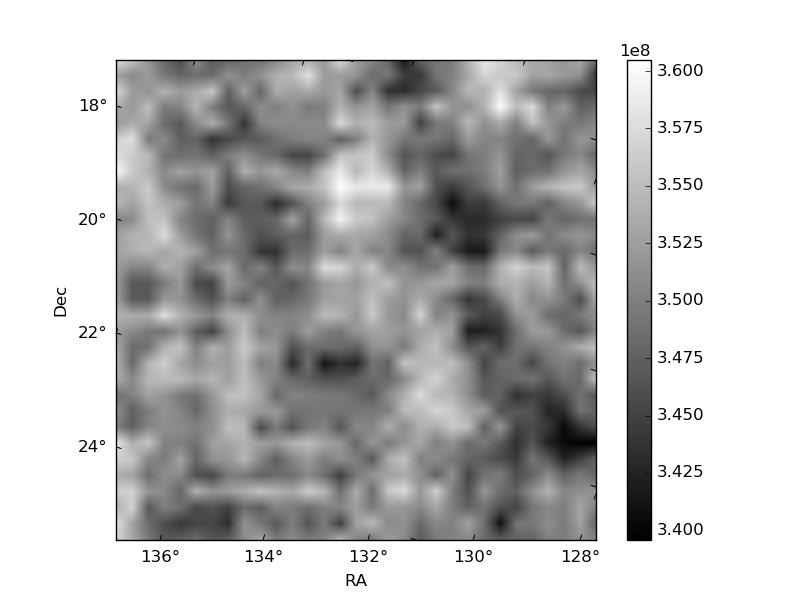
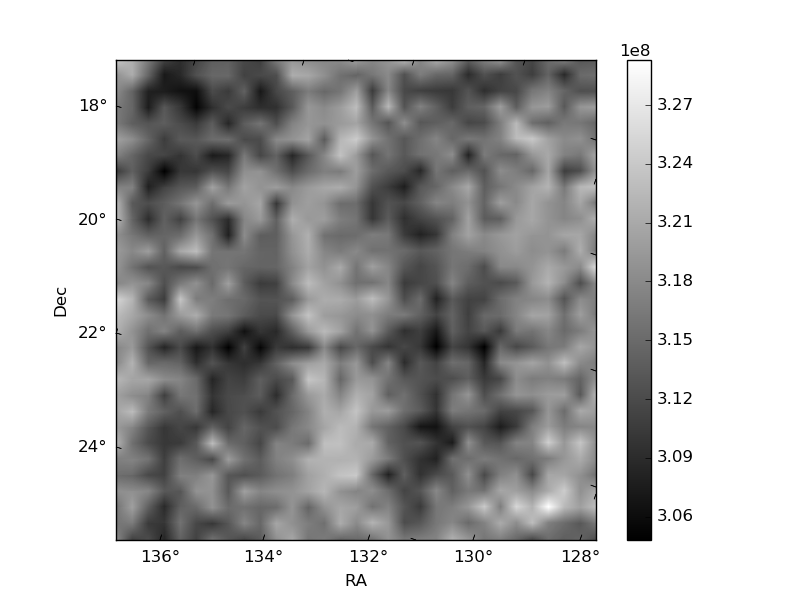
Histogram calculated using DETX and DETY for each event in the final _common_clean file
| Quadrant A | 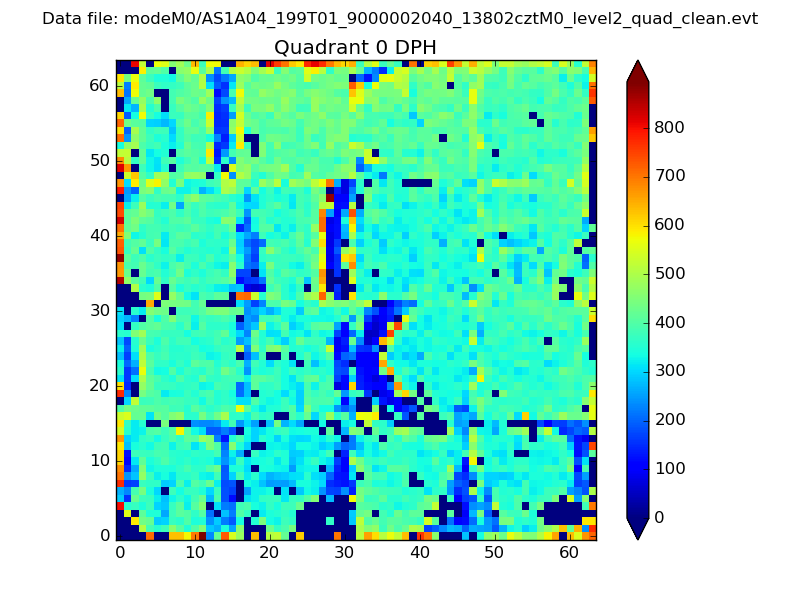 |
 |
Quadrant B |
|---|---|---|---|
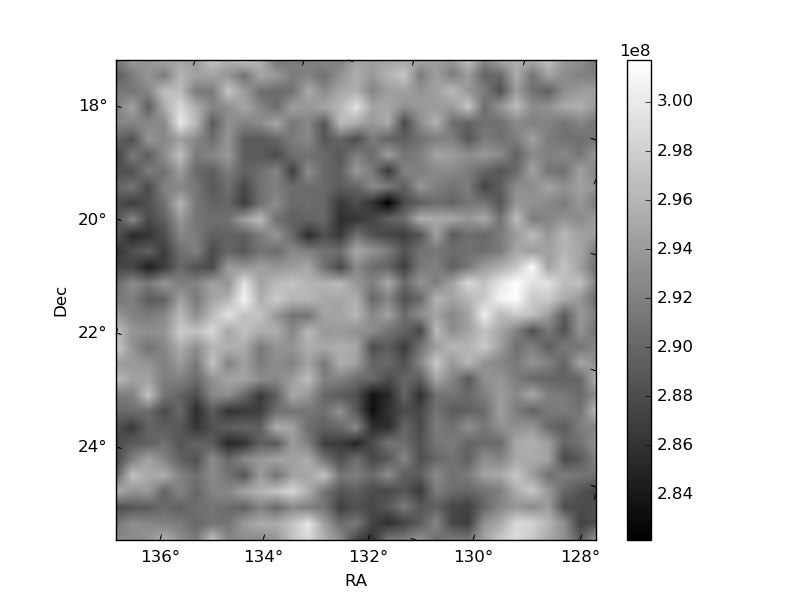
| Quadrant D | 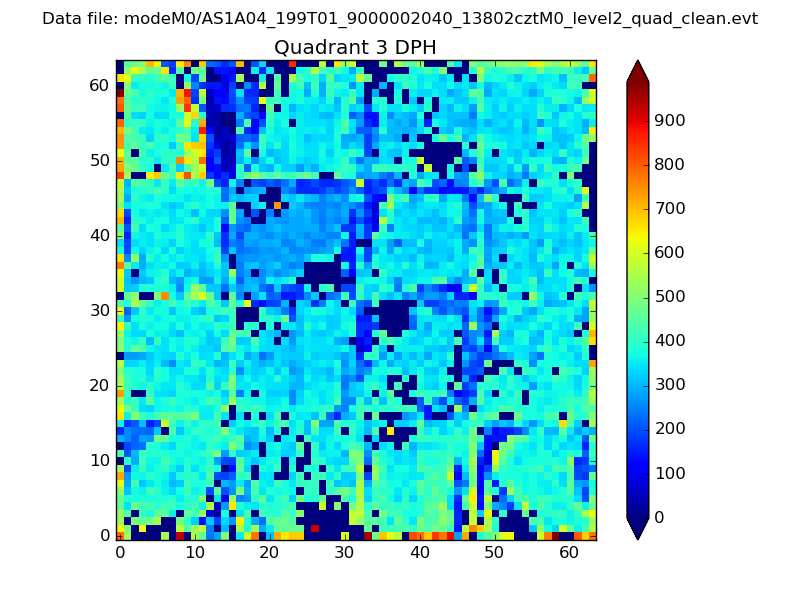 |
 |
Quadrant C |
| Plot type | Count rate plots | Images |
|---|---|---|
| Comparison with Poisson distribution Blue bars denote a histogram of data divided into 1 sec bins. Red curve is a Poisson curve with rate = median count rate of data. |
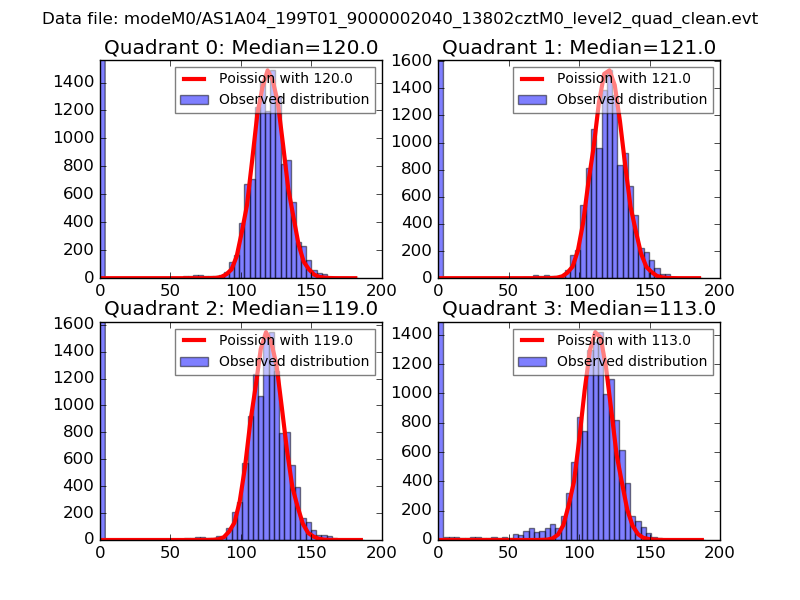 |
 |
| Quadrant-wise count rates Data is divided into 100 sec bins |
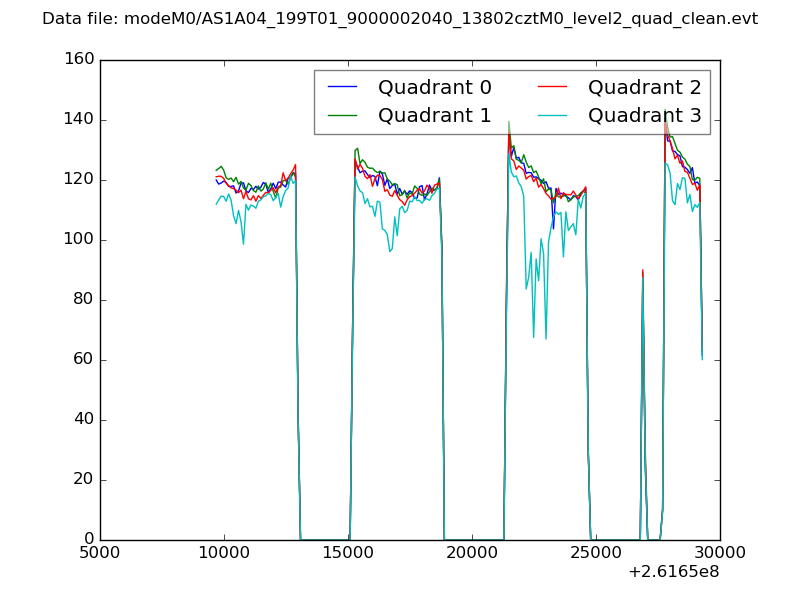 |
|
| Module-wise count rates for Quadrant A Data is divided into 100 sec bins |
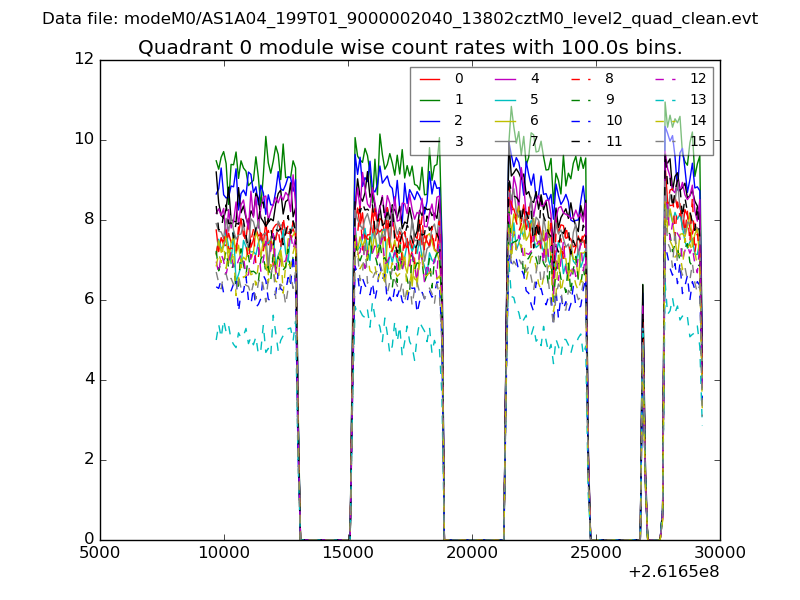 |
 |
| Module-wise count rates for Quadrant B Data is divided into 100 sec bins |
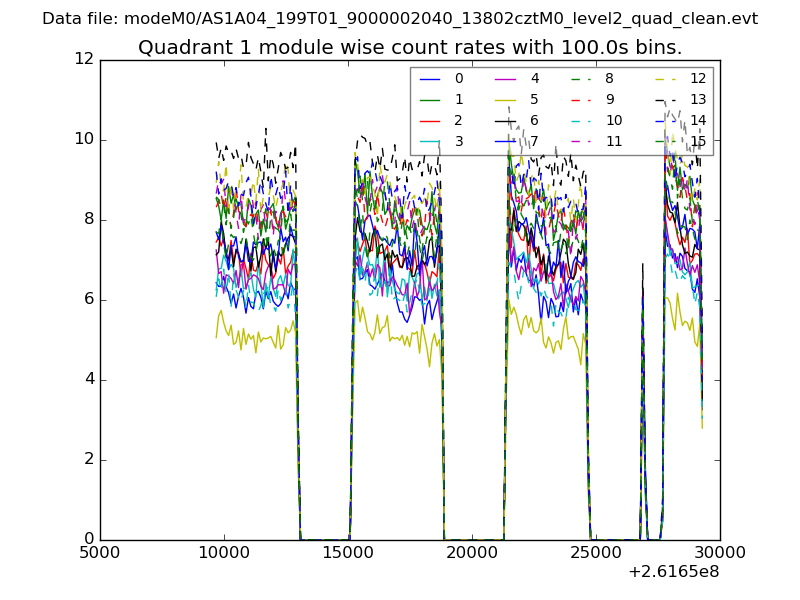 |
 |
| Module-wise count rates for Quadrant C Data is divided into 100 sec bins |
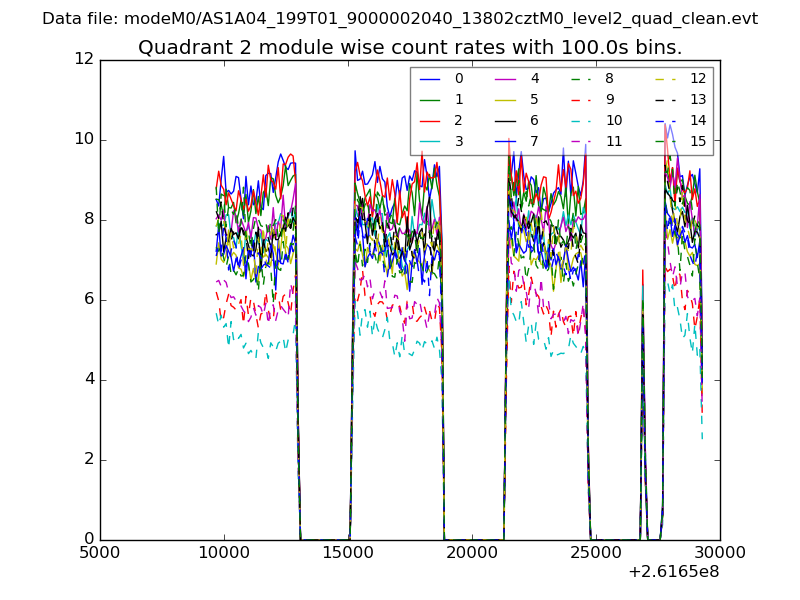 |
 |
| Module-wise count rates for Quadrant D Data is divided into 100 sec bins |
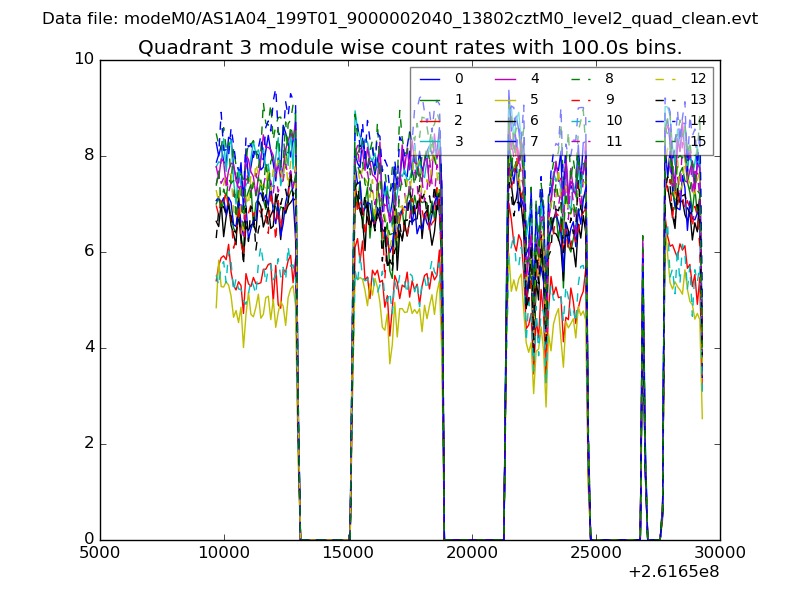 |
 |
| Parameter | Plot |
|---|---|
| CZT HV Monitor | 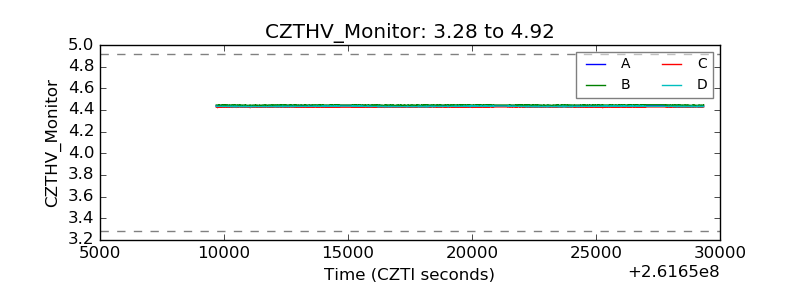 |
| D_VDD | 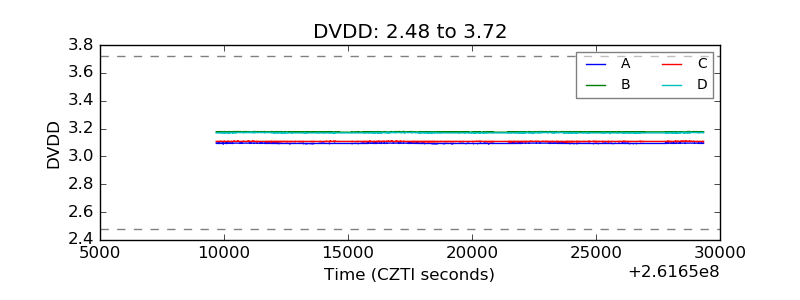 |
| Temperature 1 | 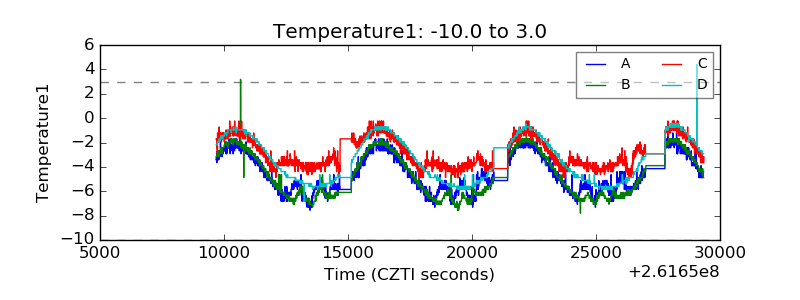 |
| Veto HV Monitor | 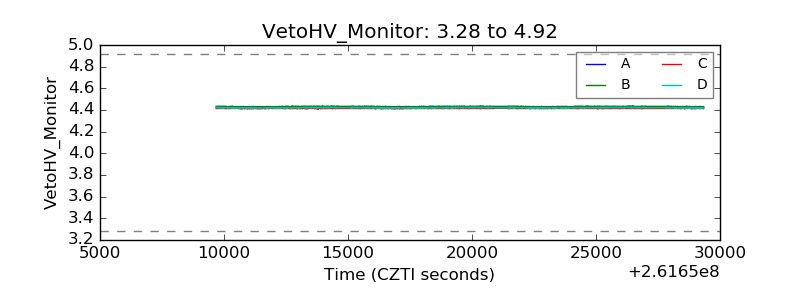 |
| Veto LLD | 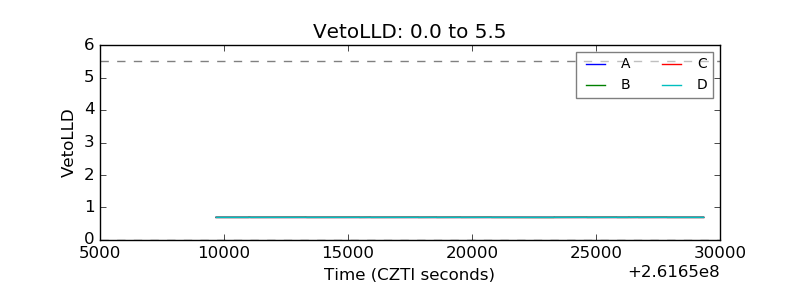 |
| Alpha Counter | 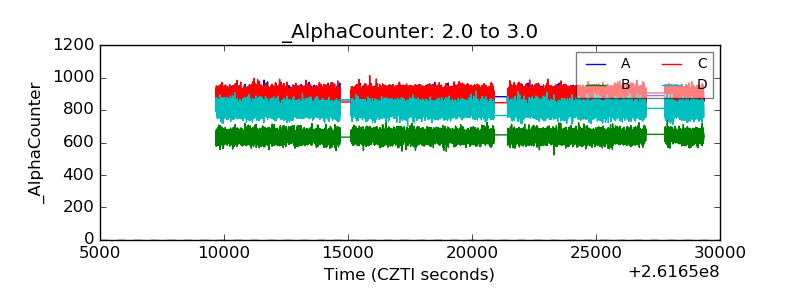 |
| _CPM_Rate | 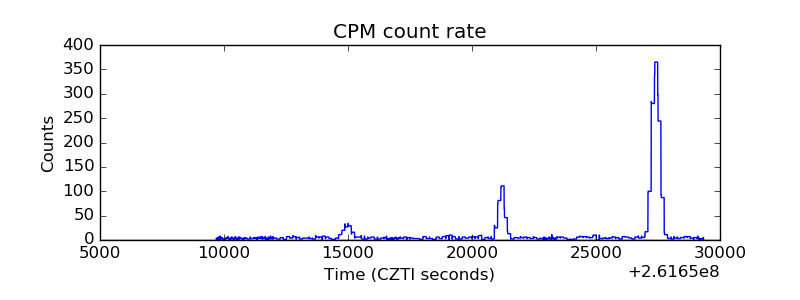 |
| CZT Counter | 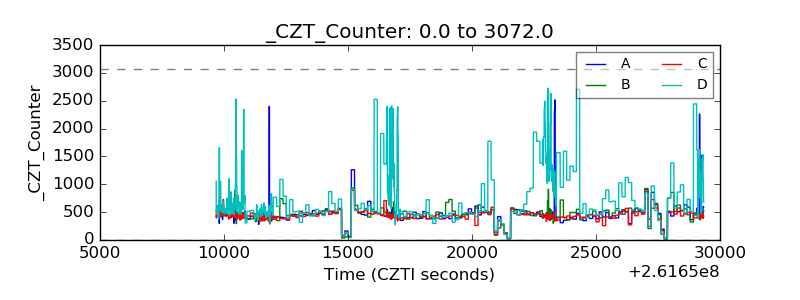 |
| +2.5 Volts monitor |  |
| +5 Volts monitor |  |
| _ROLL_ROT | 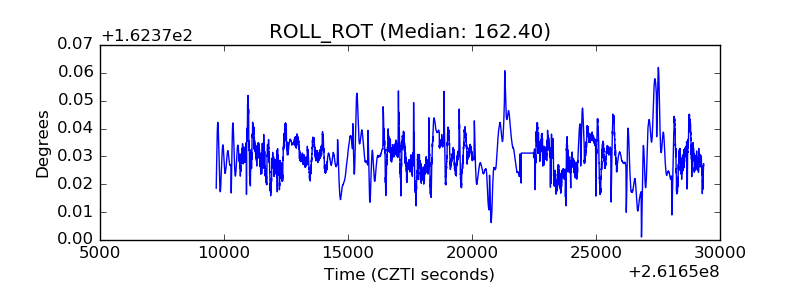 |
| _Roll_DEC | 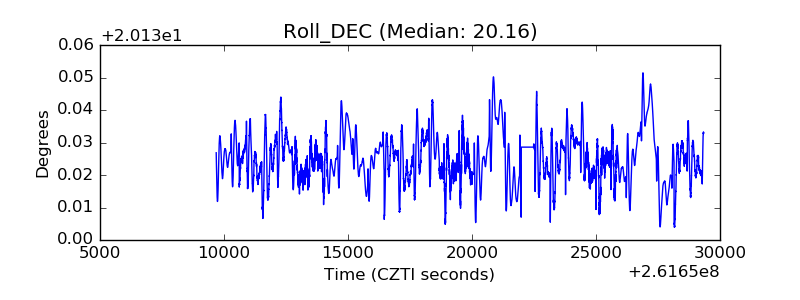 |
| _Roll_RA |  |
| Veto Counter | 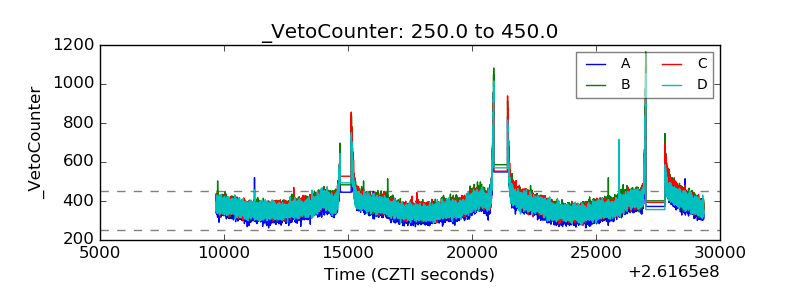 |