| Param | Original file | Final file |
|---|---|---|
| Filename | modeM0/AS1A04_199T01_9000002040_13806cztM0_level2.evt | modeM0/AS1A04_199T01_9000002040_13806cztM0_level2_quad_clean.evt |
| Size (bytes) | 444,738,240 | 88,053,120 |
| Size | 424.1 MB | 84.0 MB |
| Events in quadrant A | 3,044,978 | 568,743 |
| Events in quadrant B | 3,409,988 | 552,556 |
| Events in quadrant C | 3,022,607 | 567,495 |
| Events in quadrant D | 3,563,888 | 538,744 |
| Mode M9 | |||
|---|---|---|---|
| Quadrant | BADHDUFLAG | Total packets | Discarded packets |
| A | 0 | 18 | 0 |
| B | 0 | 18 | 0 |
| C | 0 | 18 | 0 |
| D | 0 | 19 | 0 |
| Mode SS | |||
|---|---|---|---|
| Quadrant | BADHDUFLAG | Total packets | Discarded packets |
| A | 0 | 128 | 0 |
| B | 0 | 128 | 0 |
| C | 0 | 128 | 0 |
| D | 0 | 128 | 0 |
| Mode M0 | |||
|---|---|---|---|
| Quadrant | BADHDUFLAG | Total packets | Discarded packets |
| A | 0 | 13140 | 3 |
| B | 0 | 14093 | 2 |
| C | 0 | 12951 | 2 |
| D | 0 | 14894 | 2 |
| Quadrant | Total seconds | Saturated seconds | Saturation percentage |
|---|---|---|---|
| A | 6287 | 24 | 0.381740% |
| B | 6287 | 218 | 3.467473% |
| C | 6287 | 9 | 0.143153% |
| D | 6287 | 19 | 0.302211% |
Noise dominated data is calculated using 1-second bins in cleaned event files. If a bin has >2000 counts, and if more than 50% of those come from <1% of pixels, then it is considered to be noise-dominated and hence unusable.
| Quadrant | # 1 sec bins | Bins with >0 counts | Bins with >2000 counts | High rate bins dominated by noise | Noise dominated (total time) | Noise dominated (detector-on time) | Marked lightcurve |
|---|---|---|---|---|---|---|---|
| A | 7493 | 6289 | 0 | 0 | 0.00% | 0.00% | 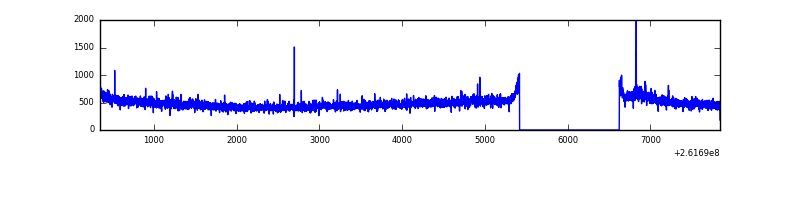 |
| B | 7493 | 6289 | 91 | 91 | 1.21% | 1.45% | 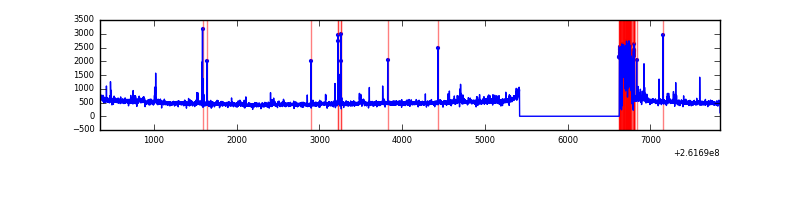 |
| C | 7493 | 6289 | 0 | 0 | 0.00% | 0.00% | 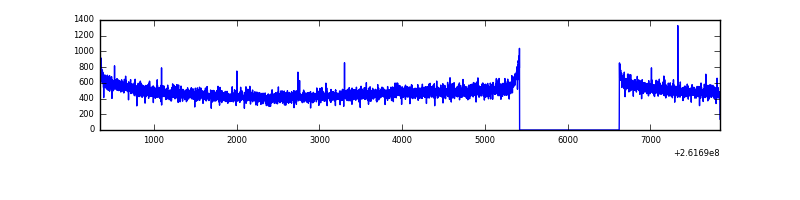 |
| D | 7493 | 6289 | 3 | 3 | 0.04% | 0.05% | 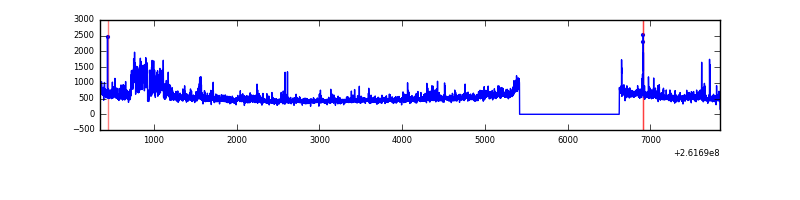 |
Top three noisy pixels from each quadrant. If the there are fewer than three noisy pixels in the level2.evt file, extra rows are filled as -1
| Pixel properties | Quadrant properties | ||||||
|---|---|---|---|---|---|---|---|
| Quadrant | DetID | PixID | Counts | Sigma | Mean | Median | Sigma |
| A | 8 | 15 | 60619 | 385.81 | 768 | 753 | 155.2 |
| A | 1 | 162 | 15314 | 93.84 | 768 | 753 | 155.2 |
| A | 0 | 226 | 6925 | 39.78 | 768 | 753 | 155.2 |
| B | 3 | 64 | 315699 | 2203.48 | 750 | 733 | 142.9 |
| B | 0 | 219 | 49745 | 342.88 | 750 | 733 | 142.9 |
| B | 4 | 173 | 35735 | 244.87 | 750 | 733 | 142.9 |
| C | 3 | 233 | 84070 | 475.83 | 752 | 757 | 175.1 |
| C | 4 | 175 | 6027 | 30.1 | 752 | 757 | 175.1 |
| C | 13 | 61 | 5479 | 26.97 | 752 | 757 | 175.1 |
| D | 1 | 52 | 393689 | 2003.06 | 738 | 722 | 196.2 |
| D | 8 | 195 | 127246 | 644.93 | 738 | 722 | 196.2 |
| D | 10 | 157 | 123344 | 625.04 | 738 | 722 | 196.2 |
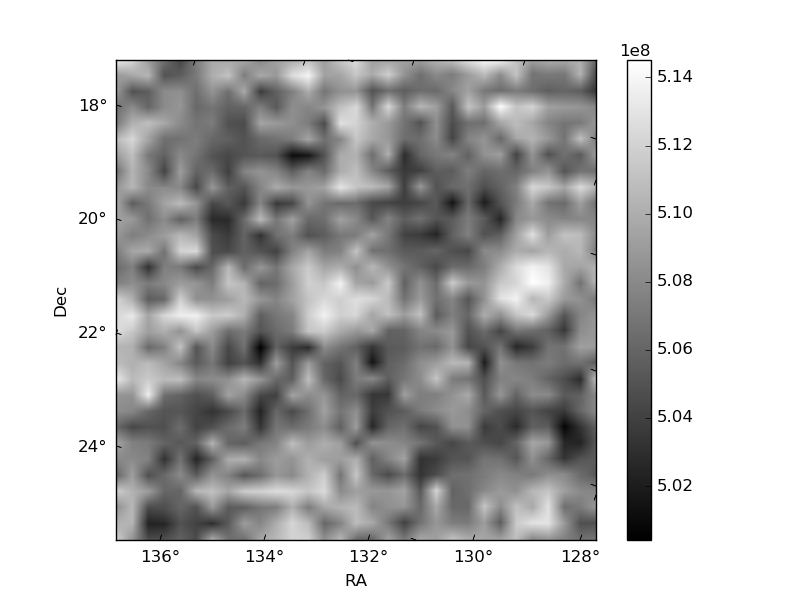
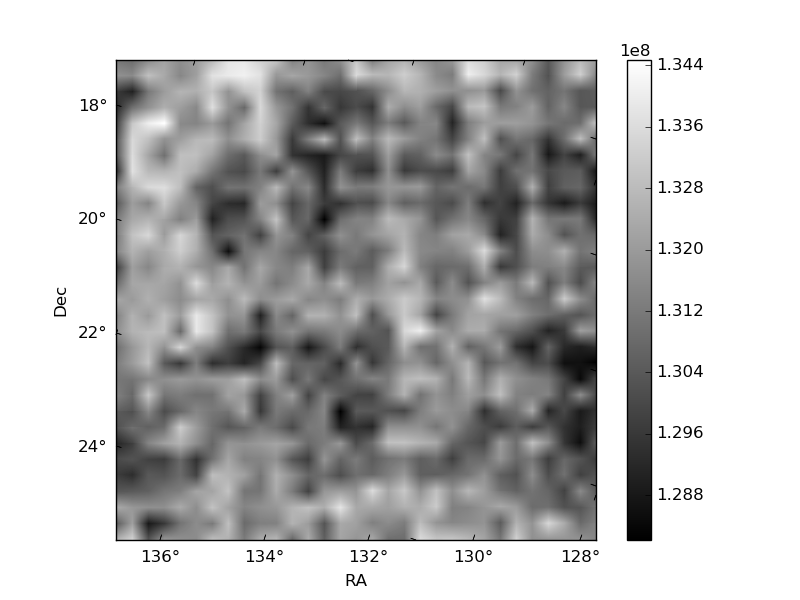
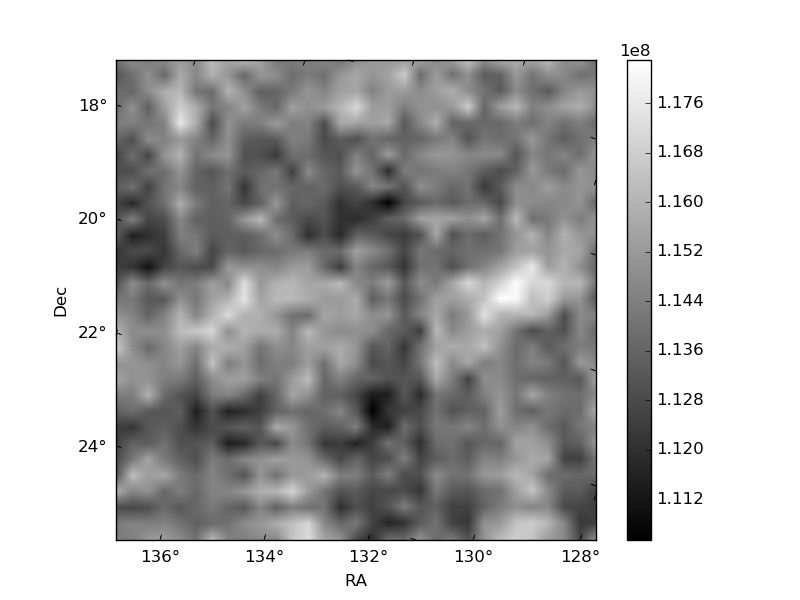
Histogram calculated using DETX and DETY for each event in the final _common_clean file
| Quadrant A | 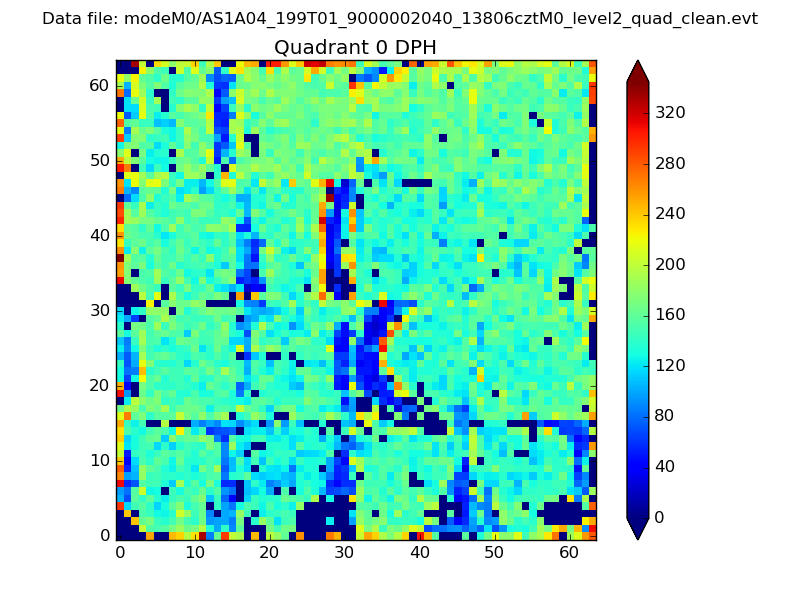 |
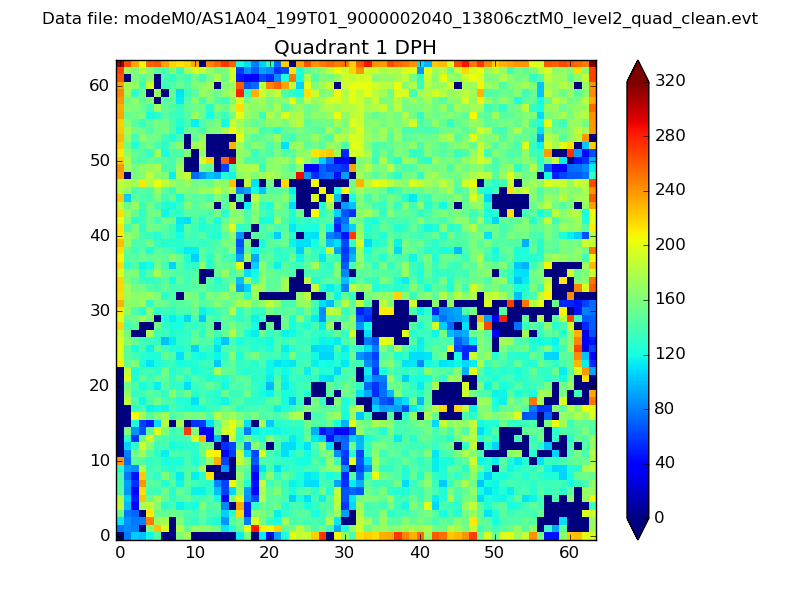 |
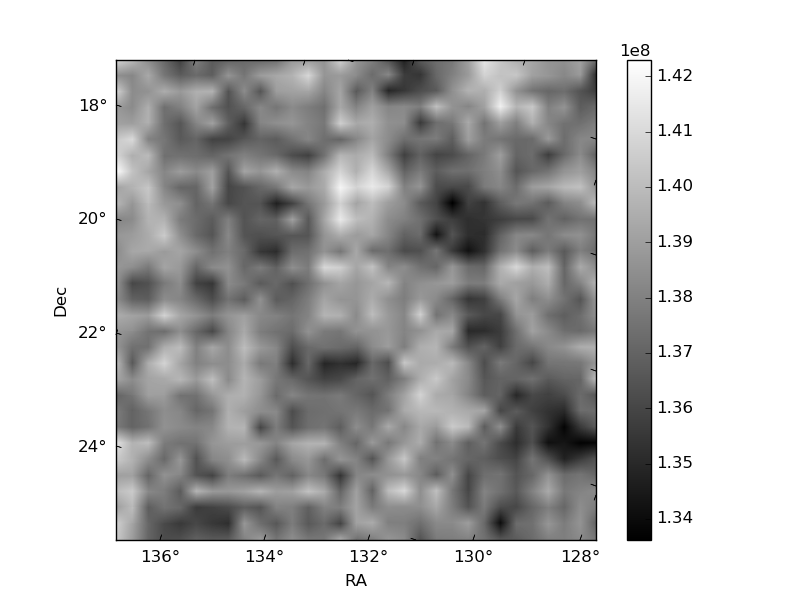
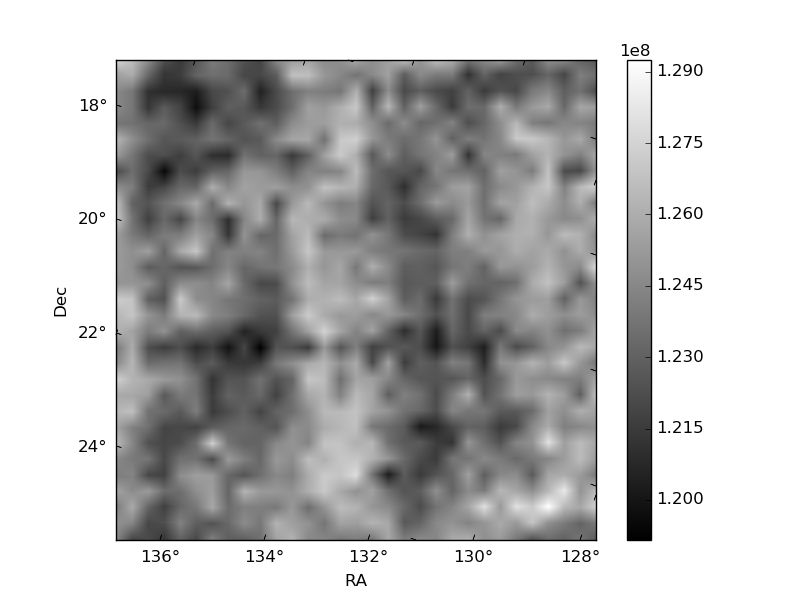
Quadrant B |
|---|---|---|---|
| Quadrant D | 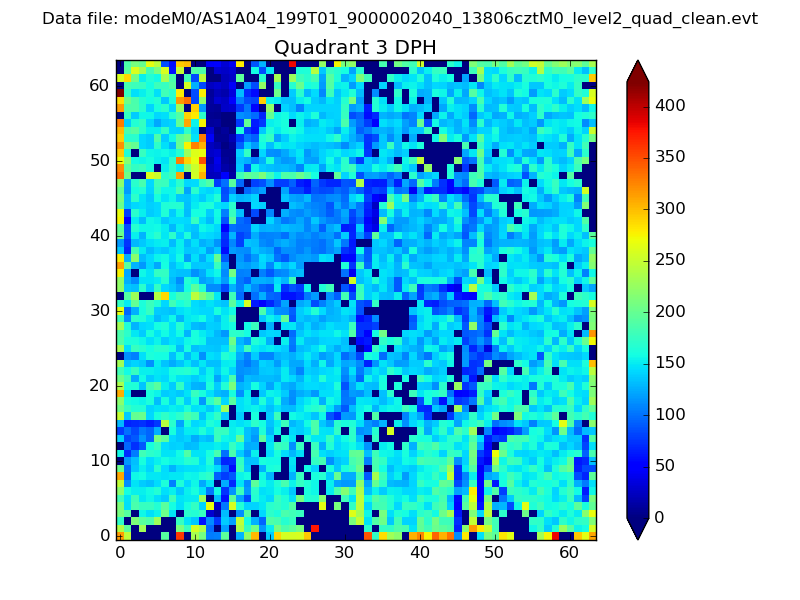 |
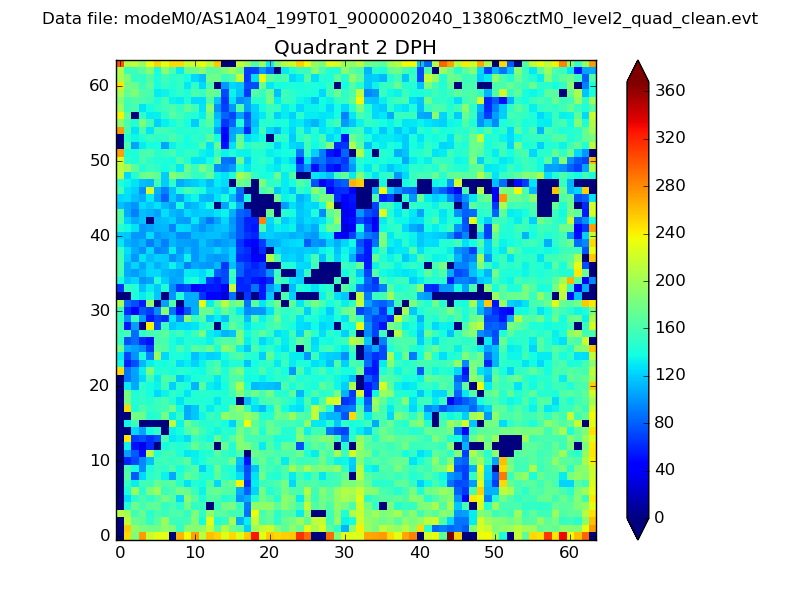 |
Quadrant C |
| Plot type | Count rate plots | Images |
|---|---|---|
| Comparison with Poisson distribution Blue bars denote a histogram of data divided into 1 sec bins. Red curve is a Poisson curve with rate = median count rate of data. |
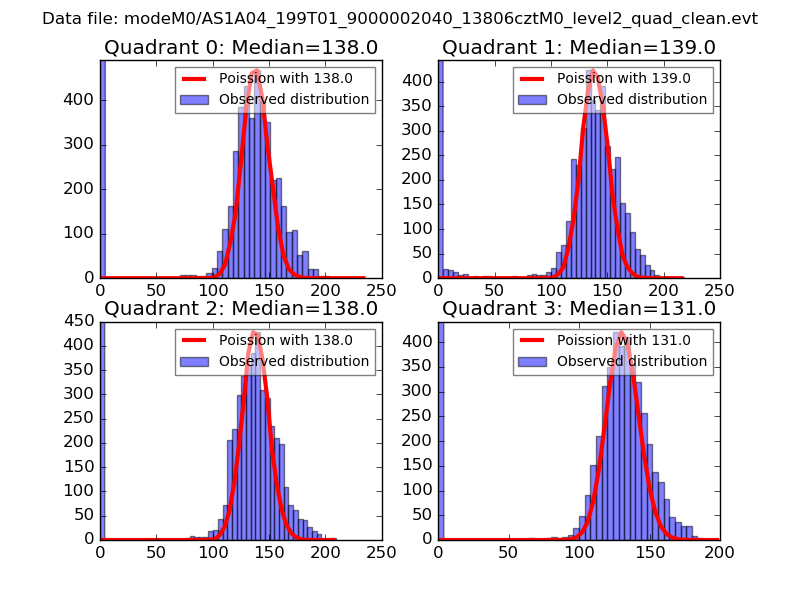 |
 |
| Quadrant-wise count rates Data is divided into 100 sec bins |
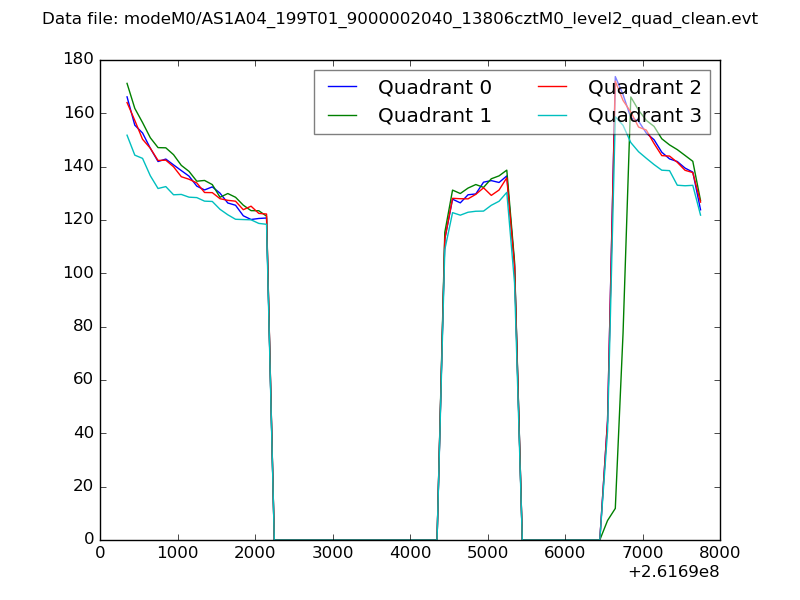 |
|
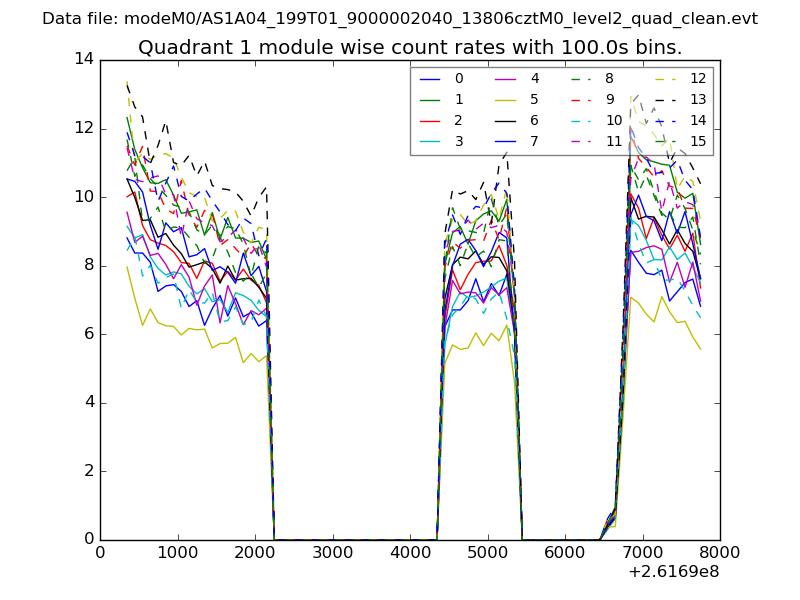
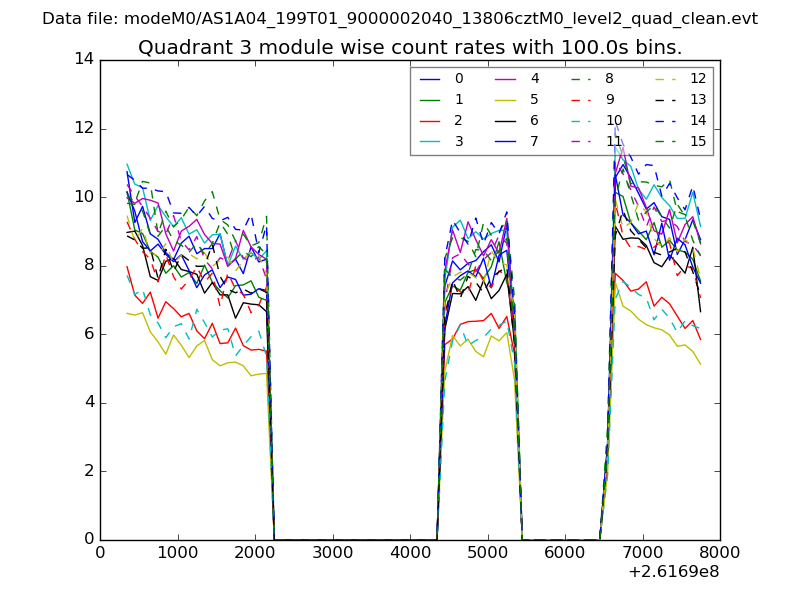
| Module-wise count rates for Quadrant A Data is divided into 100 sec bins |
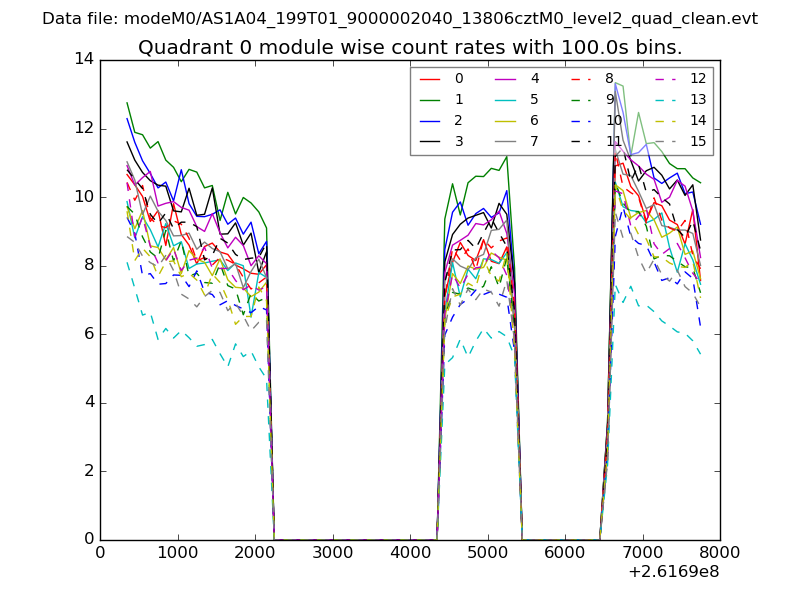 |
 |
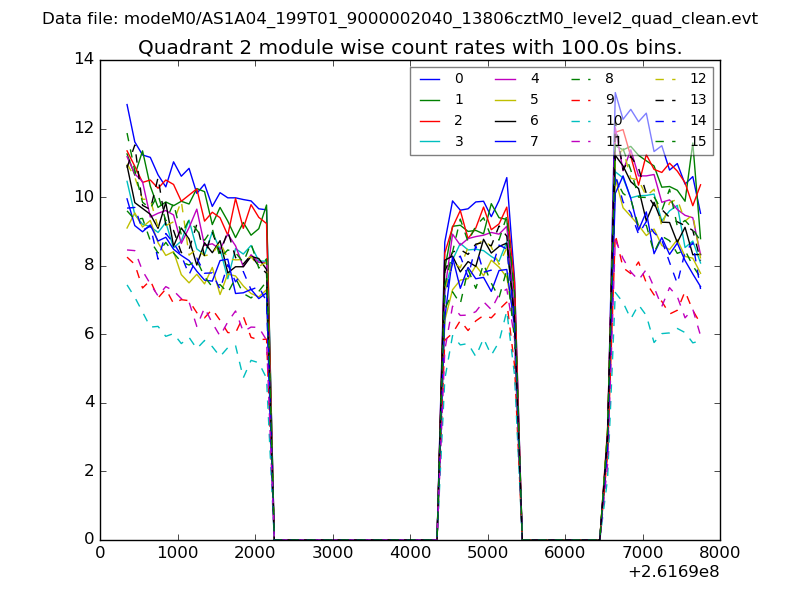
| Module-wise count rates for Quadrant B Data is divided into 100 sec bins |
 |
 |
| Module-wise count rates for Quadrant C Data is divided into 100 sec bins |
 |
 |
| Module-wise count rates for Quadrant D Data is divided into 100 sec bins |
 |
 |
| Parameter | Plot |
|---|---|
| CZT HV Monitor | 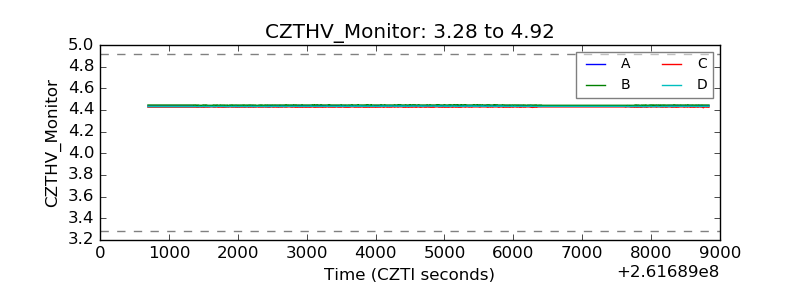 |
| D_VDD | 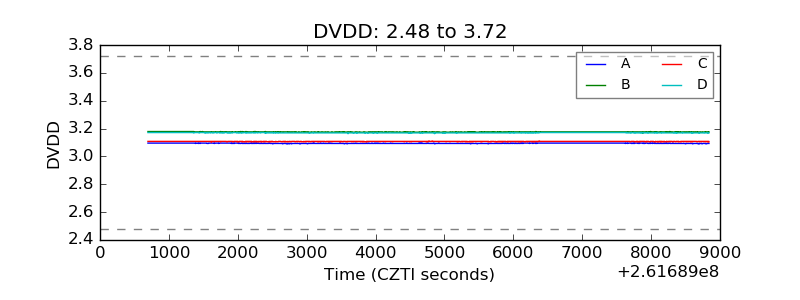 |
| Temperature 1 | 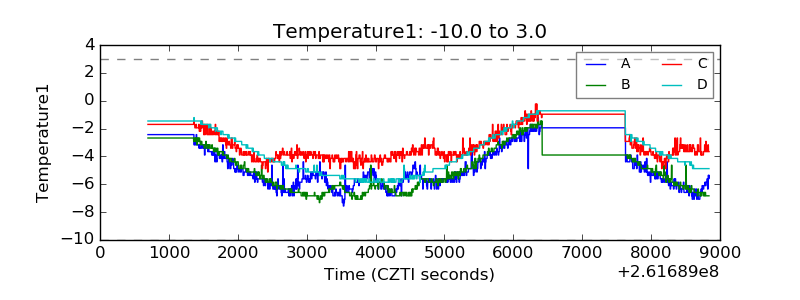 |
| Veto HV Monitor | 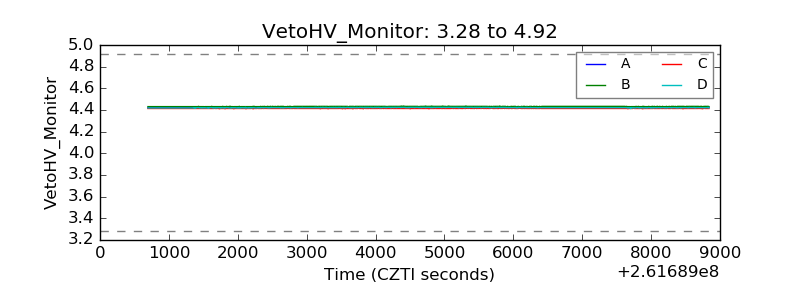 |
| Veto LLD | 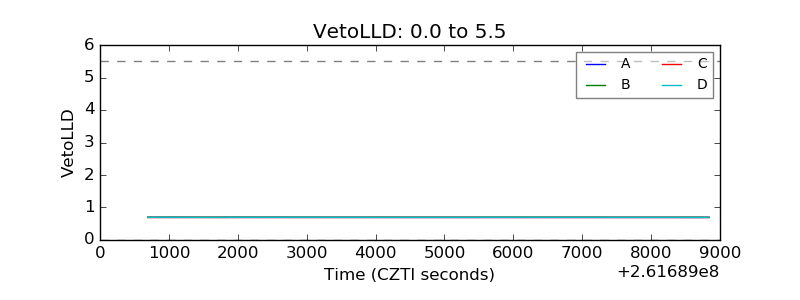 |
| Alpha Counter | 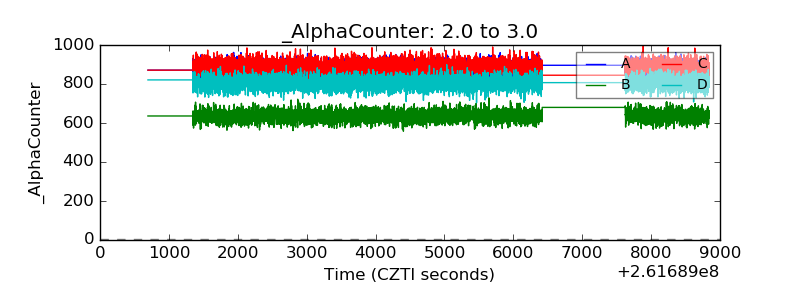 |
| _CPM_Rate | 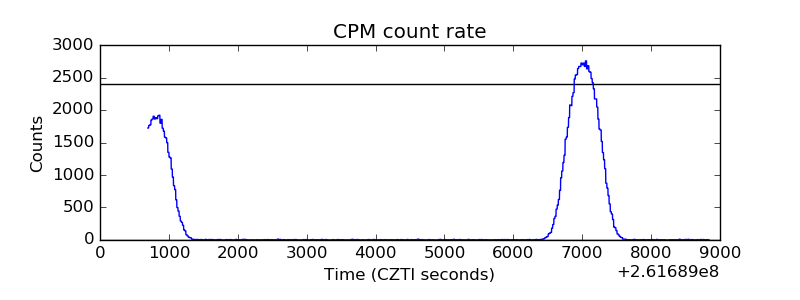 |
| CZT Counter | 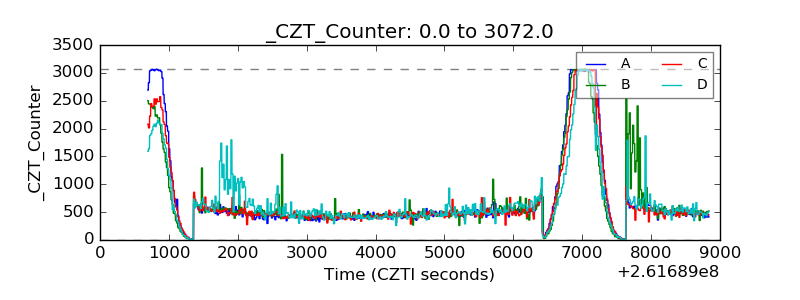 |
| +2.5 Volts monitor | 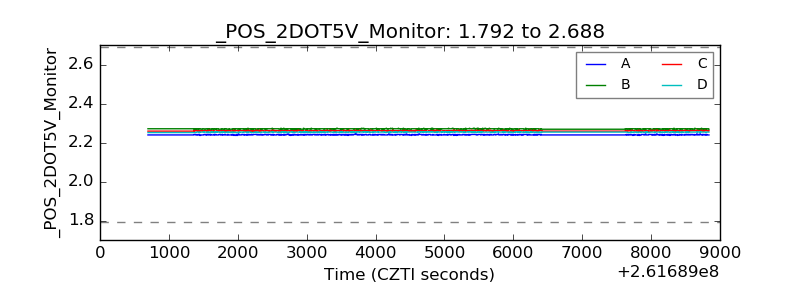 |
| +5 Volts monitor | 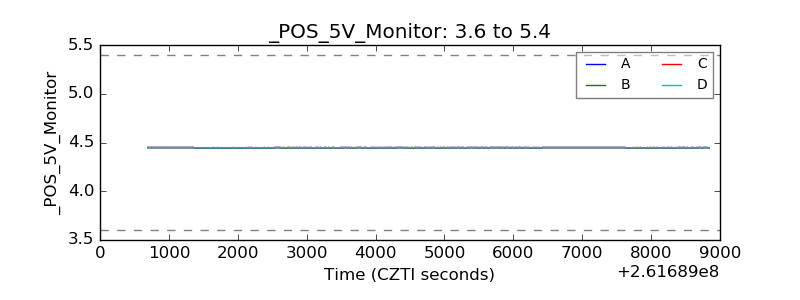 |
| _ROLL_ROT | 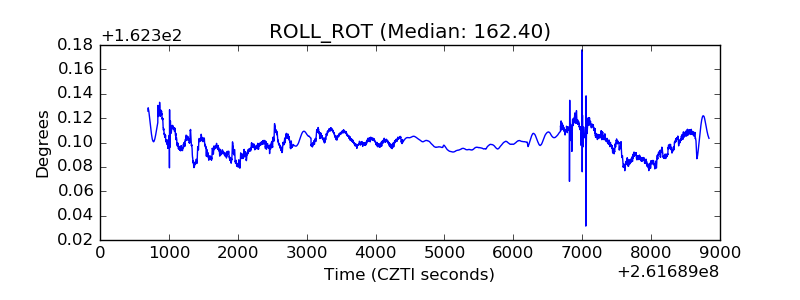 |
| _Roll_DEC | 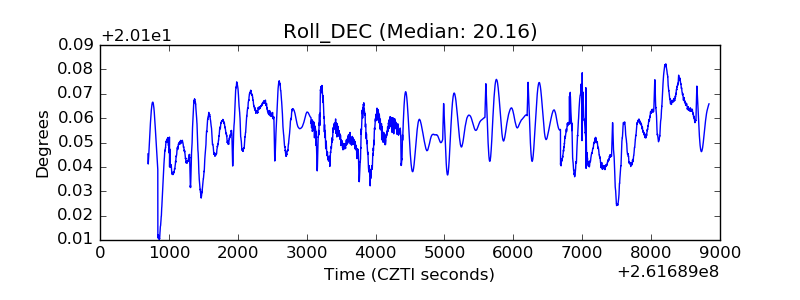 |
| _Roll_RA | 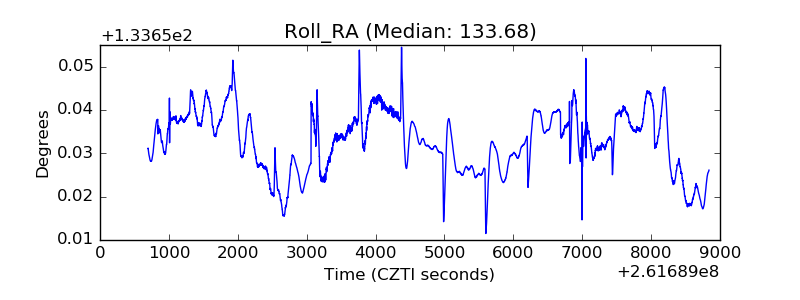 |
| Veto Counter | 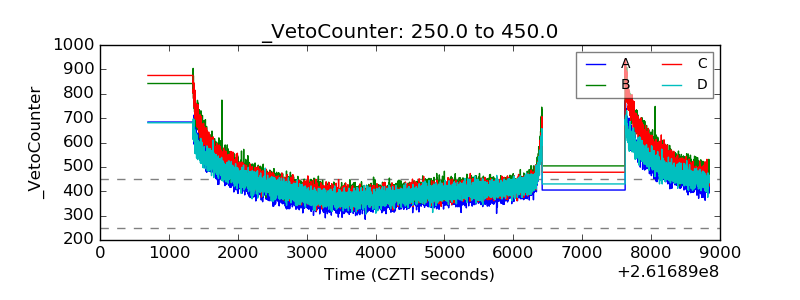 |