| Param | Original file | Final file |
|---|---|---|
| Filename | modeM0/AS1A04_199T01_9000002040_13807cztM0_level2.evt | modeM0/AS1A04_199T01_9000002040_13807cztM0_level2_quad_clean.evt |
| Size (bytes) | 447,554,880 | 86,745,600 |
| Size | 426.8 MB | 82.7 MB |
| Events in quadrant A | 3,077,263 | 561,732 |
| Events in quadrant B | 3,534,177 | 546,636 |
| Events in quadrant C | 3,063,828 | 557,311 |
| Events in quadrant D | 3,459,205 | 529,903 |
| Mode M9 | |||
|---|---|---|---|
| Quadrant | BADHDUFLAG | Total packets | Discarded packets |
| A | 0 | 16 | 0 |
| B | 0 | 16 | 0 |
| C | 0 | 16 | 0 |
| D | 0 | 17 | 0 |
| Mode SS | |||
|---|---|---|---|
| Quadrant | BADHDUFLAG | Total packets | Discarded packets |
| A | 0 | 126 | 0 |
| B | 0 | 126 | 0 |
| C | 0 | 126 | 0 |
| D | 0 | 126 | 0 |
| Mode M0 | |||
|---|---|---|---|
| Quadrant | BADHDUFLAG | Total packets | Discarded packets |
| A | 0 | 13015 | 3 |
| B | 0 | 14342 | 2 |
| C | 0 | 12830 | 2 |
| D | 0 | 14329 | 2 |
| Quadrant | Total seconds | Saturated seconds | Saturation percentage |
|---|---|---|---|
| A | 6177 | 28 | 0.453294% |
| B | 6177 | 256 | 4.144407% |
| C | 6177 | 19 | 0.307593% |
| D | 6177 | 28 | 0.453294% |
Noise dominated data is calculated using 1-second bins in cleaned event files. If a bin has >2000 counts, and if more than 50% of those come from <1% of pixels, then it is considered to be noise-dominated and hence unusable.
| Quadrant | # 1 sec bins | Bins with >0 counts | Bins with >2000 counts | High rate bins dominated by noise | Noise dominated (total time) | Noise dominated (detector-on time) | Marked lightcurve |
|---|---|---|---|---|---|---|---|
| A | 7453 | 6179 | 0 | 0 | 0.00% | 0.00% | 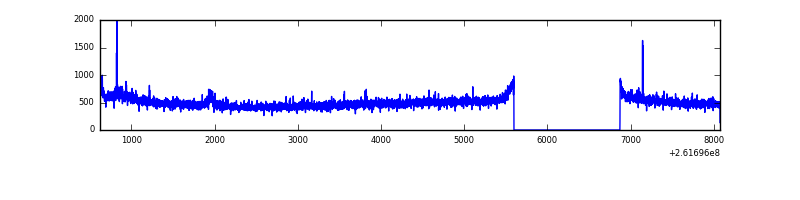 |
| B | 7453 | 6179 | 105 | 105 | 1.41% | 1.70% | 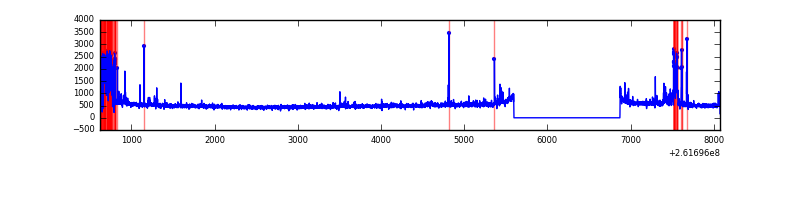 |
| C | 7453 | 6179 | 0 | 0 | 0.00% | 0.00% | 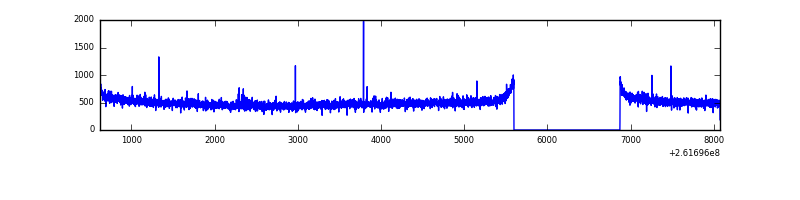 |
| D | 7453 | 6179 | 9 | 9 | 0.12% | 0.15% | 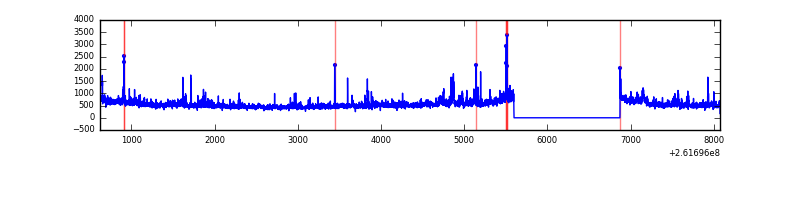 |
Top three noisy pixels from each quadrant. If the there are fewer than three noisy pixels in the level2.evt file, extra rows are filled as -1
| Pixel properties | Quadrant properties | ||||||
|---|---|---|---|---|---|---|---|
| Quadrant | DetID | PixID | Counts | Sigma | Mean | Median | Sigma |
| A | 8 | 15 | 32633 | 200.4 | 780 | 766 | 159.0 |
| A | 15 | 69 | 20013 | 121.04 | 780 | 766 | 159.0 |
| A | 1 | 162 | 17653 | 106.2 | 780 | 766 | 159.0 |
| B | 3 | 64 | 320214 | 2228.58 | 762 | 745 | 143.4 |
| B | 10 | 252 | 112752 | 781.35 | 762 | 745 | 143.4 |
| B | 4 | 173 | 45610 | 312.97 | 762 | 745 | 143.4 |
| C | 3 | 233 | 99532 | 557.13 | 759 | 763 | 177.3 |
| C | 14 | 234 | 6072 | 29.94 | 759 | 763 | 177.3 |
| C | 13 | 61 | 5554 | 27.02 | 759 | 763 | 177.3 |
| D | 1 | 52 | 173878 | 912.75 | 744 | 727 | 189.7 |
| D | 8 | 195 | 146402 | 767.91 | 744 | 727 | 189.7 |
| D | 5 | 222 | 130230 | 682.66 | 744 | 727 | 189.7 |
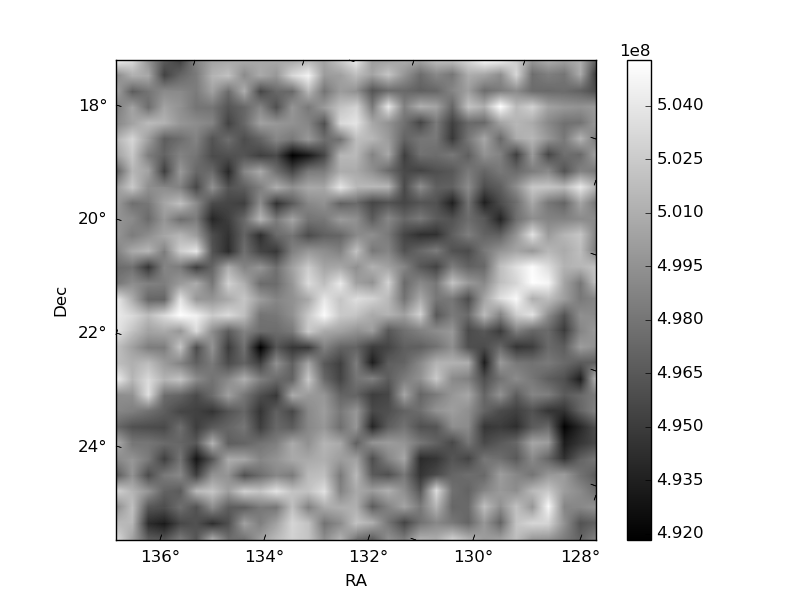
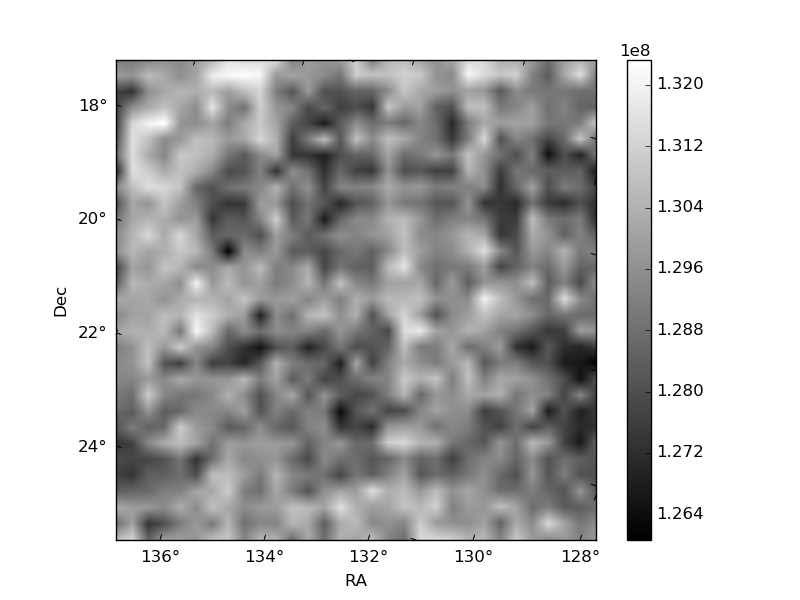
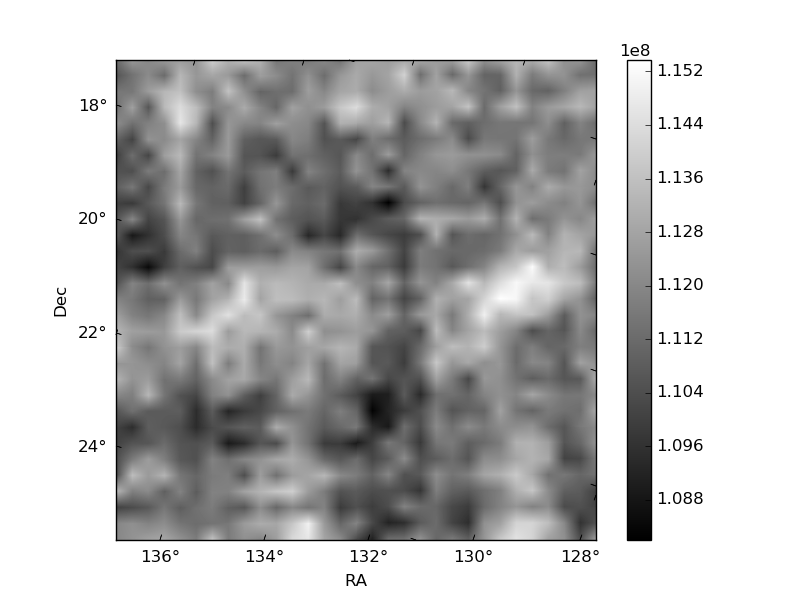
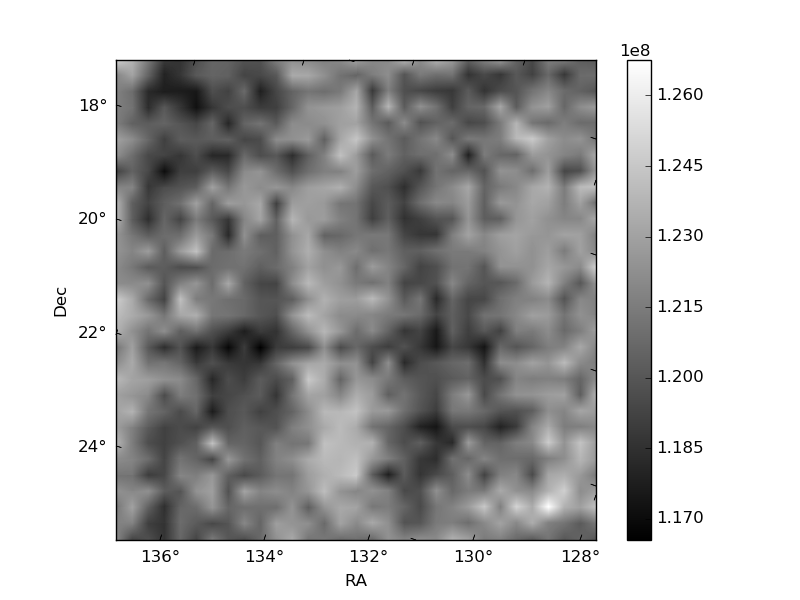
Histogram calculated using DETX and DETY for each event in the final _common_clean file
| Quadrant A | 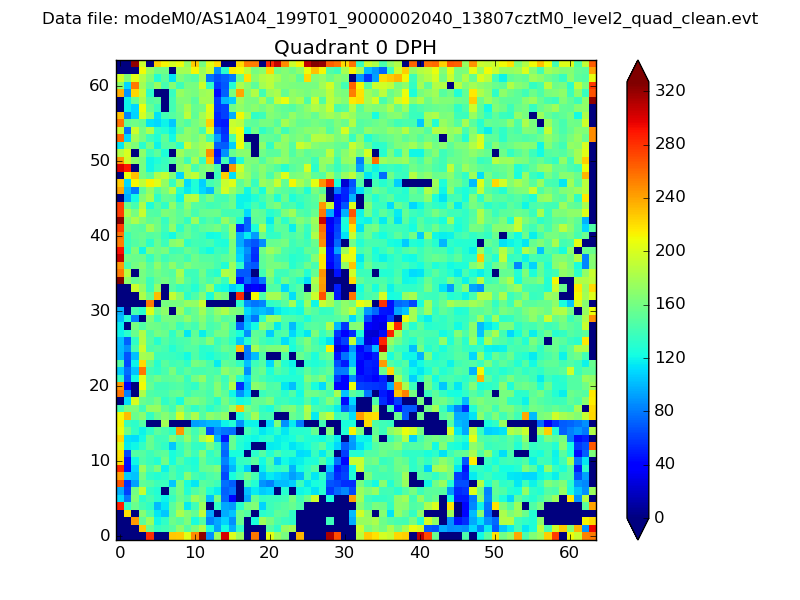 |
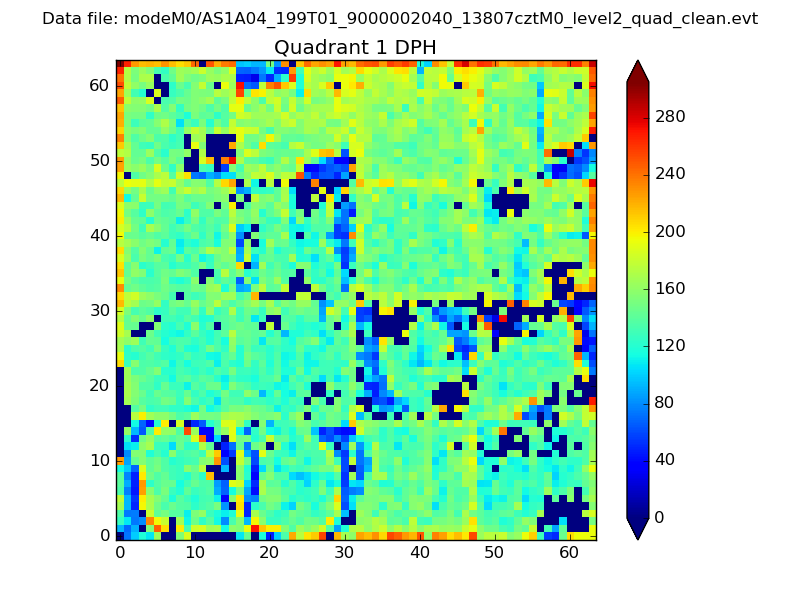 |
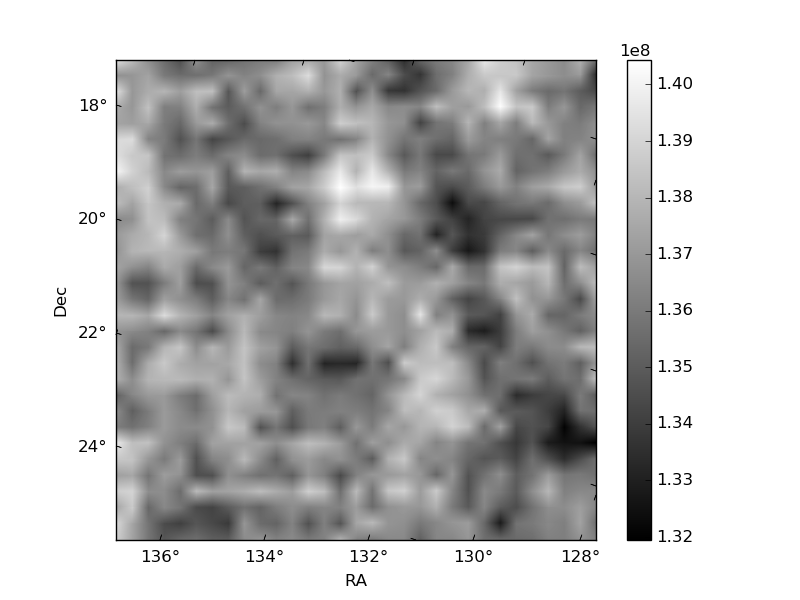
Quadrant B |
|---|---|---|---|
| Quadrant D | 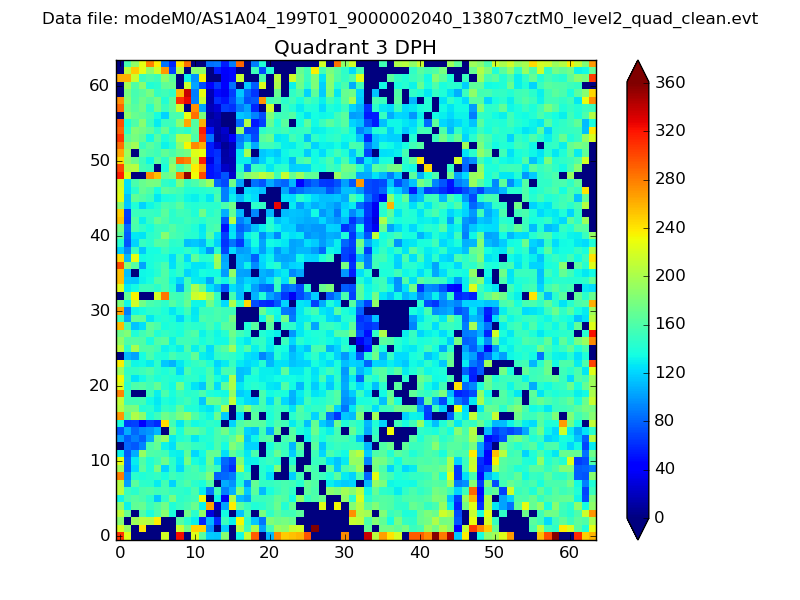 |
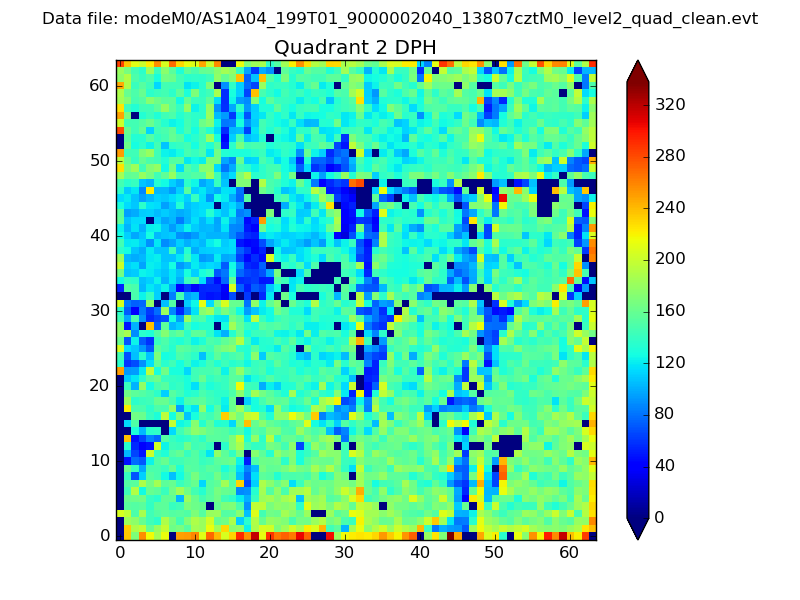 |
Quadrant C |
| Plot type | Count rate plots | Images |
|---|---|---|
| Comparison with Poisson distribution Blue bars denote a histogram of data divided into 1 sec bins. Red curve is a Poisson curve with rate = median count rate of data. |
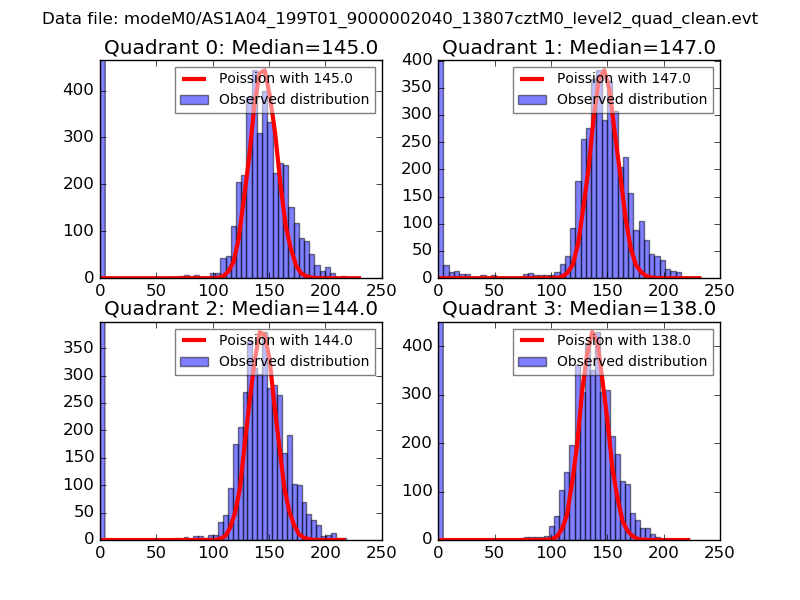 |
 |
| Quadrant-wise count rates Data is divided into 100 sec bins |
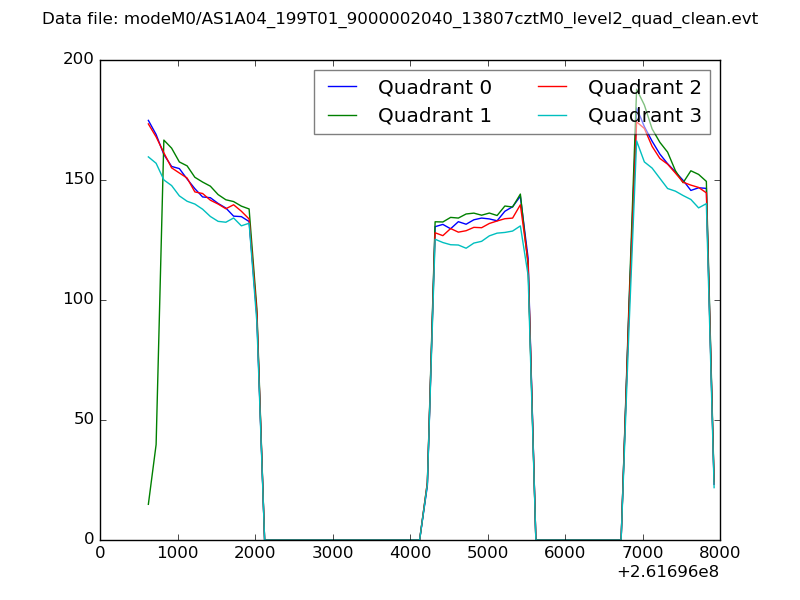 |
|
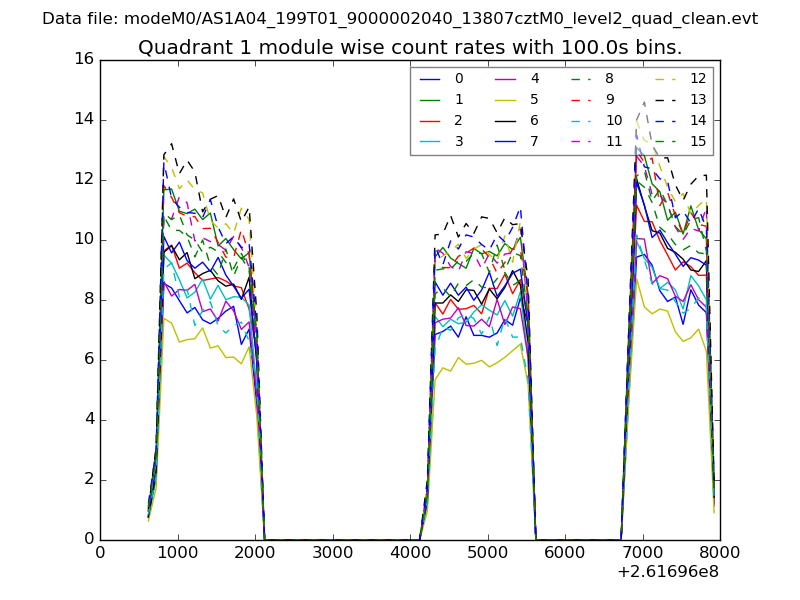
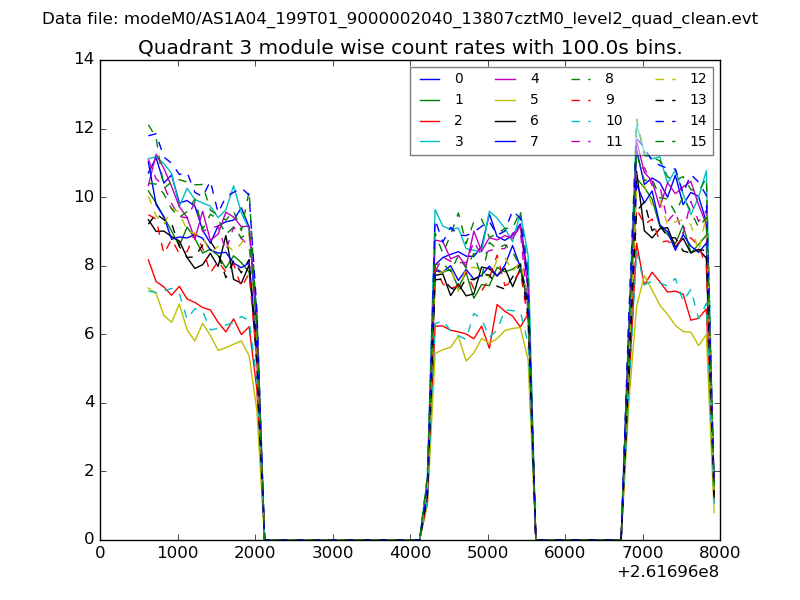
| Module-wise count rates for Quadrant A Data is divided into 100 sec bins |
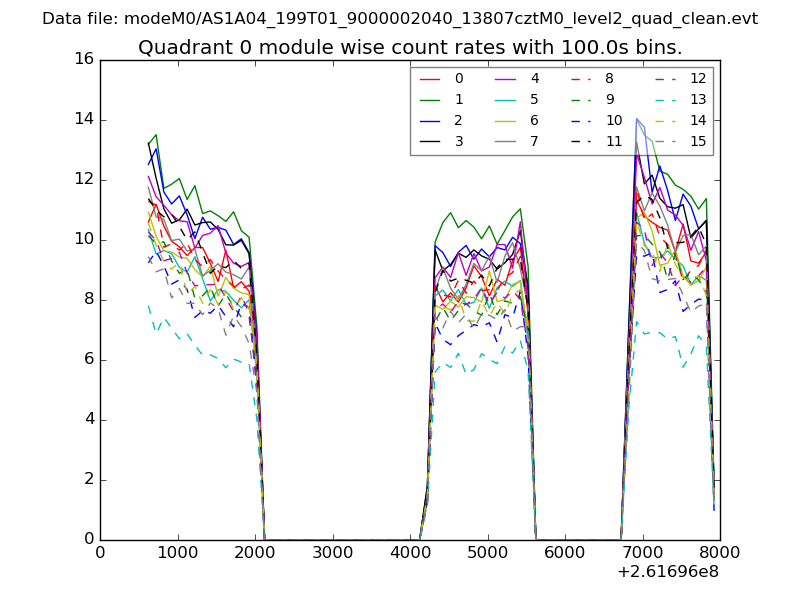 |
 |
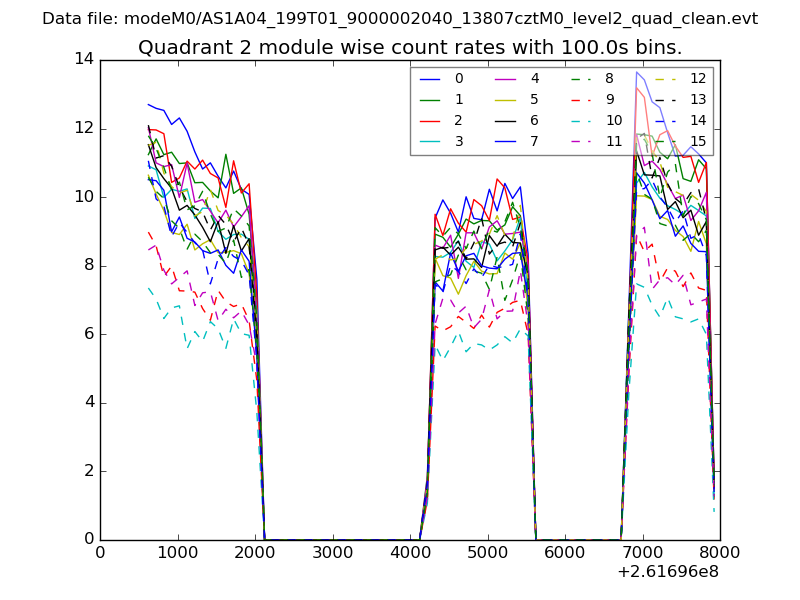
| Module-wise count rates for Quadrant B Data is divided into 100 sec bins |
 |
 |
| Module-wise count rates for Quadrant C Data is divided into 100 sec bins |
 |
 |
| Module-wise count rates for Quadrant D Data is divided into 100 sec bins |
 |
 |
| Parameter | Plot |
|---|---|
| CZT HV Monitor | 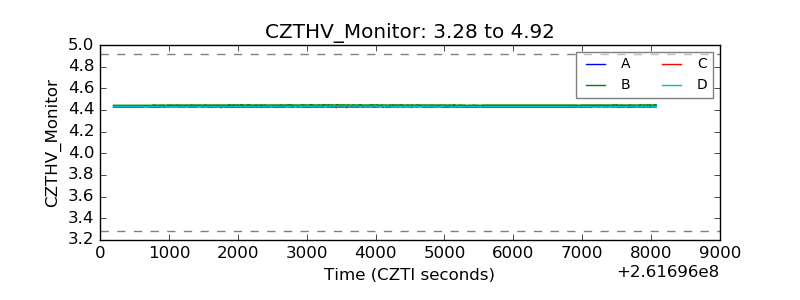 |
| D_VDD | 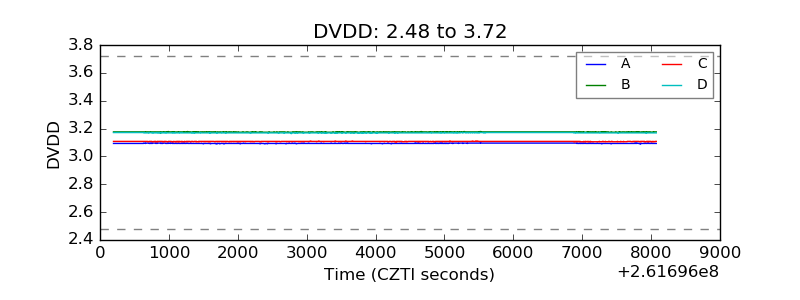 |
| Temperature 1 | 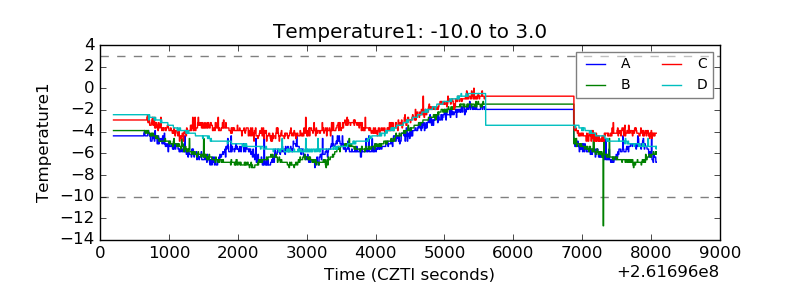 |
| Veto HV Monitor | 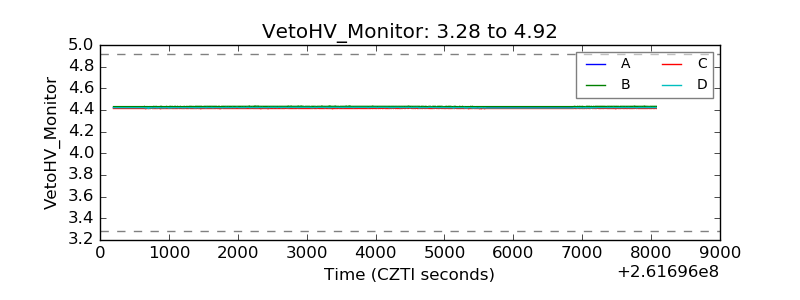 |
| Veto LLD | 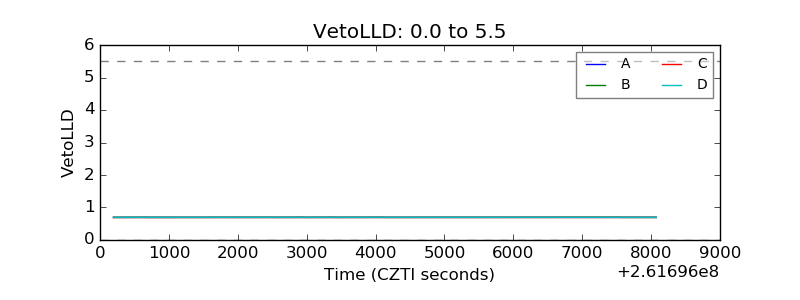 |
| Alpha Counter | 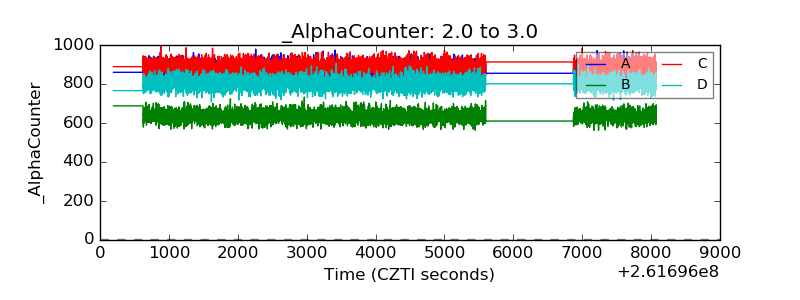 |
| _CPM_Rate | 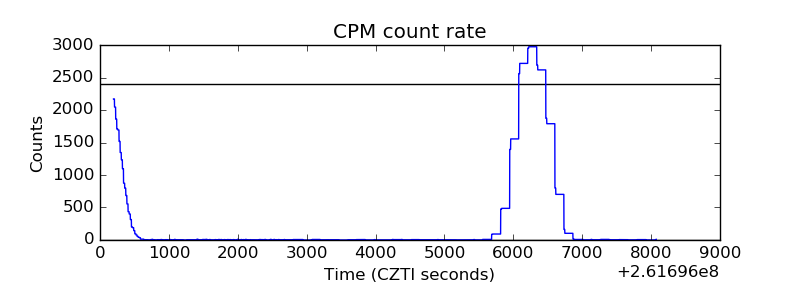 |
| CZT Counter | 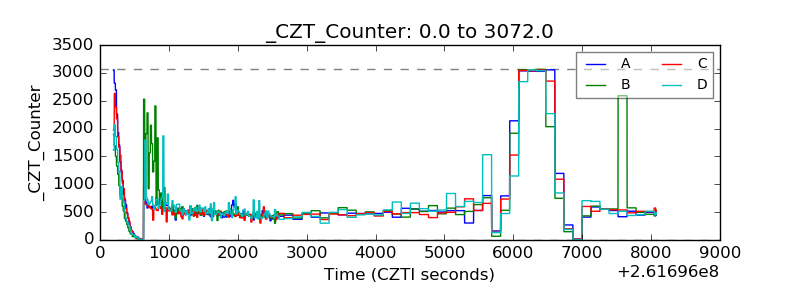 |
| +2.5 Volts monitor |  |
| +5 Volts monitor |  |
| _ROLL_ROT | 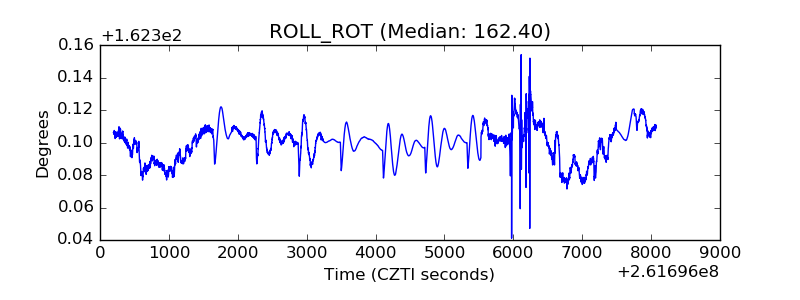 |
| _Roll_DEC | 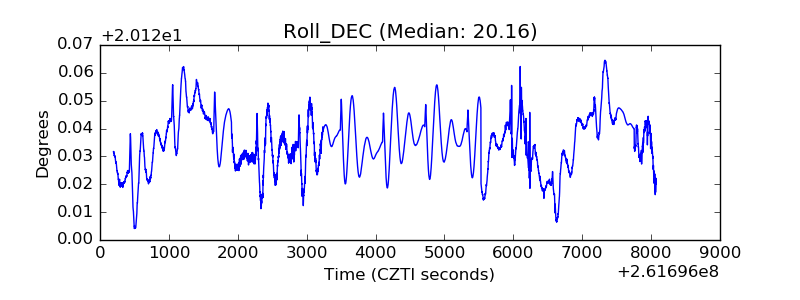 |
| _Roll_RA | 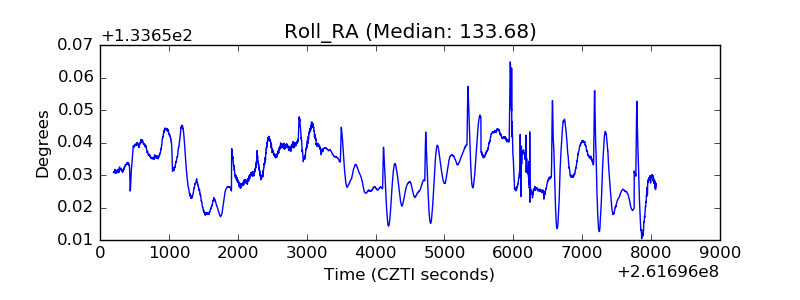 |
| Veto Counter | 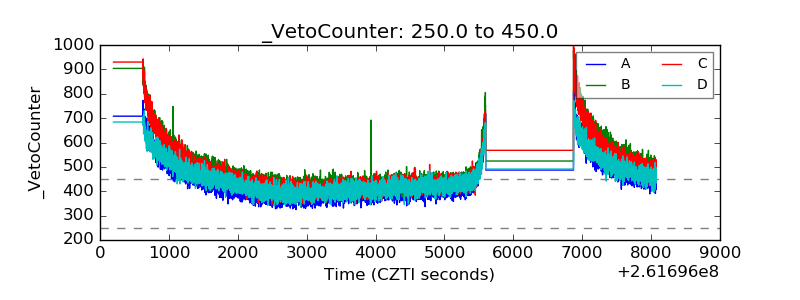 |