| Param | Original file | Final file |
|---|---|---|
| Filename | modeM0/AS1A04_199T01_9000002040_13813cztM0_level2.evt | modeM0/AS1A04_199T01_9000002040_13813cztM0_level2_quad_clean.evt |
| Size (bytes) | 592,292,160 | 86,497,920 |
| Size | 564.9 MB | 82.5 MB |
| Events in quadrant A | 3,987,553 | 517,836 |
| Events in quadrant B | 4,161,994 | 525,053 |
| Events in quadrant C | 4,068,927 | 514,475 |
| Events in quadrant D | 5,158,909 | 488,712 |
| Mode M9 | |||
|---|---|---|---|
| Quadrant | BADHDUFLAG | Total packets | Discarded packets |
| A | 0 | 3 | 0 |
| B | 0 | 3 | 0 |
| C | 0 | 3 | 0 |
| D | 0 | 3 | 0 |
| Mode SS | |||
|---|---|---|---|
| Quadrant | BADHDUFLAG | Total packets | Discarded packets |
| A | 0 | 170 | 0 |
| B | 0 | 170 | 0 |
| C | 0 | 170 | 0 |
| D | 0 | 170 | 0 |
| Mode M0 | |||
|---|---|---|---|
| Quadrant | BADHDUFLAG | Total packets | Discarded packets |
| A | 0 | 17331 | 5 |
| B | 0 | 17616 | 4 |
| C | 0 | 17387 | 4 |
| D | 0 | 20673 | 4 |
| Quadrant | Total seconds | Saturated seconds | Saturation percentage |
|---|---|---|---|
| A | 8244 | 478 | 5.798156% |
| B | 8244 | 511 | 6.198447% |
| C | 8244 | 367 | 4.451722% |
| D | 8244 | 456 | 5.531295% |
Noise dominated data is calculated using 1-second bins in cleaned event files. If a bin has >2000 counts, and if more than 50% of those come from <1% of pixels, then it is considered to be noise-dominated and hence unusable.
| Quadrant | # 1 sec bins | Bins with >0 counts | Bins with >2000 counts | High rate bins dominated by noise | Noise dominated (total time) | Noise dominated (detector-on time) | Marked lightcurve |
|---|---|---|---|---|---|---|---|
| A | 8595 | 8247 | 0 | 0 | 0.00% | 0.00% | 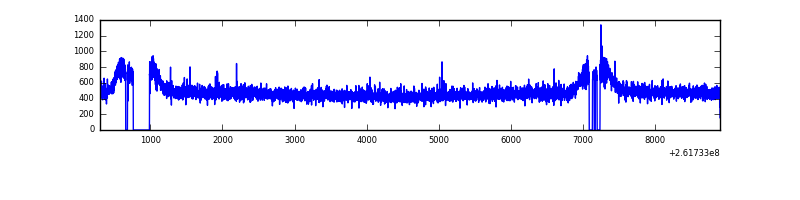 |
| B | 8595 | 8246 | 6 | 6 | 0.07% | 0.07% | 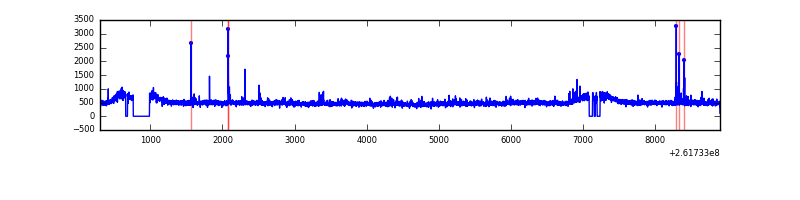 |
| C | 8595 | 8249 | 0 | 0 | 0.00% | 0.00% | 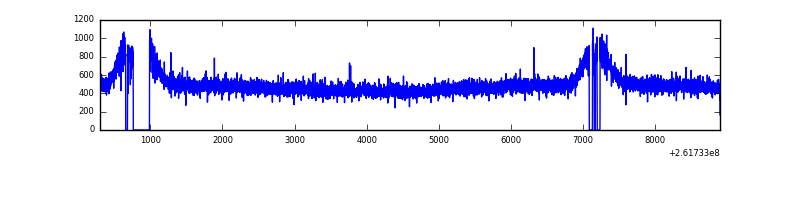 |
| D | 8595 | 8246 | 44 | 44 | 0.51% | 0.53% | 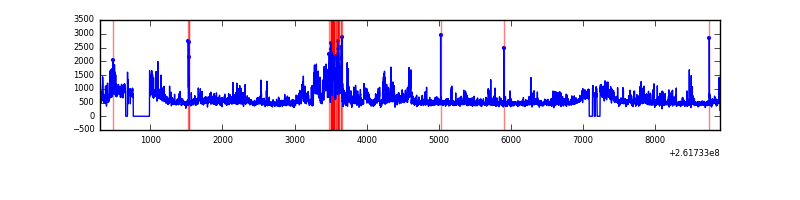 |
Top three noisy pixels from each quadrant. If the there are fewer than three noisy pixels in the level2.evt file, extra rows are filled as -1
| Pixel properties | Quadrant properties | ||||||
|---|---|---|---|---|---|---|---|
| Quadrant | DetID | PixID | Counts | Sigma | Mean | Median | Sigma |
| A | 1 | 162 | 19738 | 88.2 | 1027 | 1002 | 212.4 |
| A | 8 | 15 | 10524 | 44.82 | 1027 | 1002 | 212.4 |
| A | 0 | 226 | 9107 | 38.15 | 1027 | 1002 | 212.4 |
| B | 4 | 80 | 58592 | 288.95 | 1023 | 994 | 199.3 |
| B | 10 | 244 | 45766 | 224.6 | 1023 | 994 | 199.3 |
| B | 0 | 214 | 26838 | 129.65 | 1023 | 994 | 199.3 |
| C | 3 | 233 | 133453 | 564.54 | 1006 | 1008 | 234.6 |
| C | 13 | 61 | 7160 | 26.22 | 1006 | 1008 | 234.6 |
| C | 8 | 128 | 5444 | 18.91 | 1006 | 1008 | 234.6 |
| D | 1 | 52 | 912569 | 3761.08 | 997 | 965 | 242.4 |
| D | 10 | 157 | 313725 | 1290.38 | 997 | 965 | 242.4 |
| D | 5 | 222 | 71894 | 292.64 | 997 | 965 | 242.4 |
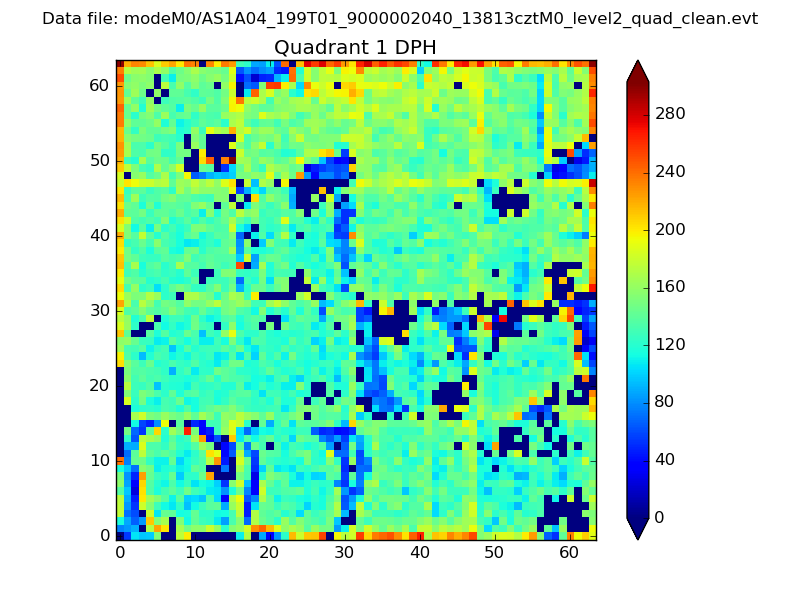
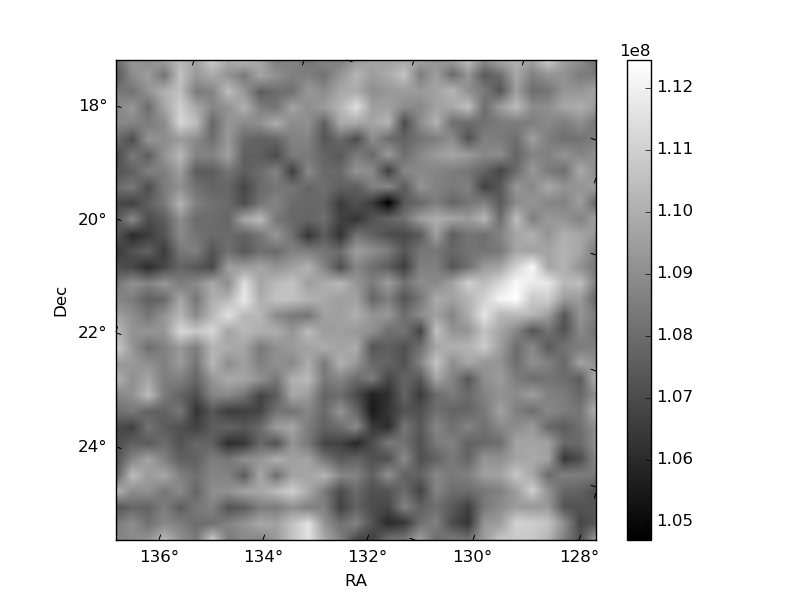
Histogram calculated using DETX and DETY for each event in the final _common_clean file
| Quadrant A |  |
 |
Quadrant B |
|---|---|---|---|
| Quadrant D | 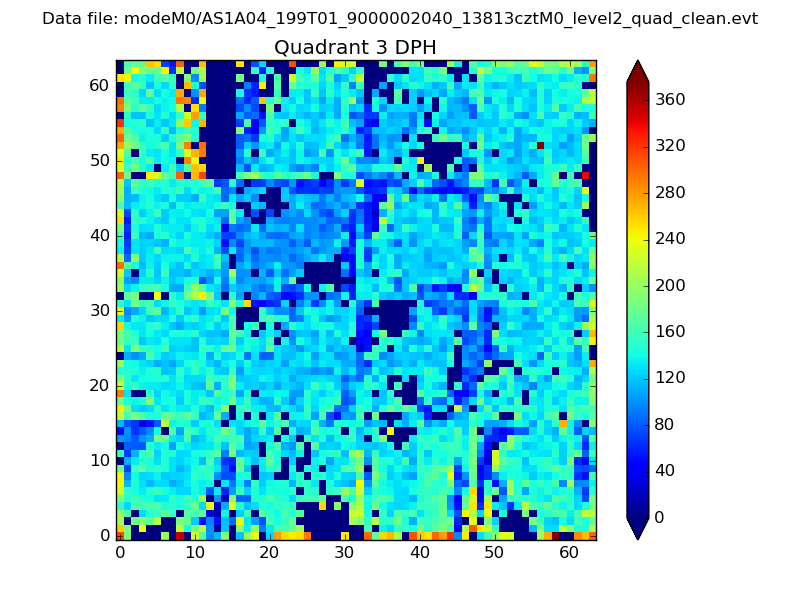 |
 |
Quadrant C |
| Plot type | Count rate plots | Images |
|---|---|---|
| Comparison with Poisson distribution Blue bars denote a histogram of data divided into 1 sec bins. Red curve is a Poisson curve with rate = median count rate of data. |
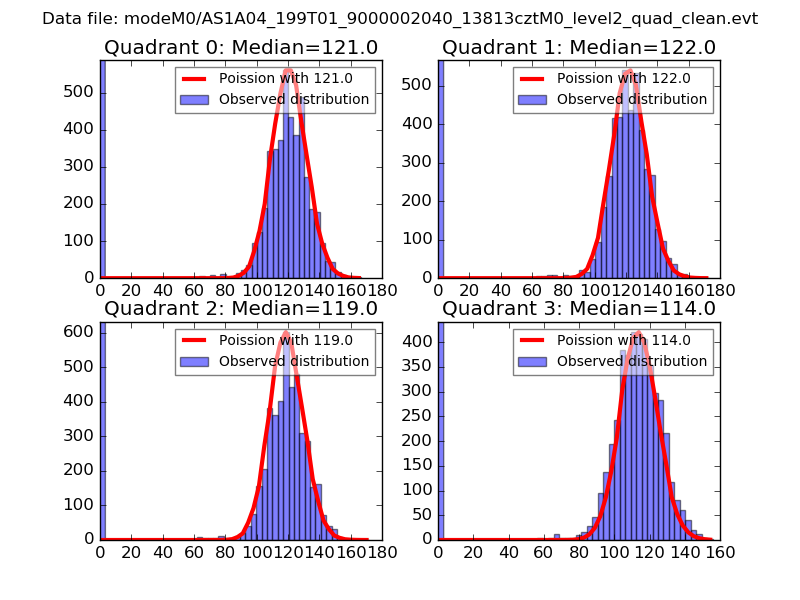 |
 |
| Quadrant-wise count rates Data is divided into 100 sec bins |
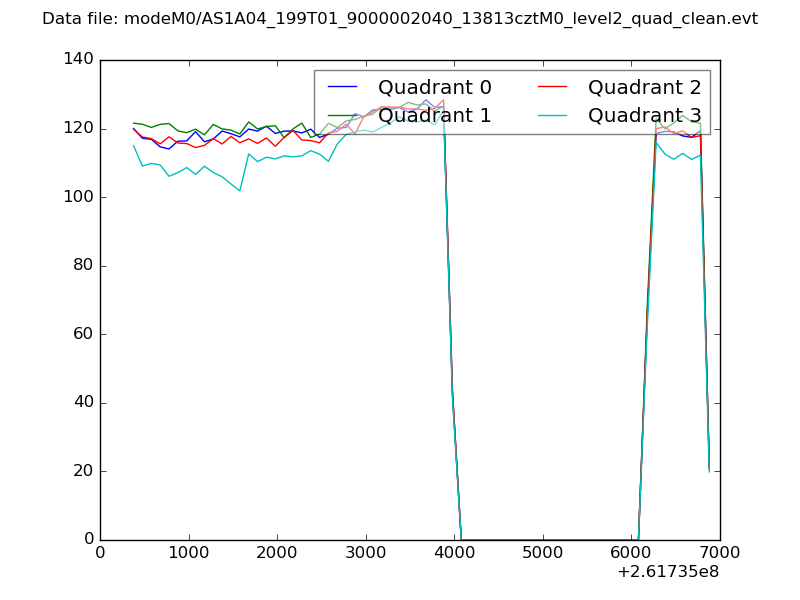 |
|
| Module-wise count rates for Quadrant A Data is divided into 100 sec bins |
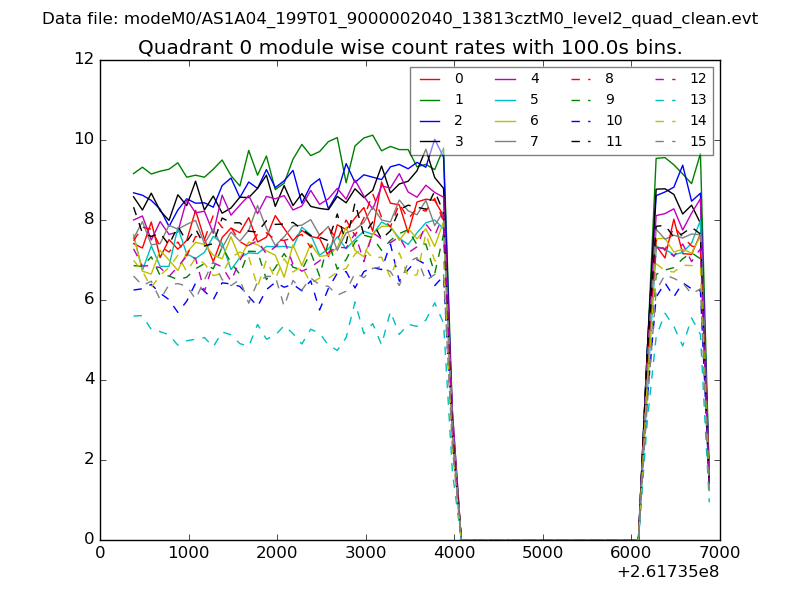 |
 |
| Module-wise count rates for Quadrant B Data is divided into 100 sec bins |
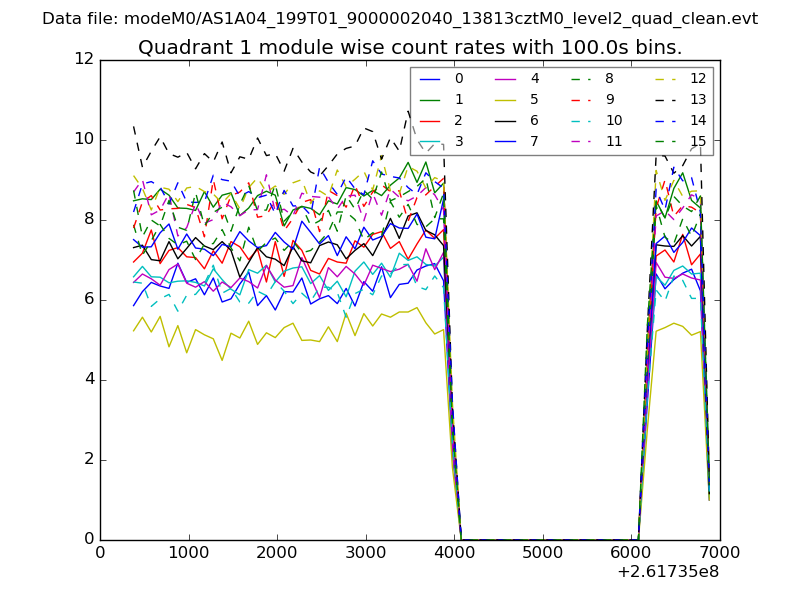 |
 |
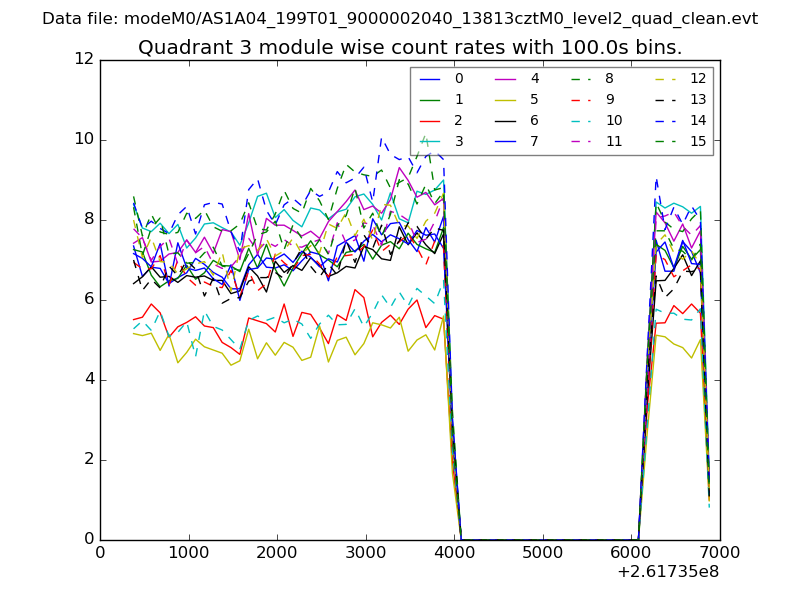
| Module-wise count rates for Quadrant C Data is divided into 100 sec bins |
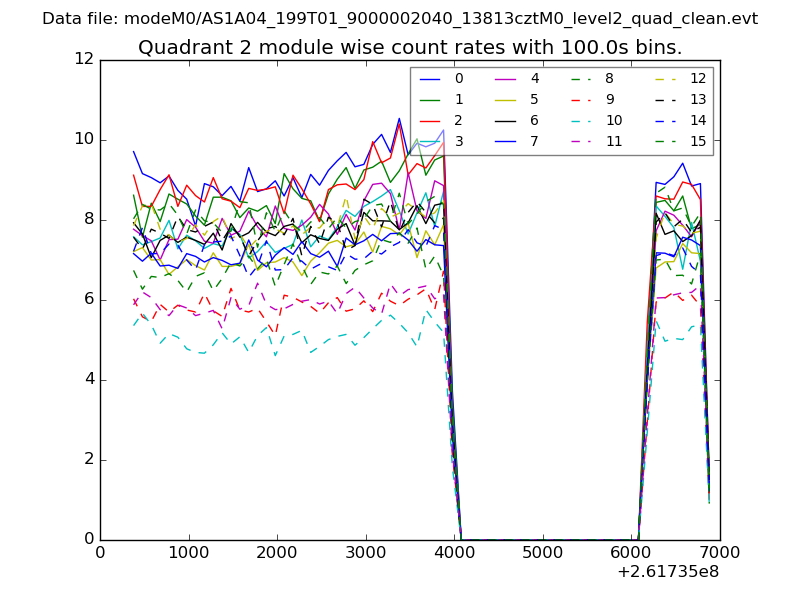 |
 |
| Module-wise count rates for Quadrant D Data is divided into 100 sec bins |
 |
 |
| Parameter | Plot |
|---|---|
| CZT HV Monitor | 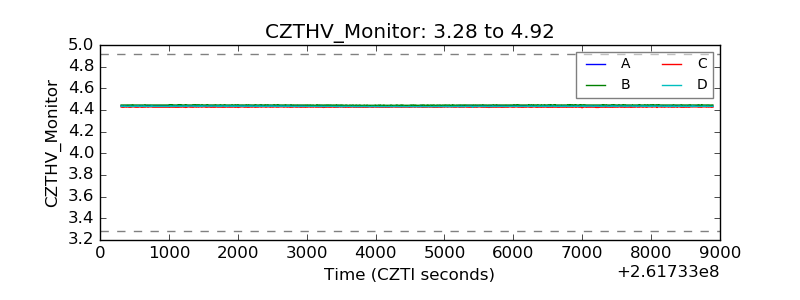 |
| D_VDD | 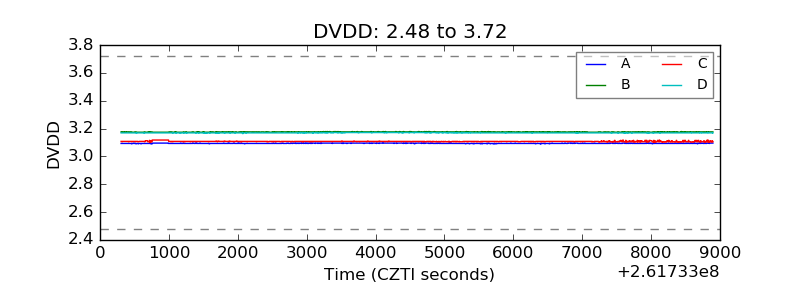 |
| Temperature 1 | 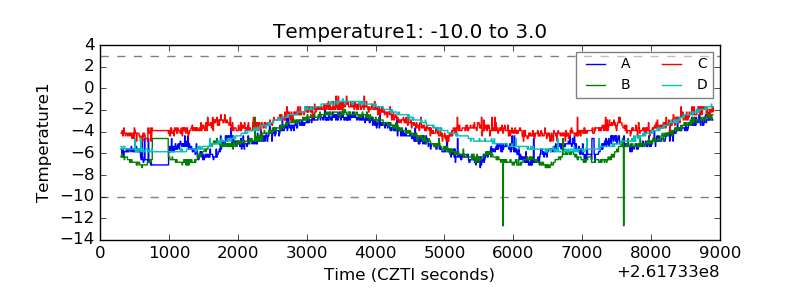 |
| Veto HV Monitor | 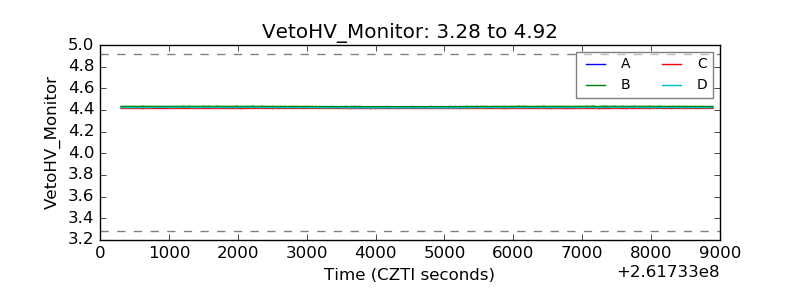 |
| Veto LLD | 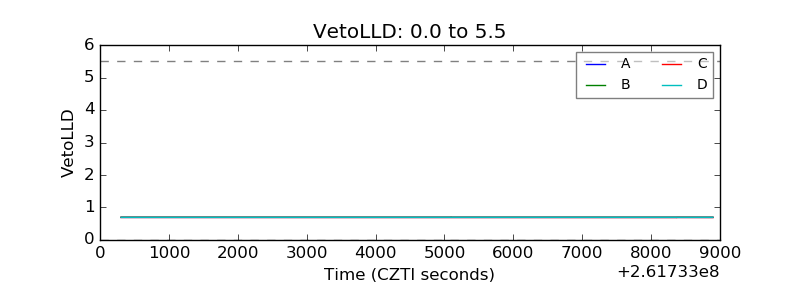 |
| Alpha Counter | 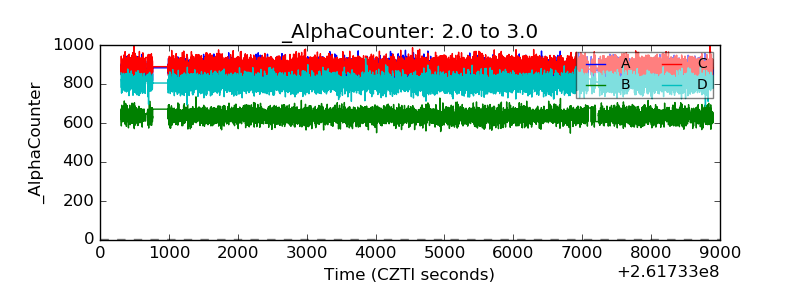 |
| _CPM_Rate | 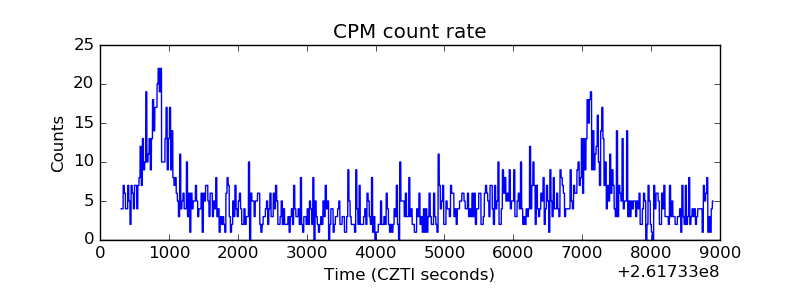 |
| CZT Counter |  |
| +2.5 Volts monitor |  |
| +5 Volts monitor |  |
| _ROLL_ROT | 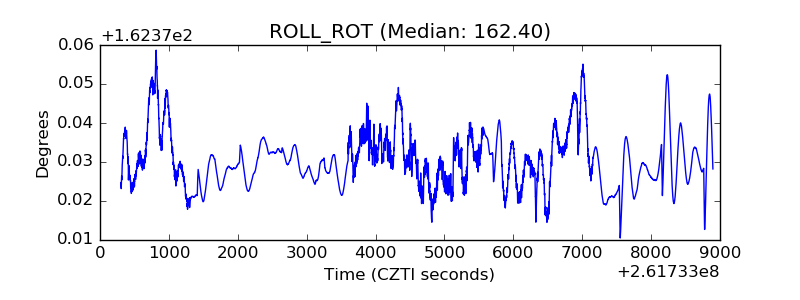 |
| _Roll_DEC | 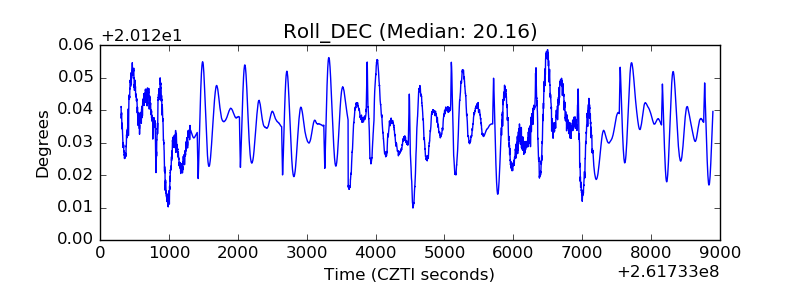 |
| _Roll_RA | 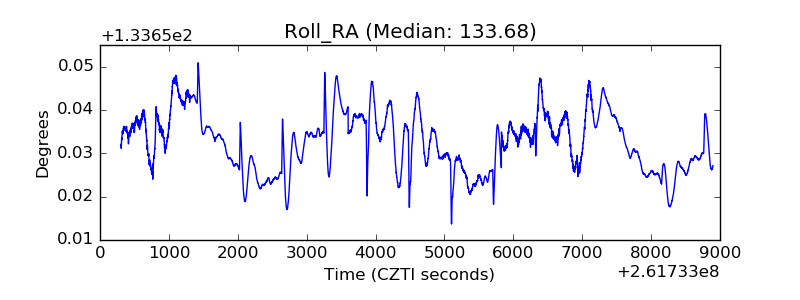 |
| Veto Counter | 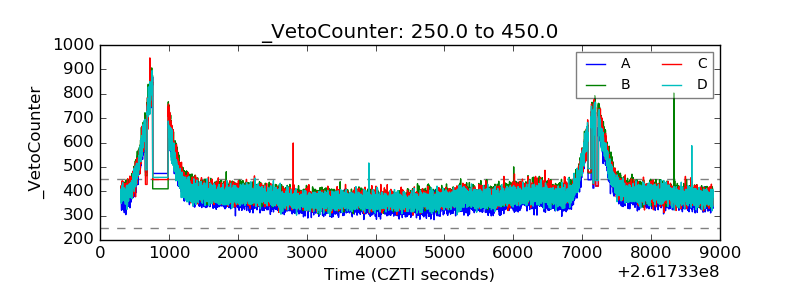 |