| Param | Original file | Final file |
|---|---|---|
| Filename | modeM0/AS1A04_199T01_9000002040_13814cztM0_level2.evt | modeM0/AS1A04_199T01_9000002040_13814cztM0_level2_quad_clean.evt |
| Size (bytes) | 578,646,720 | 94,521,600 |
| Size | 551.8 MB | 90.1 MB |
| Events in quadrant A | 3,894,938 | 580,853 |
| Events in quadrant B | 4,028,764 | 590,322 |
| Events in quadrant C | 3,994,301 | 577,215 |
| Events in quadrant D | 5,054,858 | 549,539 |
| Mode M9 | |||
|---|---|---|---|
| Quadrant | BADHDUFLAG | Total packets | Discarded packets |
| A | 0 | 4 | 0 |
| B | 0 | 4 | 0 |
| C | 0 | 4 | 0 |
| D | 0 | 4 | 0 |
| Mode SS | |||
|---|---|---|---|
| Quadrant | BADHDUFLAG | Total packets | Discarded packets |
| A | 0 | 168 | 0 |
| B | 0 | 168 | 0 |
| C | 0 | 168 | 0 |
| D | 0 | 168 | 0 |
| Mode M0 | |||
|---|---|---|---|
| Quadrant | BADHDUFLAG | Total packets | Discarded packets |
| A | 0 | 16971 | 5 |
| B | 0 | 17209 | 4 |
| C | 0 | 17044 | 4 |
| D | 0 | 20258 | 4 |
| Quadrant | Total seconds | Saturated seconds | Saturation percentage |
|---|---|---|---|
| A | 8116 | 352 | 4.337112% |
| B | 8116 | 365 | 4.497289% |
| C | 8116 | 247 | 3.043371% |
| D | 8116 | 317 | 3.905865% |
Noise dominated data is calculated using 1-second bins in cleaned event files. If a bin has >2000 counts, and if more than 50% of those come from <1% of pixels, then it is considered to be noise-dominated and hence unusable.
| Quadrant | # 1 sec bins | Bins with >0 counts | Bins with >2000 counts | High rate bins dominated by noise | Noise dominated (total time) | Noise dominated (detector-on time) | Marked lightcurve |
|---|---|---|---|---|---|---|---|
| A | 8527 | 8119 | 0 | 0 | 0.00% | 0.00% |  |
| B | 8527 | 8119 | 6 | 6 | 0.07% | 0.07% |  |
| C | 8527 | 8121 | 0 | 0 | 0.00% | 0.00% |  |
| D | 8527 | 8119 | 32 | 32 | 0.38% | 0.39% |  |
Top three noisy pixels from each quadrant. If the there are fewer than three noisy pixels in the level2.evt file, extra rows are filled as -1
| Pixel properties | Quadrant properties | ||||||
|---|---|---|---|---|---|---|---|
| Quadrant | DetID | PixID | Counts | Sigma | Mean | Median | Sigma |
| A | 1 | 162 | 16456 | 74.49 | 1003 | 974 | 207.8 |
| A | 8 | 15 | 12717 | 56.5 | 1003 | 974 | 207.8 |
| A | 0 | 226 | 9142 | 39.3 | 1003 | 974 | 207.8 |
| B | 4 | 80 | 51355 | 261.86 | 997 | 967 | 192.4 |
| B | 0 | 214 | 30389 | 152.9 | 997 | 967 | 192.4 |
| B | 4 | 173 | 28919 | 145.26 | 997 | 967 | 192.4 |
| C | 3 | 233 | 154611 | 670.13 | 979 | 981 | 229.3 |
| C | 8 | 128 | 13553 | 54.84 | 979 | 981 | 229.3 |
| C | 13 | 61 | 6849 | 25.6 | 979 | 981 | 229.3 |
| D | 1 | 52 | 443095 | 1859.82 | 973 | 942 | 237.7 |
| D | 10 | 157 | 384041 | 1611.42 | 973 | 942 | 237.7 |
| D | 8 | 195 | 188403 | 788.51 | 973 | 942 | 237.7 |
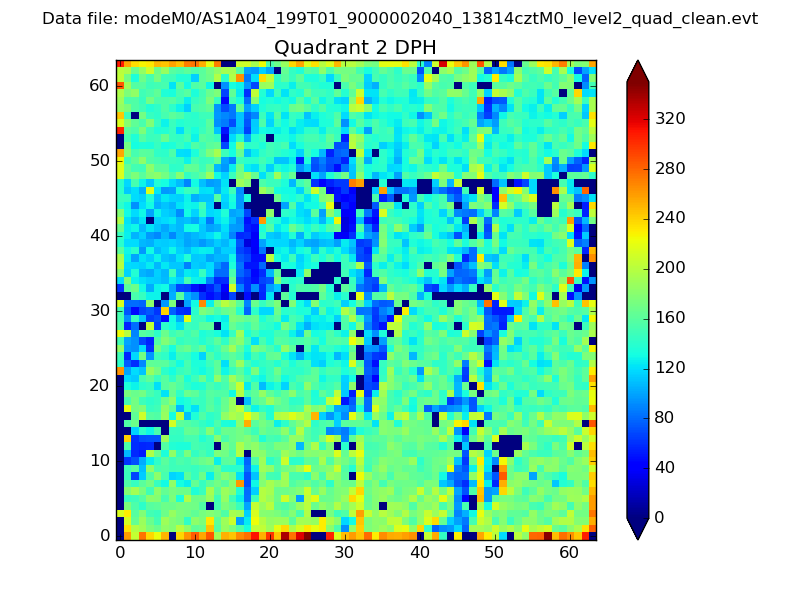
Histogram calculated using DETX and DETY for each event in the final _common_clean file
| Quadrant A | 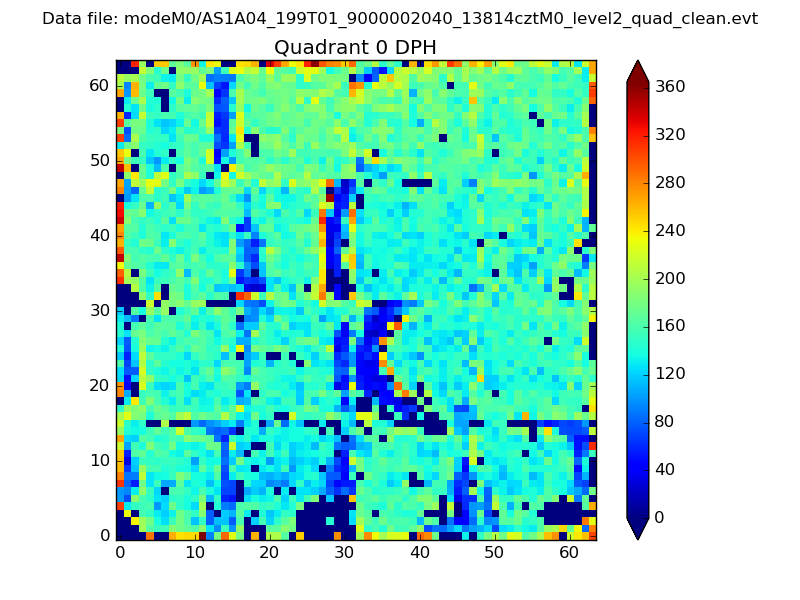 |
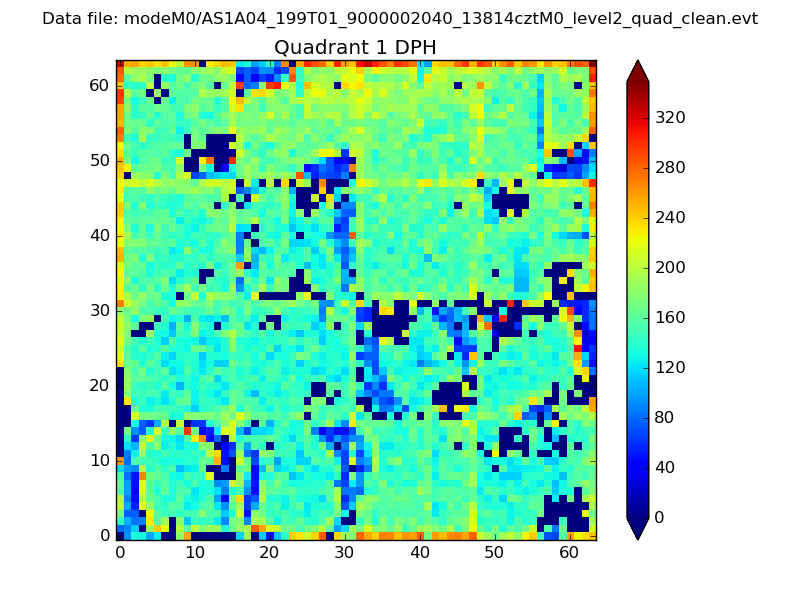 |
Quadrant B |
|---|---|---|---|
| Quadrant D | 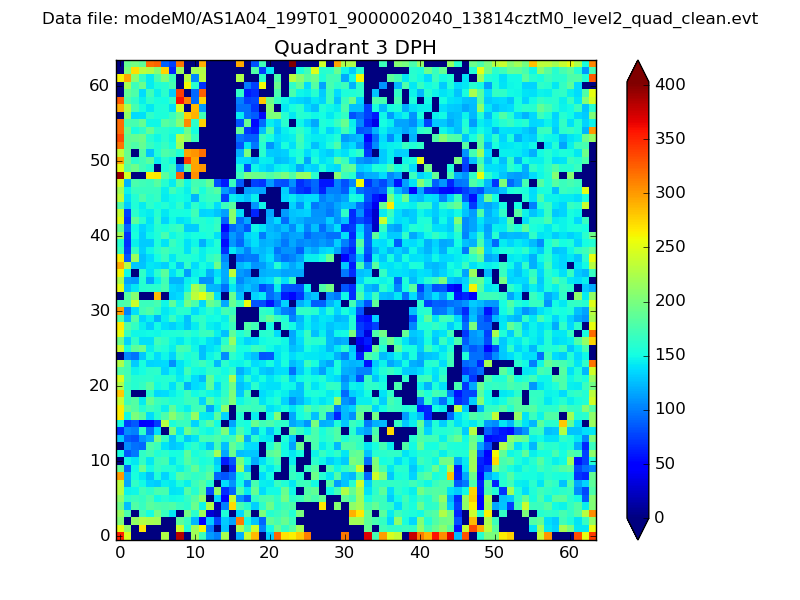 |
 |
Quadrant C |
| Plot type | Count rate plots | Images |
|---|---|---|
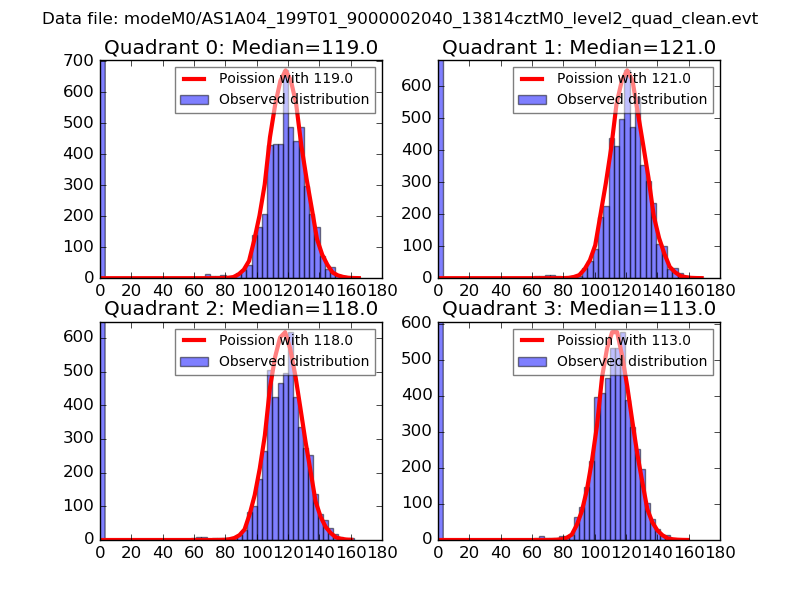
| Comparison with Poisson distribution Blue bars denote a histogram of data divided into 1 sec bins. Red curve is a Poisson curve with rate = median count rate of data. |
 |
 |
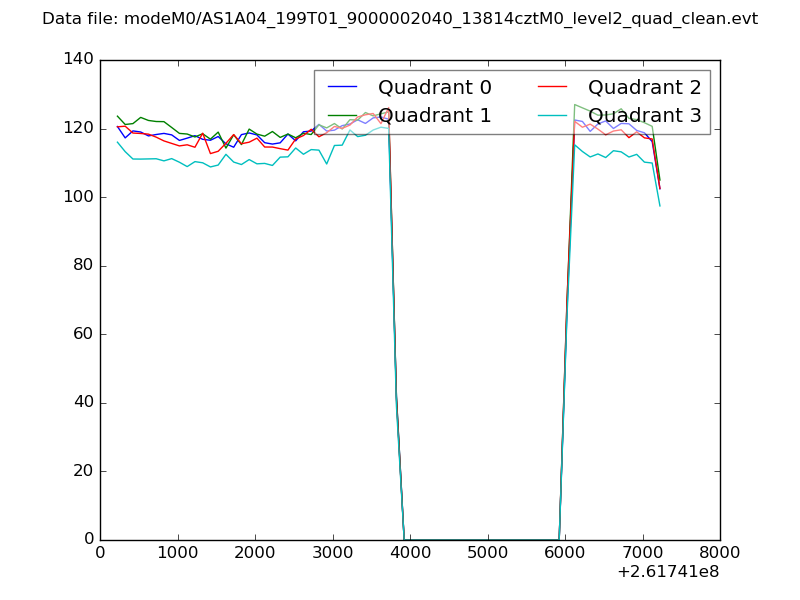
| Quadrant-wise count rates Data is divided into 100 sec bins |
 |
|
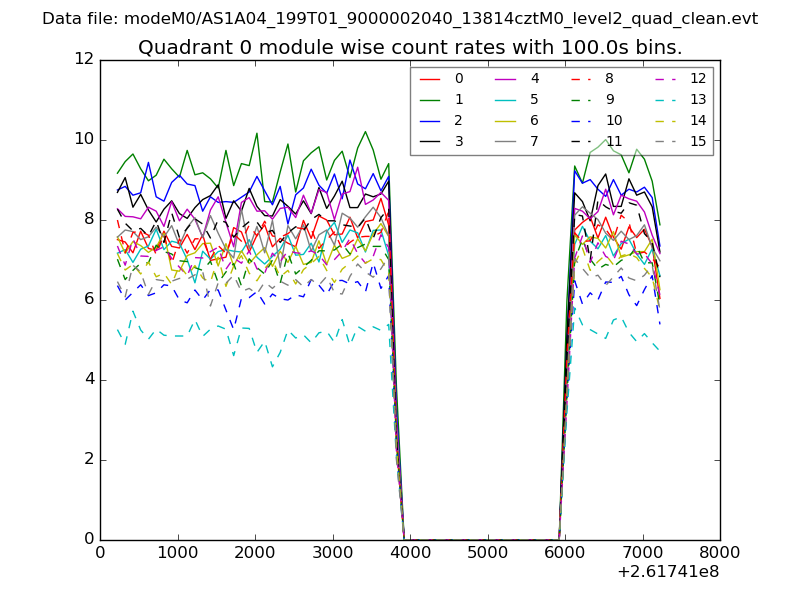
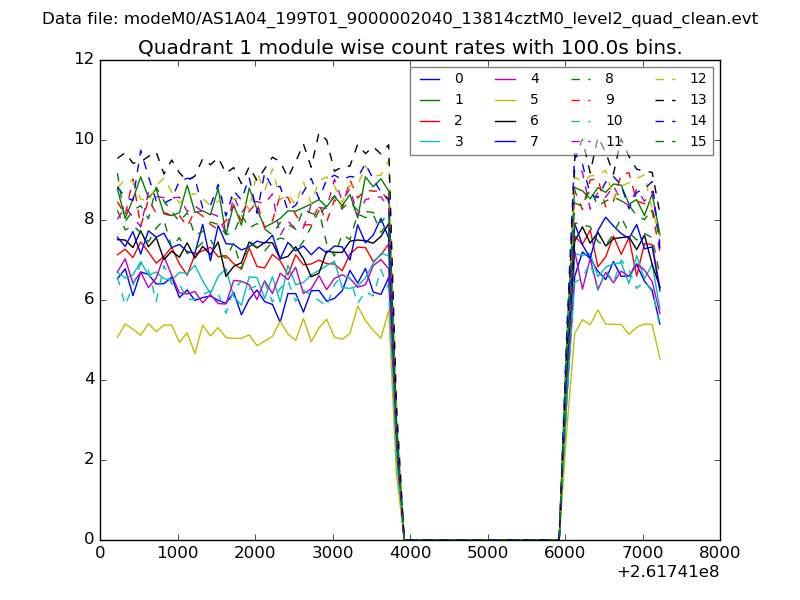
| Module-wise count rates for Quadrant A Data is divided into 100 sec bins |
 |
 |
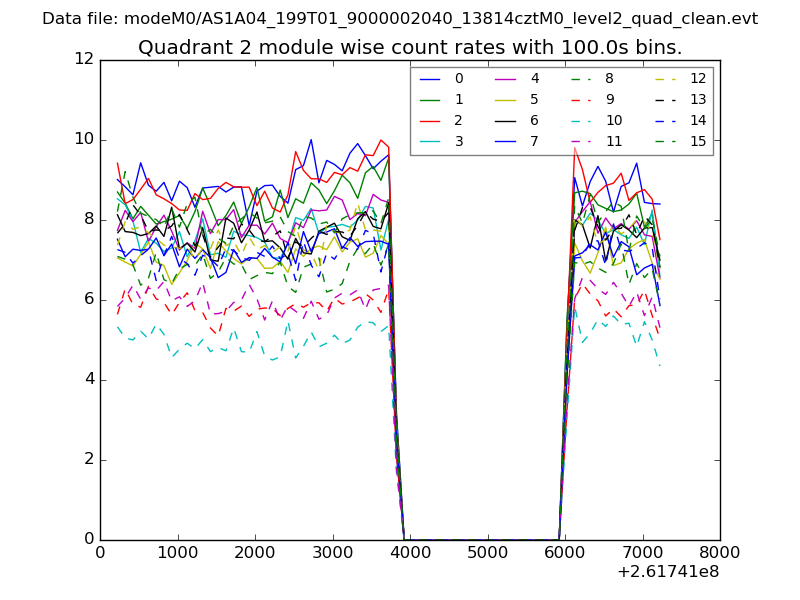
| Module-wise count rates for Quadrant B Data is divided into 100 sec bins |
 |
 |
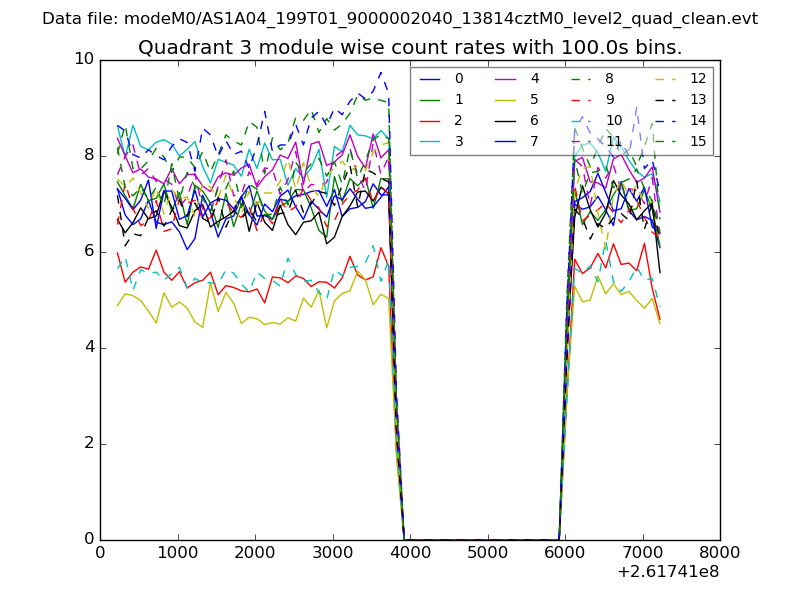
| Module-wise count rates for Quadrant C Data is divided into 100 sec bins |
 |
 |
| Module-wise count rates for Quadrant D Data is divided into 100 sec bins |
 |
 |
| Parameter | Plot |
|---|---|
| CZT HV Monitor | 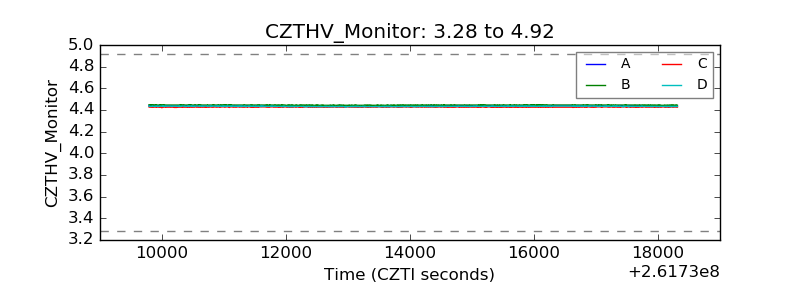 |
| D_VDD | 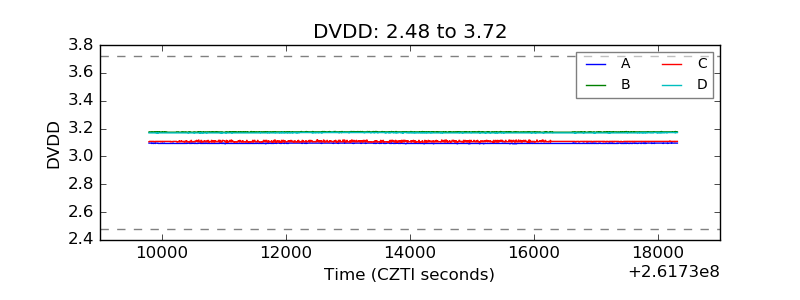 |
| Temperature 1 | 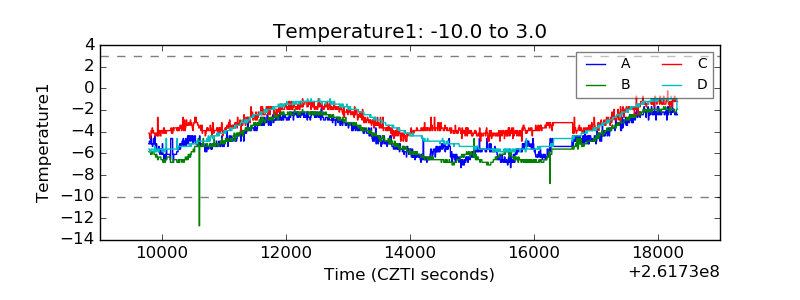 |
| Veto HV Monitor | 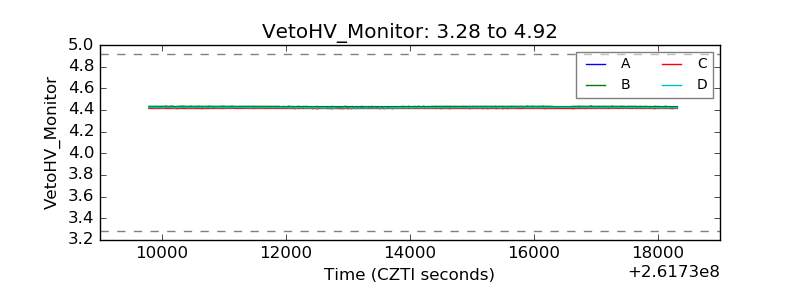 |
| Veto LLD | 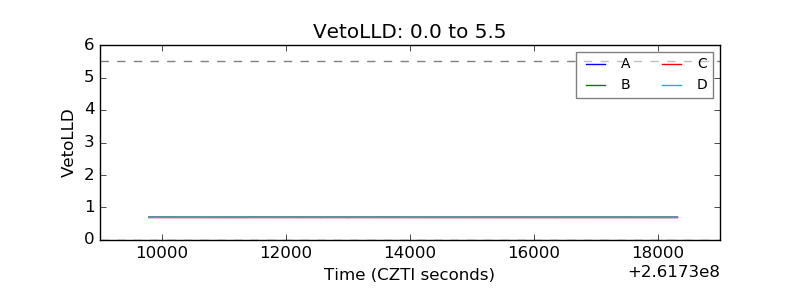 |
| Alpha Counter | 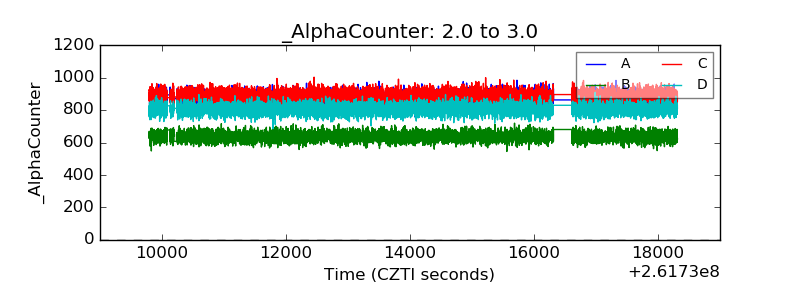 |
| _CPM_Rate | 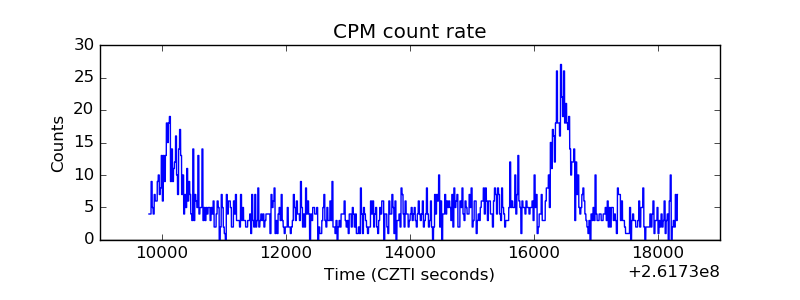 |
| CZT Counter | 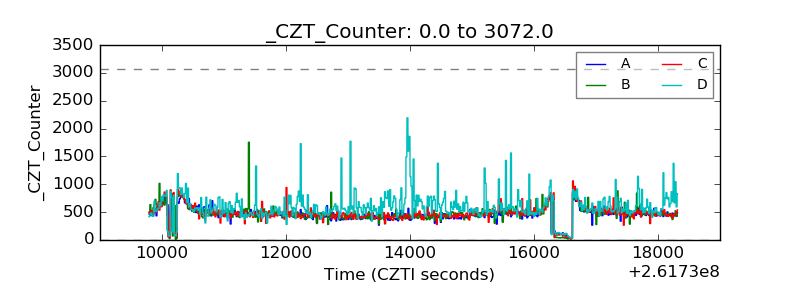 |
| +2.5 Volts monitor |  |
| +5 Volts monitor |  |
| _ROLL_ROT | 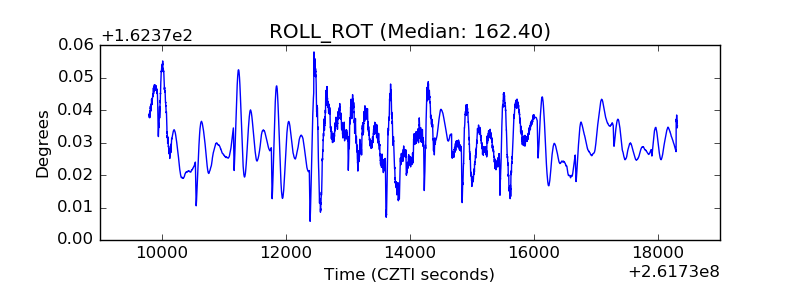 |
| _Roll_DEC | 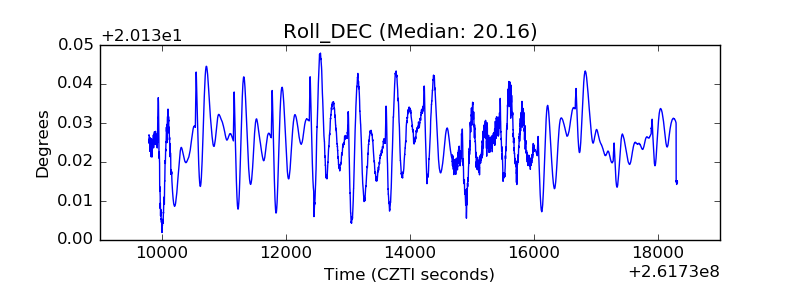 |
| _Roll_RA | 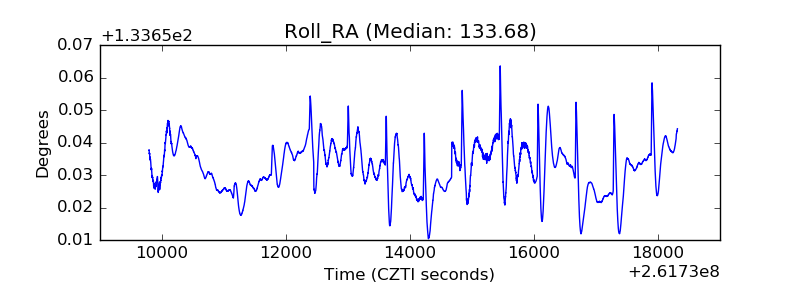 |
| Veto Counter | 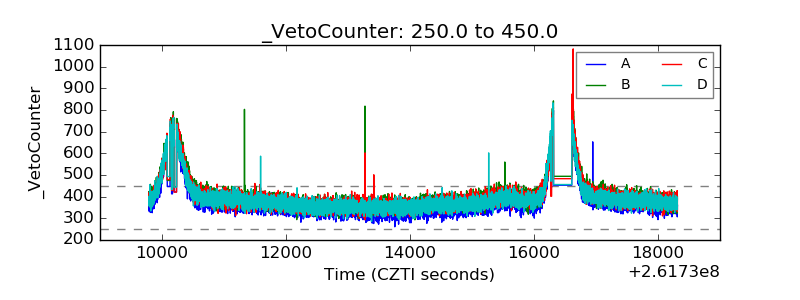 |