| Param | Original file | Final file |
|---|---|---|
| Filename | modeM0/AS1A04_199T01_9000002040_13816cztM0_level2.evt | modeM0/AS1A04_199T01_9000002040_13816cztM0_level2_quad_clean.evt |
| Size (bytes) | 1,036,630,080 | 166,043,520 |
| Size | 988.6 MB | 158.4 MB |
| Events in quadrant A | 6,112,577 | 1,054,066 |
| Events in quadrant B | 6,341,254 | 1,064,314 |
| Events in quadrant C | 6,204,917 | 1,046,136 |
| Events in quadrant D | 11,856,548 | 964,998 |
| Mode M9 | |||
|---|---|---|---|
| Quadrant | BADHDUFLAG | Total packets | Discarded packets |
| A | 0 | 12 | 0 |
| B | 0 | 12 | 0 |
| C | 0 | 12 | 0 |
| D | 0 | 13 | 0 |
| Mode SS | |||
|---|---|---|---|
| Quadrant | BADHDUFLAG | Total packets | Discarded packets |
| A | 0 | 262 | 0 |
| B | 0 | 262 | 0 |
| C | 0 | 262 | 0 |
| D | 0 | 262 | 0 |
| Mode M0 | |||
|---|---|---|---|
| Quadrant | BADHDUFLAG | Total packets | Discarded packets |
| A | 0 | 26829 | 4 |
| B | 0 | 27422 | 3 |
| C | 0 | 26911 | 3 |
| D | 0 | 44338 | 3 |
| Quadrant | Total seconds | Saturated seconds | Saturation percentage |
|---|---|---|---|
| A | 13021 | 215 | 1.651179% |
| B | 13021 | 243 | 1.866216% |
| C | 13021 | 159 | 1.221104% |
| D | 13021 | 908 | 6.973351% |
Noise dominated data is calculated using 1-second bins in cleaned event files. If a bin has >2000 counts, and if more than 50% of those come from <1% of pixels, then it is considered to be noise-dominated and hence unusable.
| Quadrant | # 1 sec bins | Bins with >0 counts | Bins with >2000 counts | High rate bins dominated by noise | Noise dominated (total time) | Noise dominated (detector-on time) | Marked lightcurve |
|---|---|---|---|---|---|---|---|
| A | 14177 | 13022 | 0 | 0 | 0.00% | 0.00% | 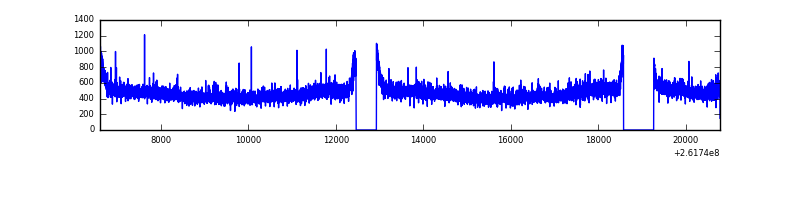 |
| B | 14177 | 13022 | 16 | 16 | 0.11% | 0.12% | 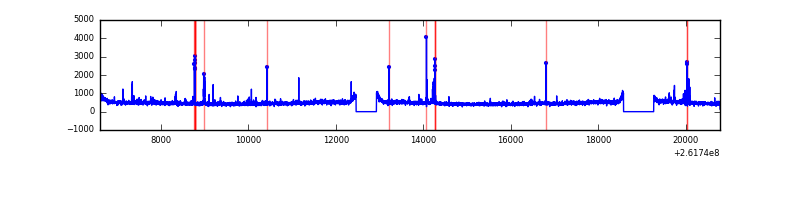 |
| C | 14177 | 13023 | 6 | 6 | 0.04% | 0.05% |  |
| D | 14177 | 13022 | 532 | 532 | 3.75% | 4.09% | 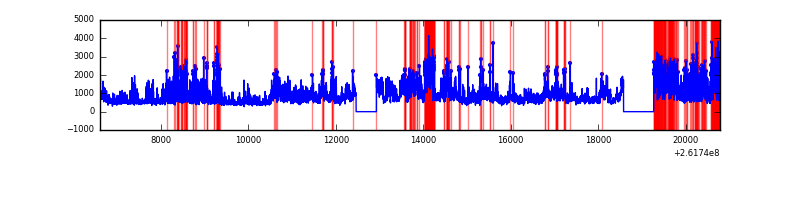 |
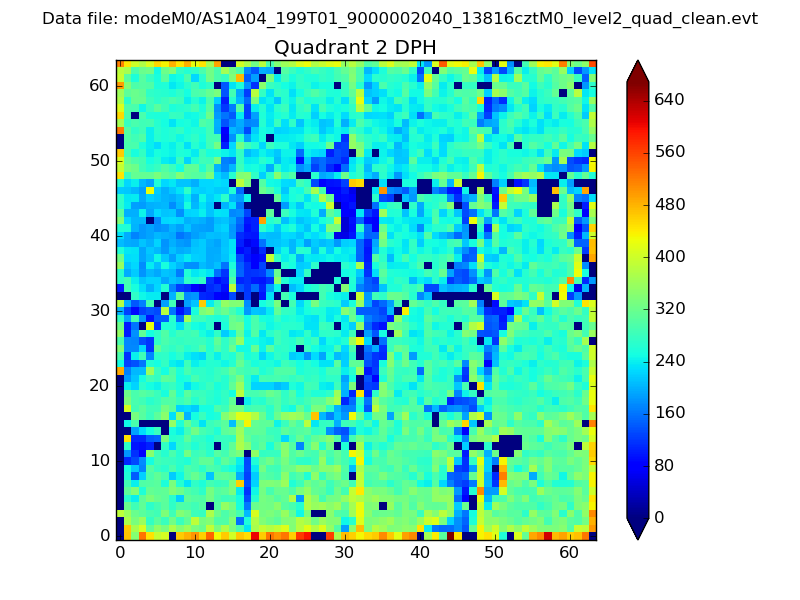
Top three noisy pixels from each quadrant. If the there are fewer than three noisy pixels in the level2.evt file, extra rows are filled as -1
| Pixel properties | Quadrant properties | ||||||
|---|---|---|---|---|---|---|---|
| Quadrant | DetID | PixID | Counts | Sigma | Mean | Median | Sigma |
| A | 1 | 162 | 36422 | 109.14 | 1562 | 1523 | 319.8 |
| A | 8 | 15 | 29838 | 88.55 | 1562 | 1523 | 319.8 |
| A | 0 | 226 | 14643 | 41.03 | 1562 | 1523 | 319.8 |
| B | 10 | 252 | 97812 | 321.19 | 1559 | 1517 | 299.8 |
| B | 0 | 219 | 61120 | 198.81 | 1559 | 1517 | 299.8 |
| B | 4 | 173 | 45613 | 147.08 | 1559 | 1517 | 299.8 |
| C | 3 | 233 | 223744 | 624.73 | 1522 | 1524 | 355.7 |
| C | 6 | 253 | 19508 | 50.56 | 1522 | 1524 | 355.7 |
| C | 0 | 207 | 11523 | 28.11 | 1522 | 1524 | 355.7 |
| D | 1 | 52 | 2414834 | 6676.85 | 1487 | 1441 | 361.5 |
| D | 13 | 122 | 982901 | 2715.29 | 1487 | 1441 | 361.5 |
| D | 12 | 110 | 955744 | 2640.16 | 1487 | 1441 | 361.5 |
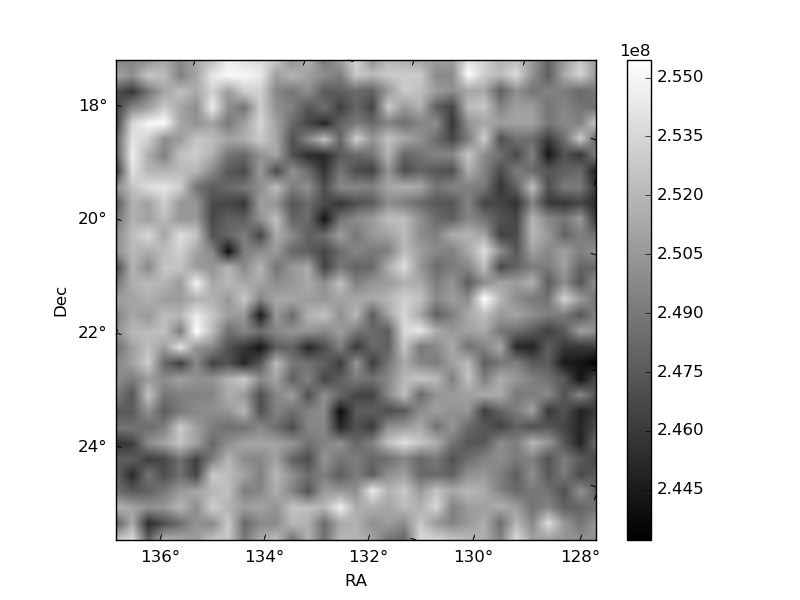
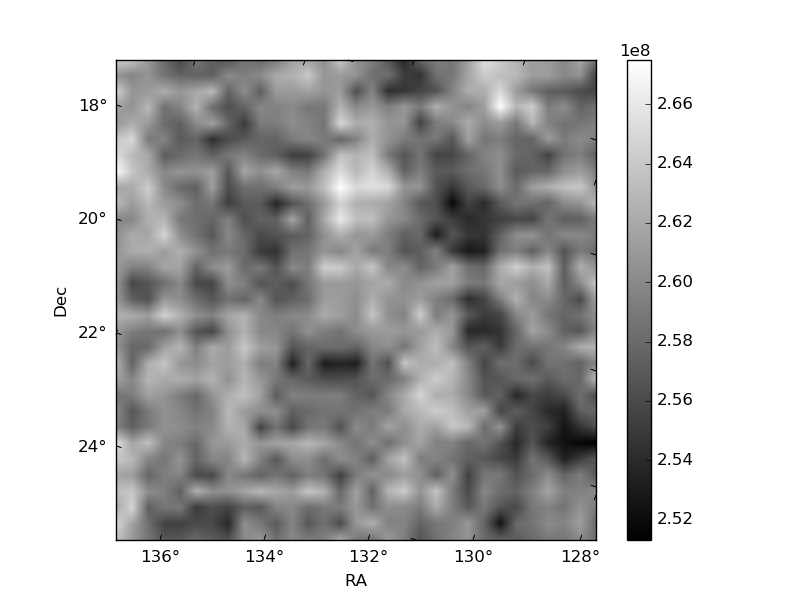
Histogram calculated using DETX and DETY for each event in the final _common_clean file
| Quadrant A |  |
 |
Quadrant B |
|---|---|---|---|
| Quadrant D |  |
 |
Quadrant C |
| Plot type | Count rate plots | Images |
|---|---|---|
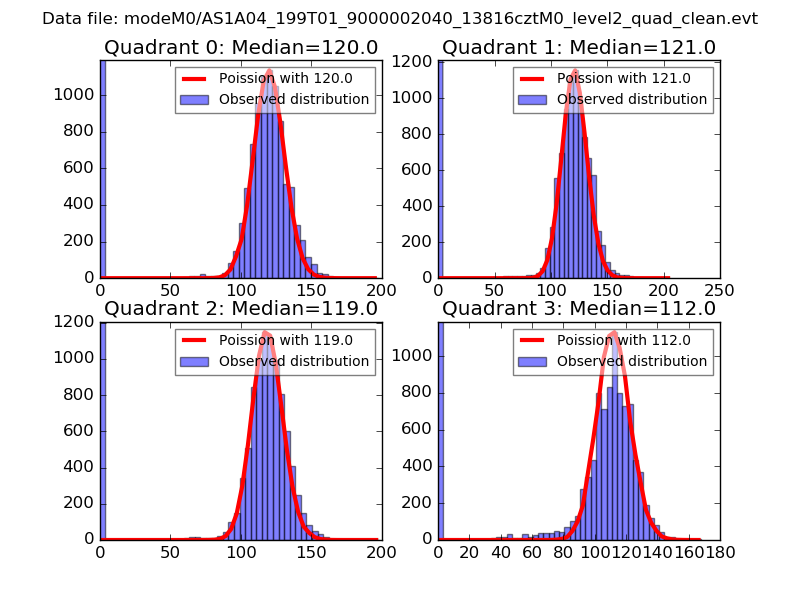
| Comparison with Poisson distribution Blue bars denote a histogram of data divided into 1 sec bins. Red curve is a Poisson curve with rate = median count rate of data. |
 |
 |
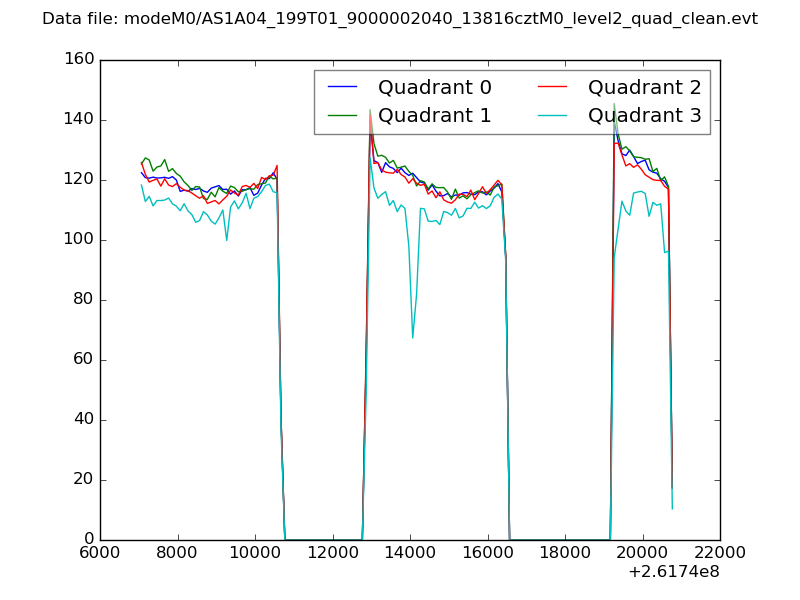
| Quadrant-wise count rates Data is divided into 100 sec bins |
 |
|
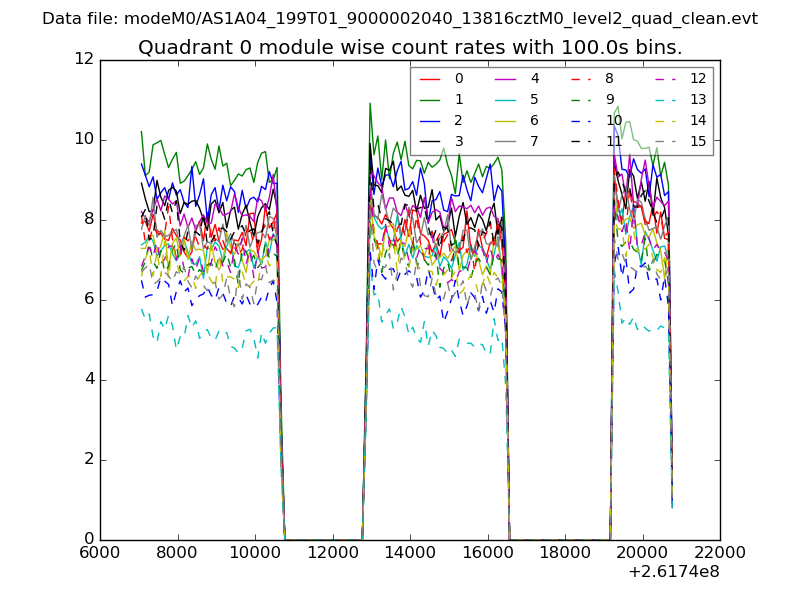
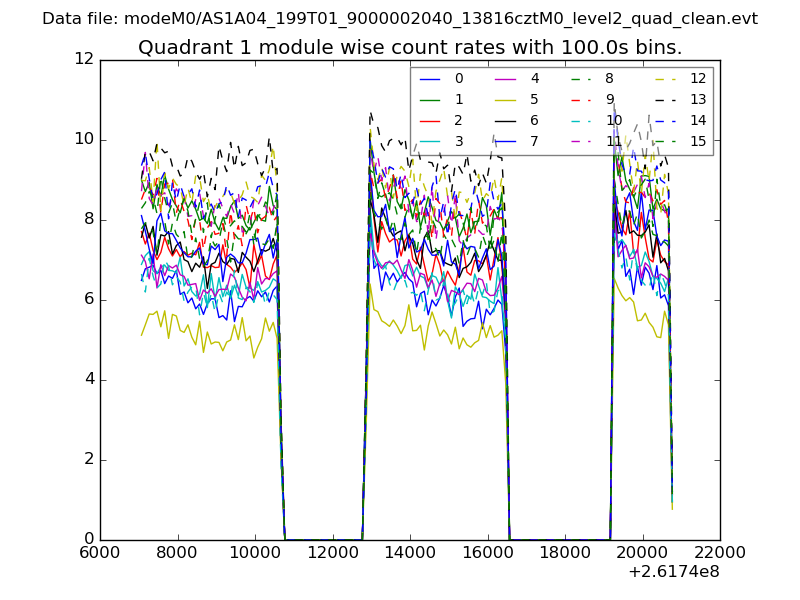
| Module-wise count rates for Quadrant A Data is divided into 100 sec bins |
 |
 |
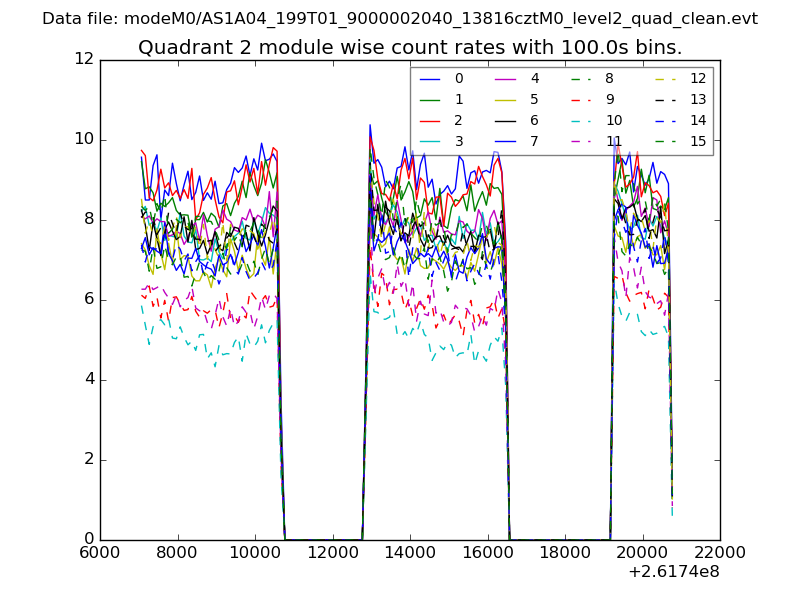
| Module-wise count rates for Quadrant B Data is divided into 100 sec bins |
 |
 |
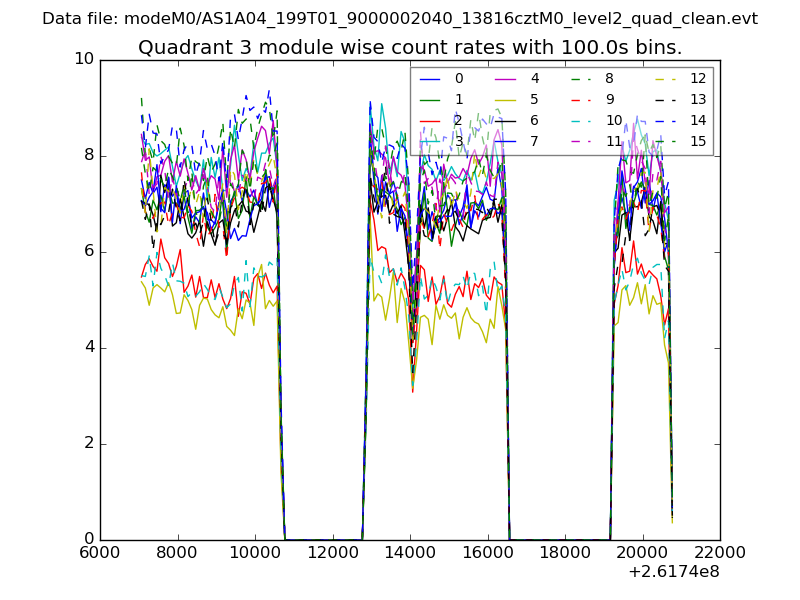
| Module-wise count rates for Quadrant C Data is divided into 100 sec bins |
 |
 |
| Module-wise count rates for Quadrant D Data is divided into 100 sec bins |
 |
 |
| Parameter | Plot |
|---|---|
| CZT HV Monitor | 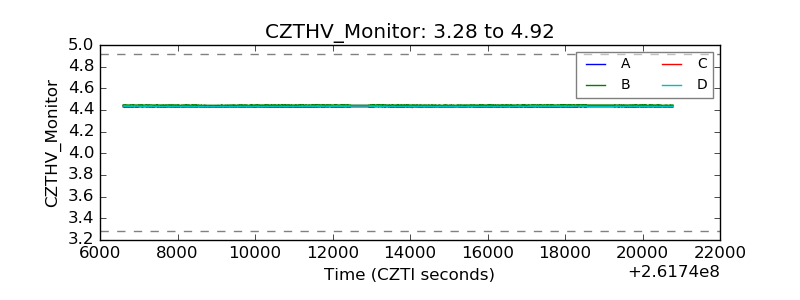 |
| D_VDD | 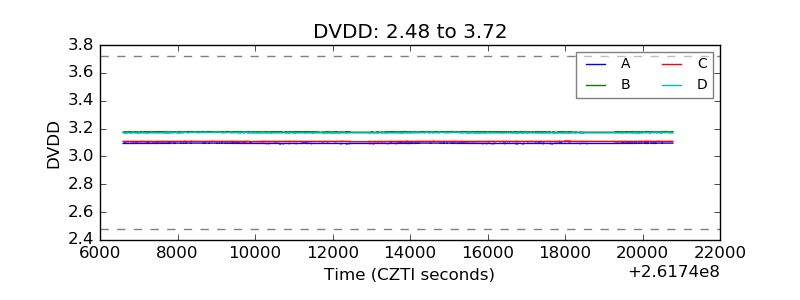 |
| Temperature 1 | 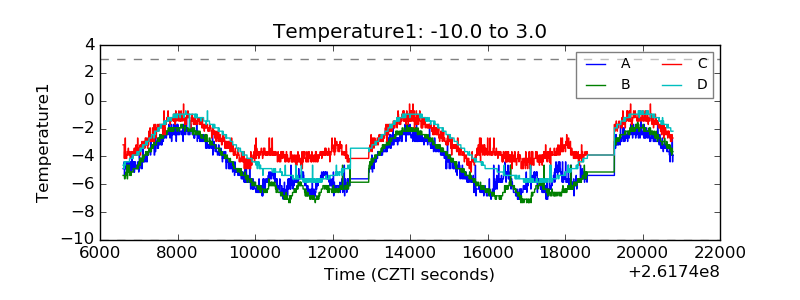 |
| Veto HV Monitor | 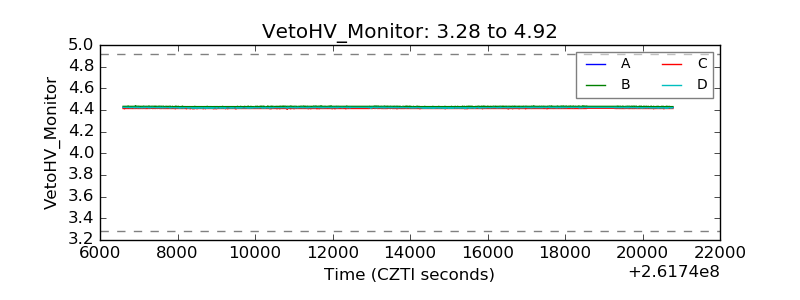 |
| Veto LLD | 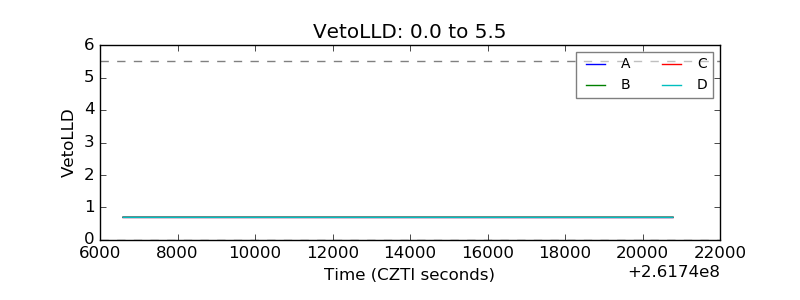 |
| Alpha Counter | 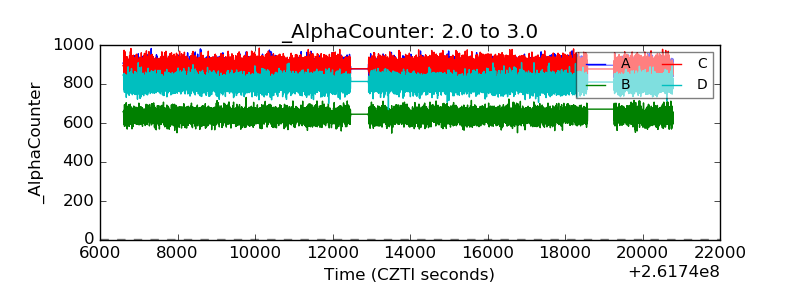 |
| _CPM_Rate | 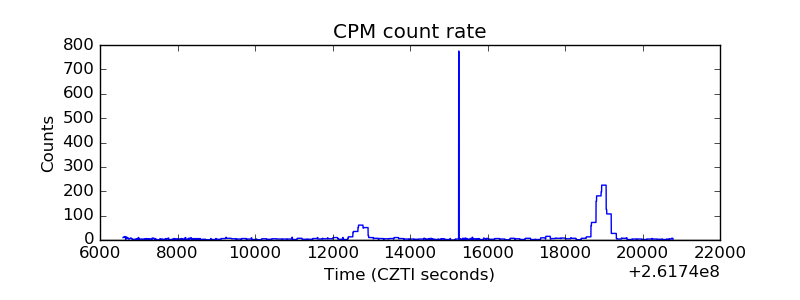 |
| CZT Counter | 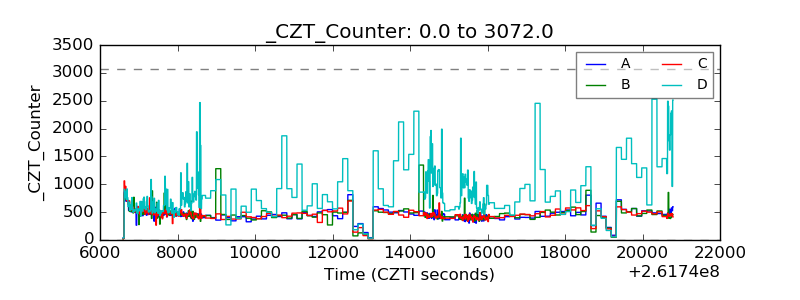 |
| +2.5 Volts monitor |  |
| +5 Volts monitor |  |
| _ROLL_ROT | 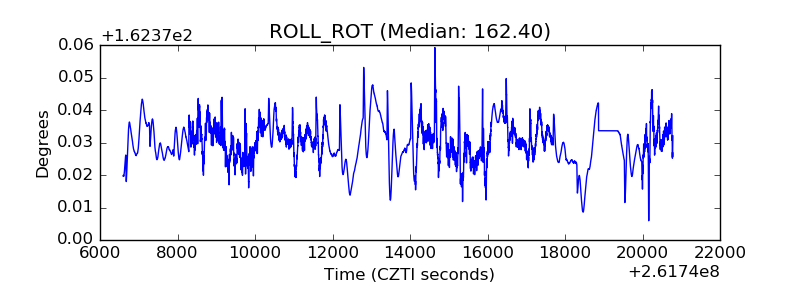 |
| _Roll_DEC | 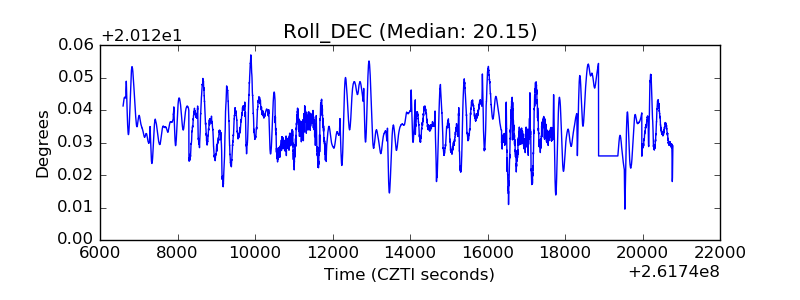 |
| _Roll_RA |  |
| Veto Counter | 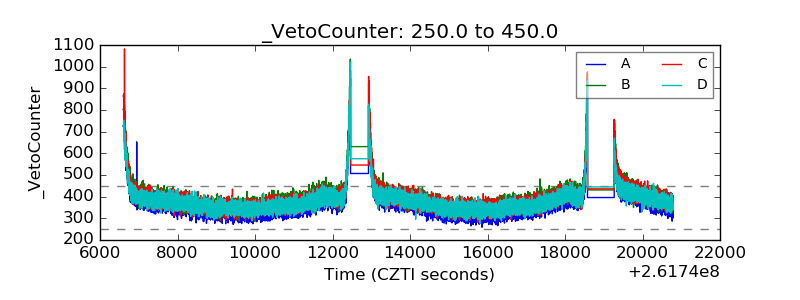 |