| Param | Original file | Final file |
|---|---|---|
| Filename | modeM0/AS1A04_199T01_9000002040_13817cztM0_level2.evt | modeM0/AS1A04_199T01_9000002040_13817cztM0_level2_quad_clean.evt |
| Size (bytes) | 3,055,129,920 | 481,999,680 |
| Size | 2.8 GB | 459.7 MB |
| Events in quadrant A | 18,354,336 | 3,047,551 |
| Events in quadrant B | 18,997,864 | 3,078,654 |
| Events in quadrant C | 18,508,069 | 3,019,876 |
| Events in quadrant D | 34,040,884 | 2,779,454 |
| Mode M9 | |||
|---|---|---|---|
| Quadrant | BADHDUFLAG | Total packets | Discarded packets |
| A | 0 | 32 | 0 |
| B | 0 | 32 | 0 |
| C | 0 | 32 | 0 |
| D | 0 | 32 | 0 |
| Mode SS | |||
|---|---|---|---|
| Quadrant | BADHDUFLAG | Total packets | Discarded packets |
| A | 0 | 794 | 0 |
| B | 0 | 794 | 0 |
| C | 0 | 794 | 0 |
| D | 0 | 794 | 0 |
| Mode M0 | |||
|---|---|---|---|
| Quadrant | BADHDUFLAG | Total packets | Discarded packets |
| A | 0 | 80295 | 11 |
| B | 0 | 81466 | 9 |
| C | 0 | 80241 | 9 |
| D | 0 | 127271 | 9 |
| Quadrant | Total seconds | Saturated seconds | Saturation percentage |
|---|---|---|---|
| A | 38911 | 872 | 2.241012% |
| B | 38911 | 939 | 2.413199% |
| C | 38911 | 624 | 1.603660% |
| D | 38911 | 3340 | 8.583691% |
Noise dominated data is calculated using 1-second bins in cleaned event files. If a bin has >2000 counts, and if more than 50% of those come from <1% of pixels, then it is considered to be noise-dominated and hence unusable.
| Quadrant | # 1 sec bins | Bins with >0 counts | Bins with >2000 counts | High rate bins dominated by noise | Noise dominated (total time) | Noise dominated (detector-on time) | Marked lightcurve |
|---|---|---|---|---|---|---|---|
| A | 51193 | 38916 | 1 | 1 | 0.00% | 0.00% | 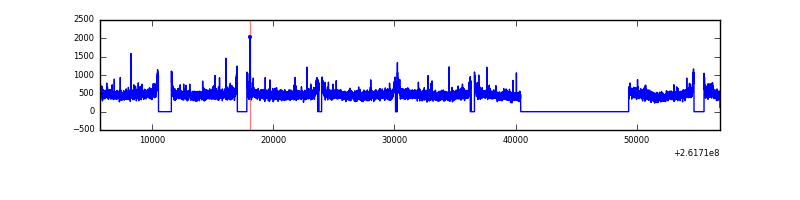 |
| B | 51193 | 38915 | 23 | 23 | 0.04% | 0.06% | 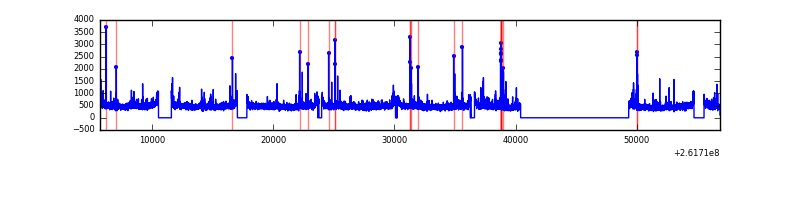 |
| C | 51193 | 38919 | 2 | 2 | 0.00% | 0.01% | 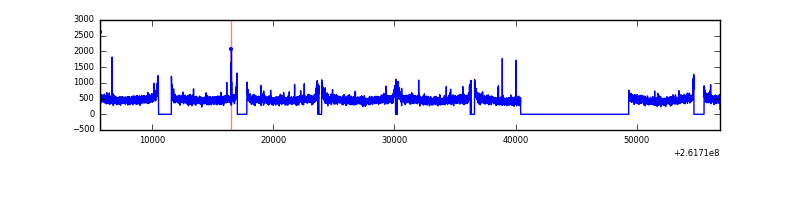 |
| D | 51193 | 38915 | 2669 | 2669 | 5.21% | 6.86% | 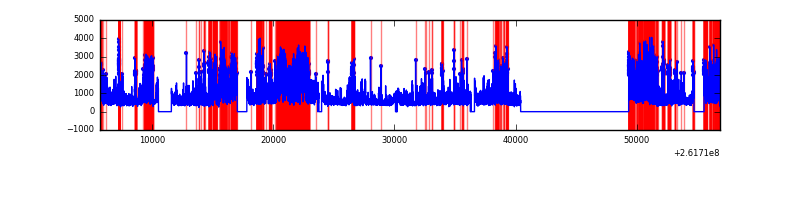 |
Top three noisy pixels from each quadrant. If the there are fewer than three noisy pixels in the level2.evt file, extra rows are filled as -1
| Pixel properties | Quadrant properties | ||||||
|---|---|---|---|---|---|---|---|
| Quadrant | DetID | PixID | Counts | Sigma | Mean | Median | Sigma |
| A | 8 | 15 | 98870 | 98.65 | 4707 | 4599 | 955.6 |
| A | 1 | 162 | 93101 | 92.62 | 4707 | 4599 | 955.6 |
| A | 0 | 226 | 43346 | 40.55 | 4707 | 4599 | 955.6 |
| B | 4 | 173 | 164941 | 178.15 | 4700 | 4579 | 900.2 |
| B | 12 | 111 | 105418 | 112.02 | 4700 | 4579 | 900.2 |
| B | 0 | 214 | 104301 | 110.78 | 4700 | 4579 | 900.2 |
| C | 3 | 233 | 598013 | 559.46 | 4579 | 4596 | 1060.7 |
| C | 13 | 61 | 32429 | 26.24 | 4579 | 4596 | 1060.7 |
| C | 0 | 207 | 23636 | 17.95 | 4579 | 4596 | 1060.7 |
| D | 1 | 52 | 11400014 | 10092.9 | 4455 | 4345 | 1129.1 |
| D | 10 | 157 | 1583415 | 1398.55 | 4455 | 4345 | 1129.1 |
| D | 5 | 222 | 1247491 | 1101.03 | 4455 | 4345 | 1129.1 |
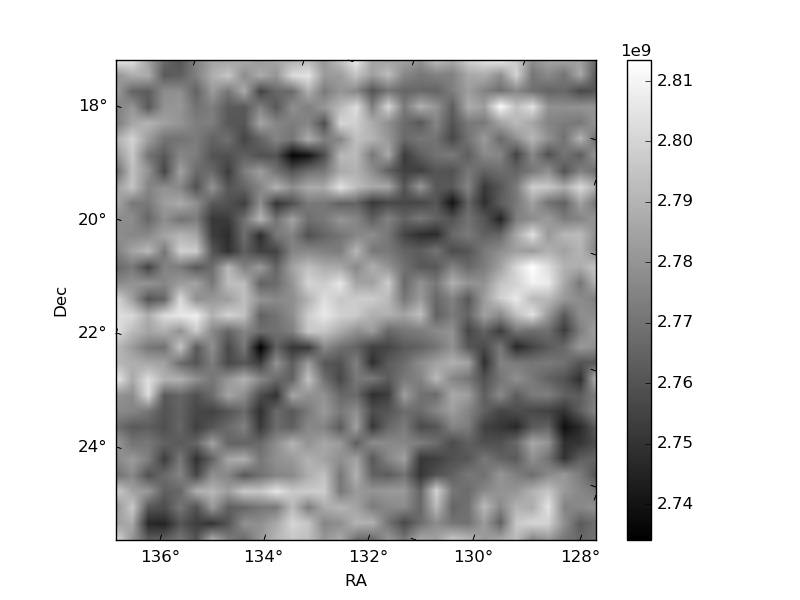
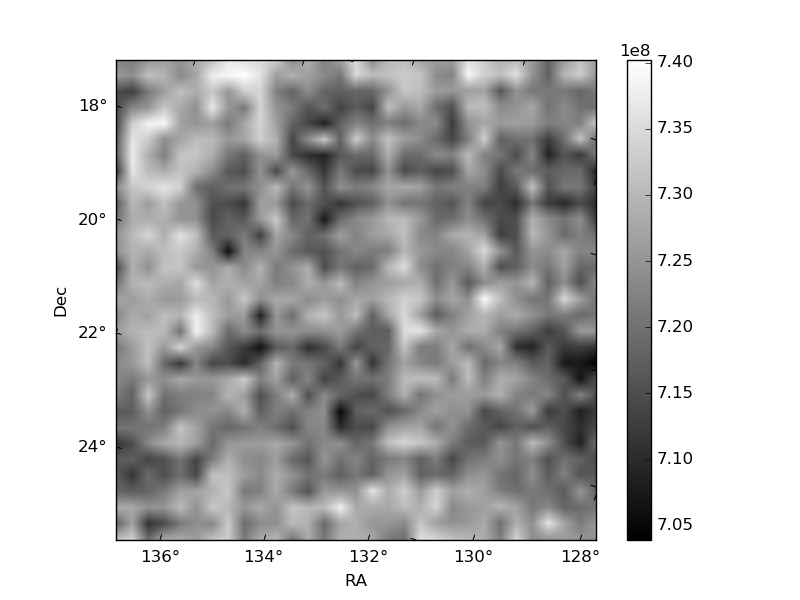
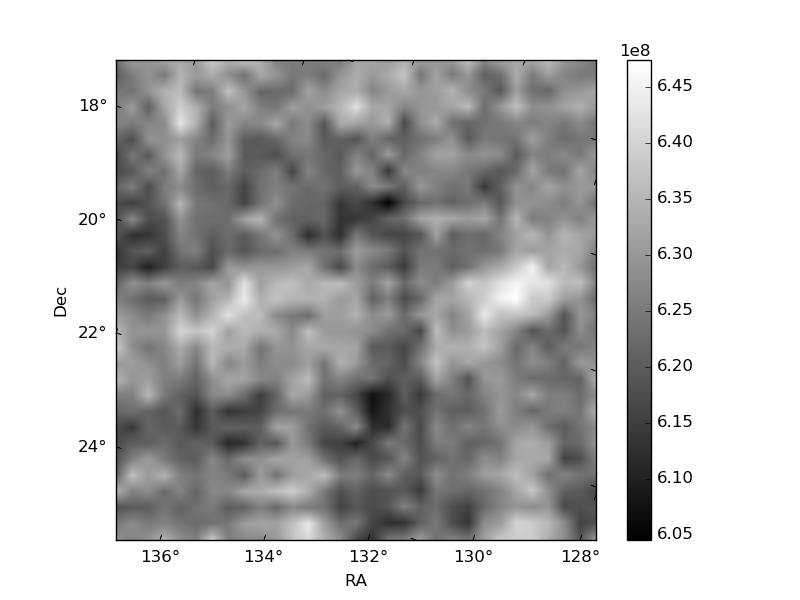
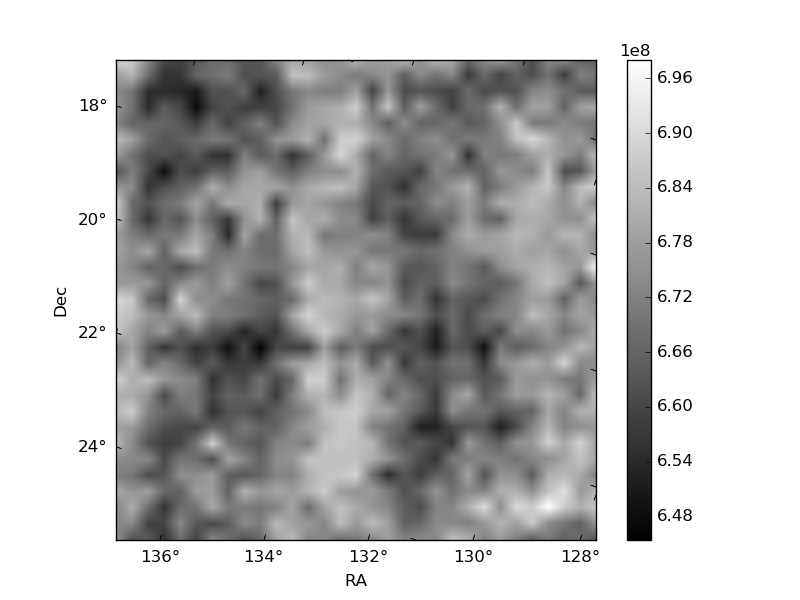
Histogram calculated using DETX and DETY for each event in the final _common_clean file
| Quadrant A | 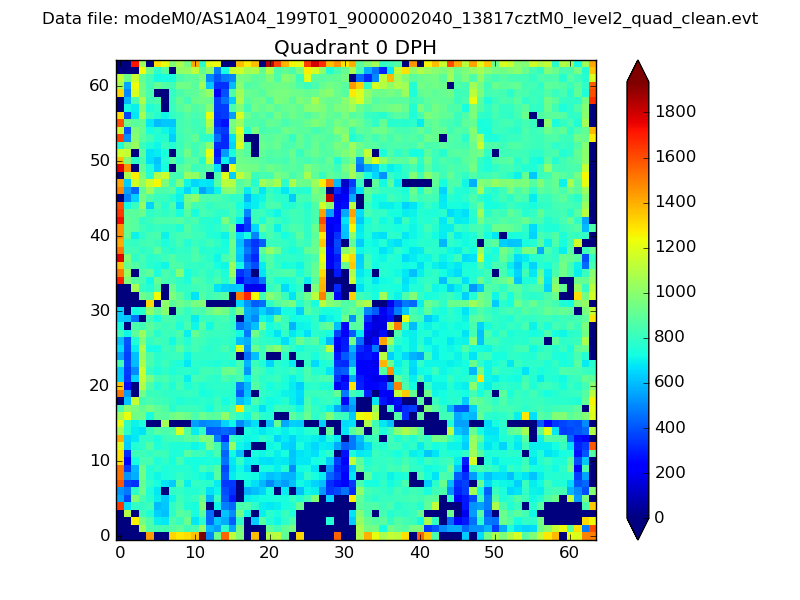 |
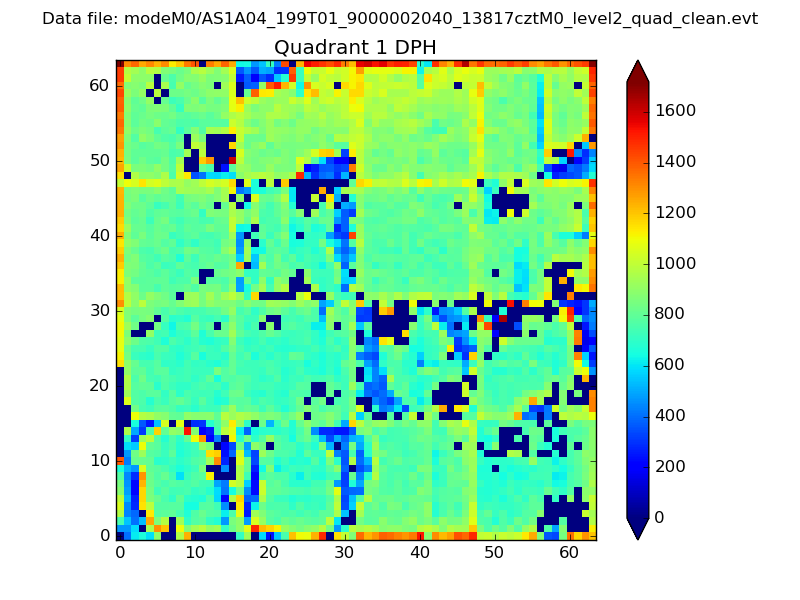 |
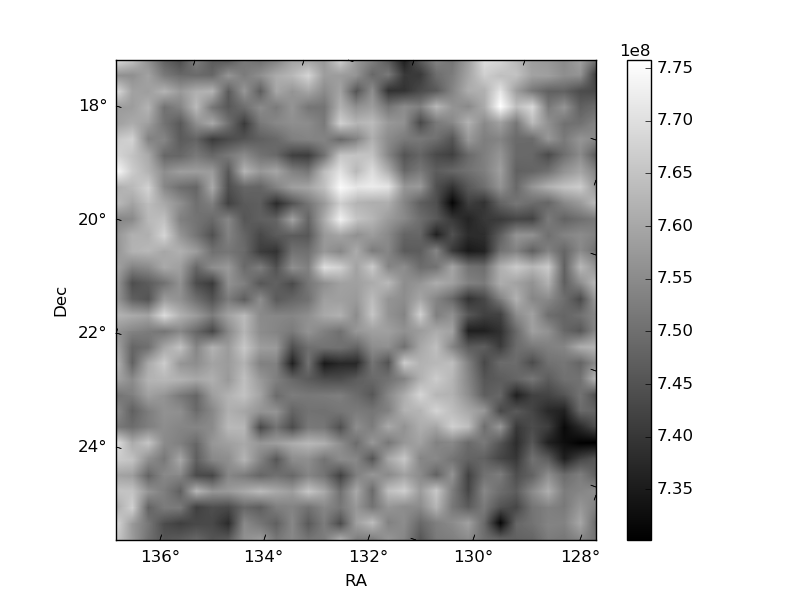
Quadrant B |
|---|---|---|---|
| Quadrant D | 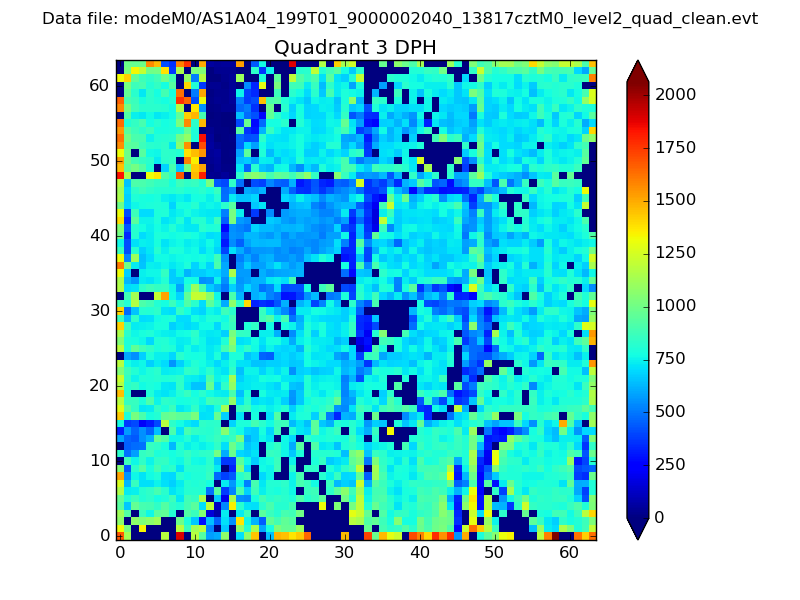 |
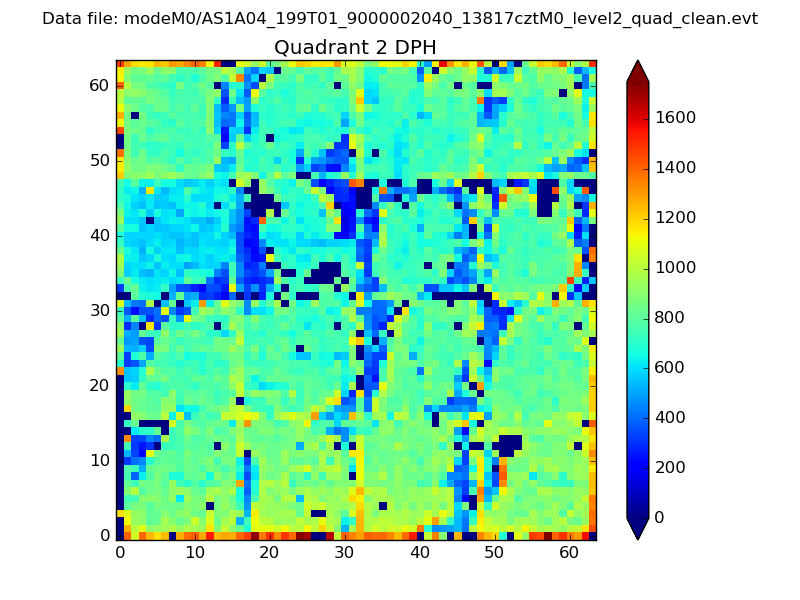 |
Quadrant C |
| Plot type | Count rate plots | Images |
|---|---|---|
| Comparison with Poisson distribution Blue bars denote a histogram of data divided into 1 sec bins. Red curve is a Poisson curve with rate = median count rate of data. |
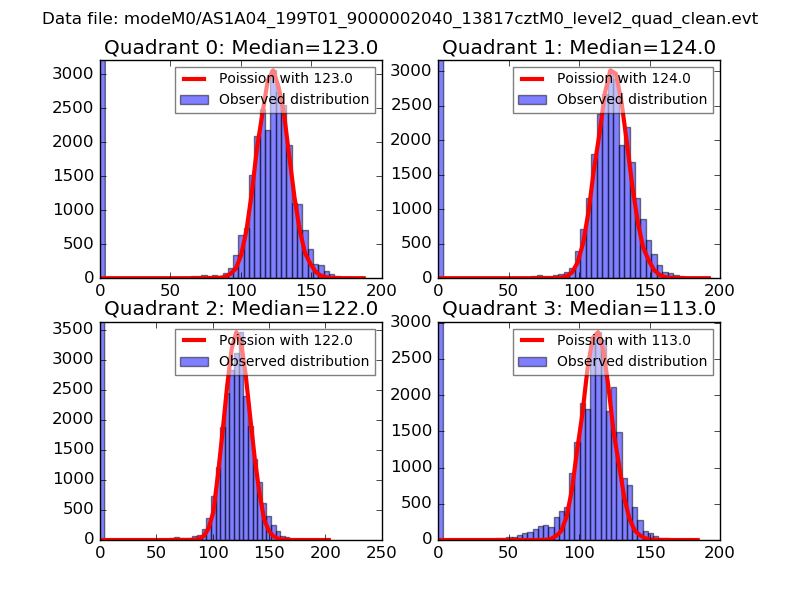 |
 |
| Quadrant-wise count rates Data is divided into 100 sec bins |
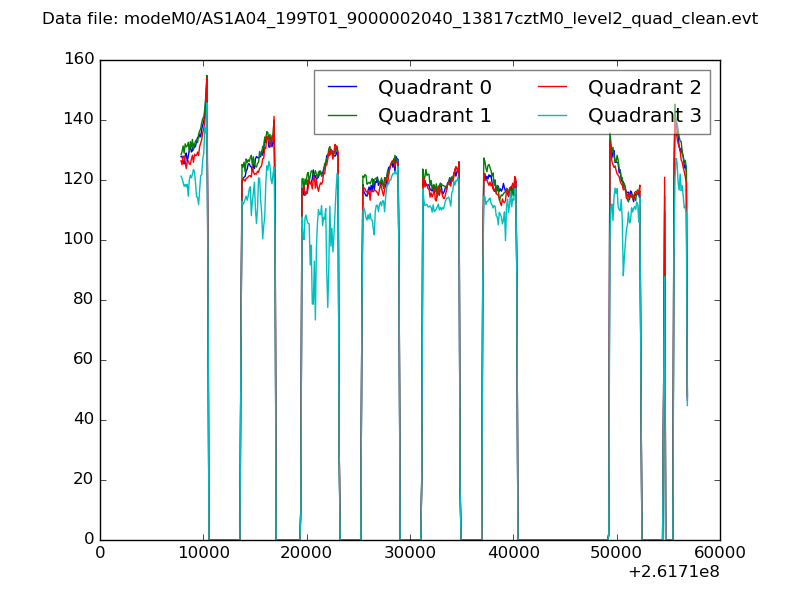 |
|
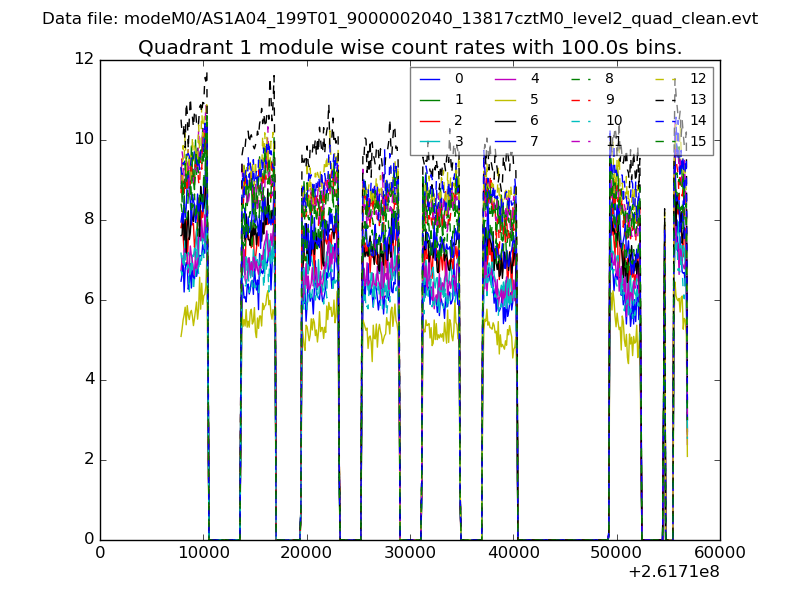
| Module-wise count rates for Quadrant A Data is divided into 100 sec bins |
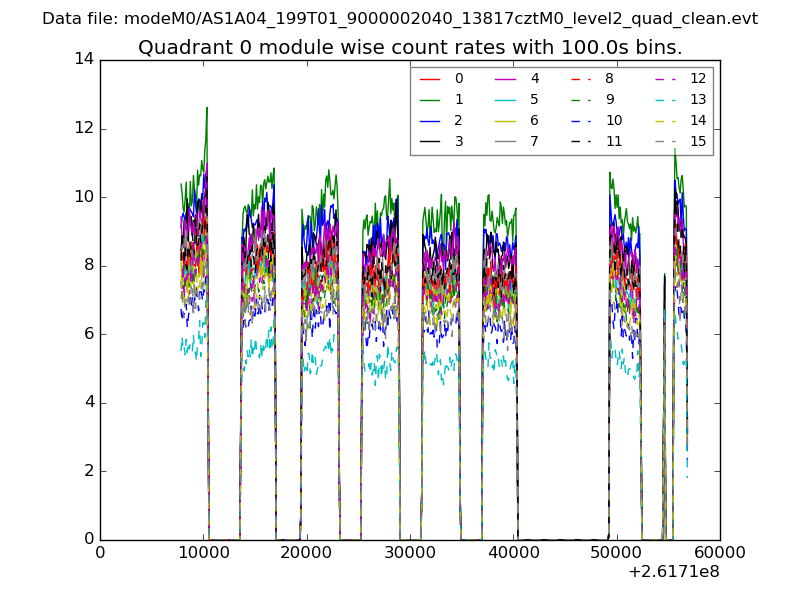 |
 |
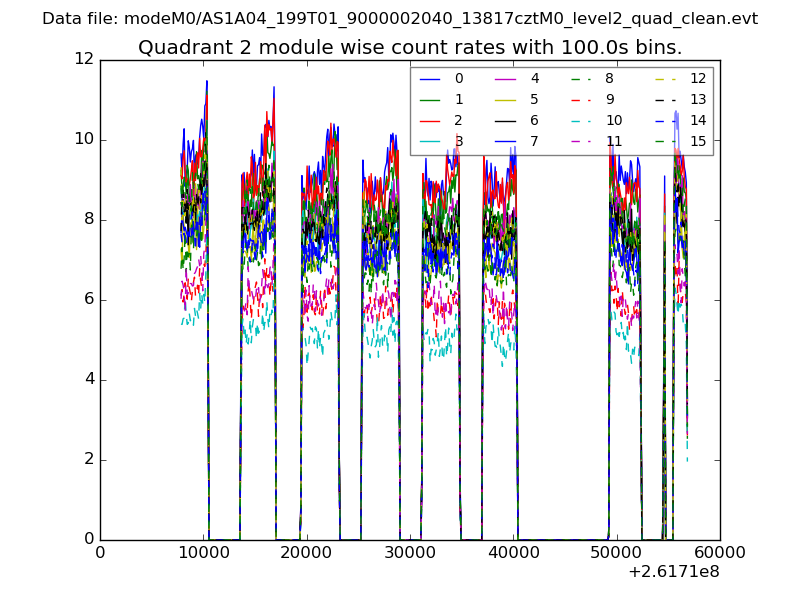
| Module-wise count rates for Quadrant B Data is divided into 100 sec bins |
 |
 |
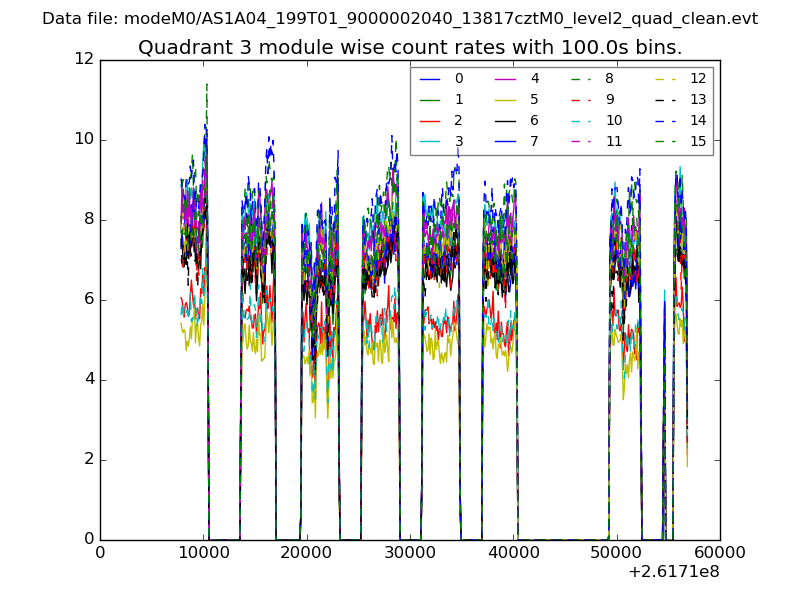
| Module-wise count rates for Quadrant C Data is divided into 100 sec bins |
 |
 |
| Module-wise count rates for Quadrant D Data is divided into 100 sec bins |
 |
 |
| Parameter | Plot |
|---|---|
| CZT HV Monitor | 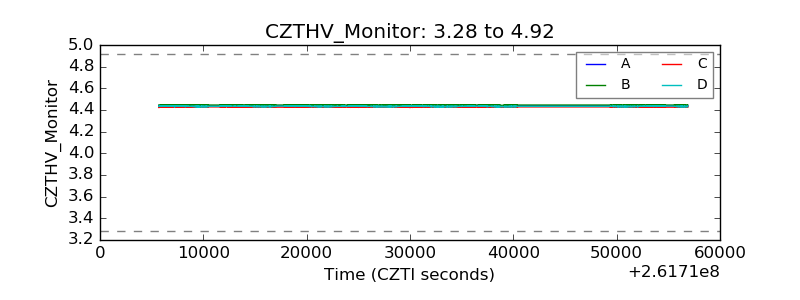 |
| D_VDD | 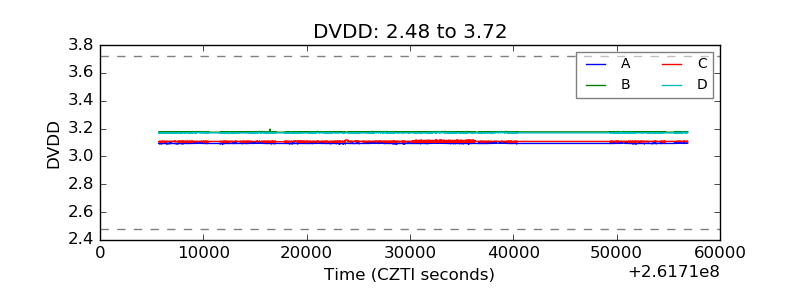 |
| Temperature 1 | 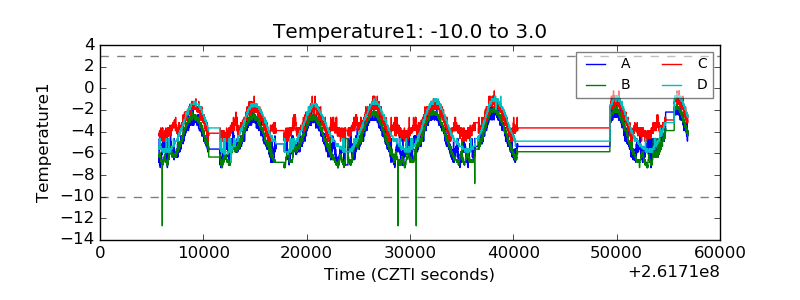 |
| Veto HV Monitor | 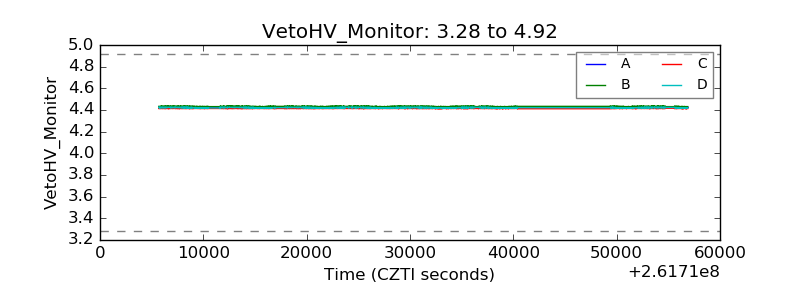 |
| Veto LLD | 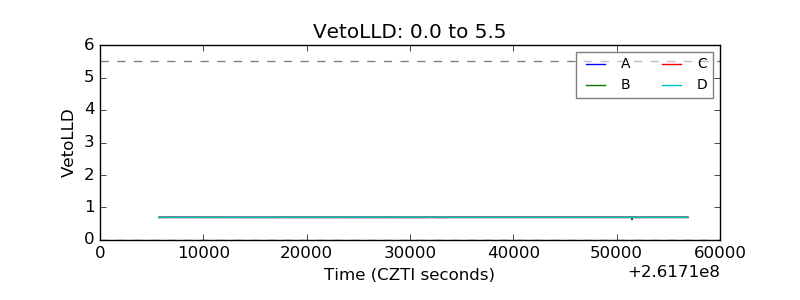 |
| Alpha Counter | 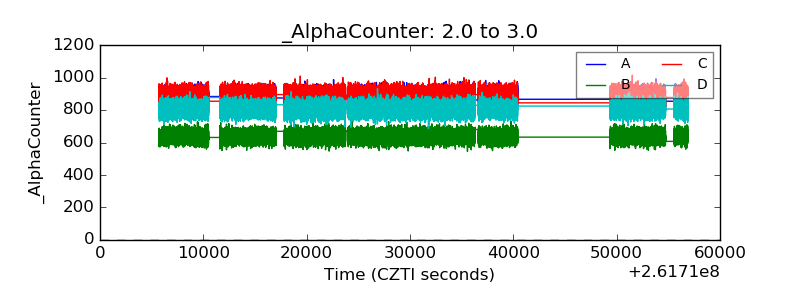 |
| _CPM_Rate | 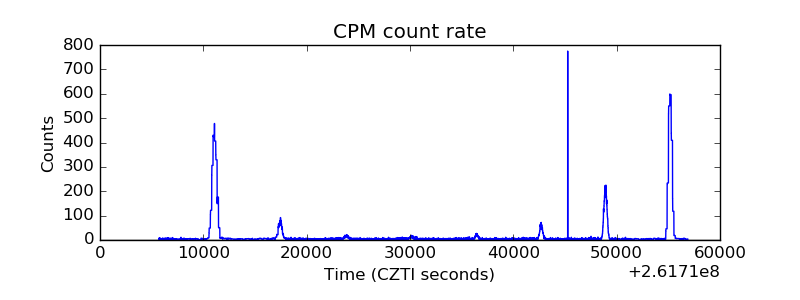 |
| CZT Counter | 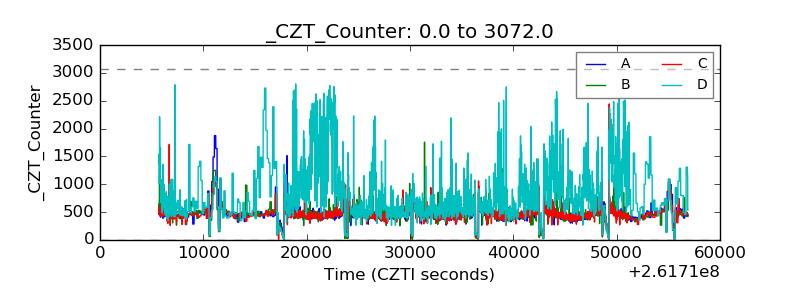 |
| +2.5 Volts monitor |  |
| +5 Volts monitor |  |
| _ROLL_ROT | 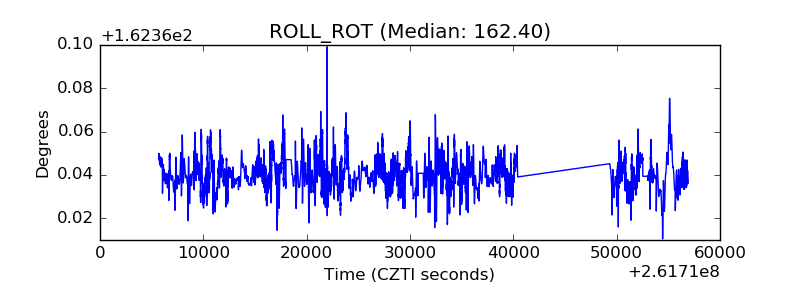 |
| _Roll_DEC |  |
| _Roll_RA | 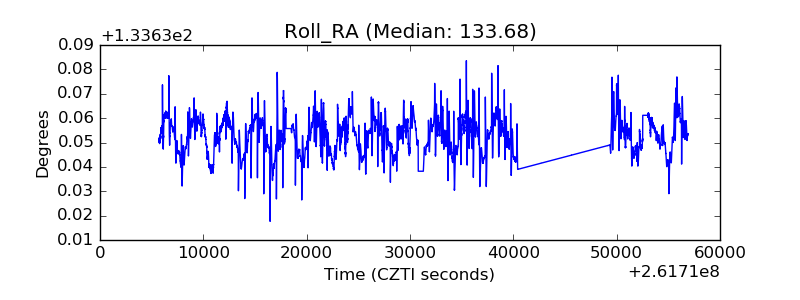 |
| Veto Counter | 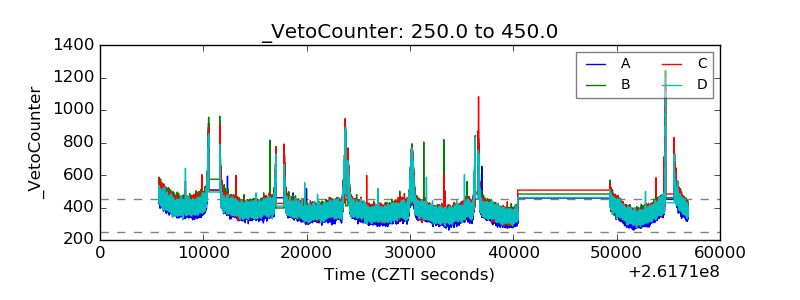 |