| Param | Original file | Final file |
|---|---|---|
| Filename | modeM0/AS1A04_199T01_9000002040_13818cztM0_level2.evt | modeM0/AS1A04_199T01_9000002040_13818cztM0_level2_quad_clean.evt |
| Size (bytes) | 531,555,840 | 86,808,960 |
| Size | 506.9 MB | 82.8 MB |
| Events in quadrant A | 3,111,020 | 555,258 |
| Events in quadrant B | 3,352,008 | 561,370 |
| Events in quadrant C | 3,085,750 | 553,433 |
| Events in quadrant D | 6,106,816 | 503,244 |
| Mode M9 | |||
|---|---|---|---|
| Quadrant | BADHDUFLAG | Total packets | Discarded packets |
| A | 0 | 10 | 0 |
| B | 0 | 10 | 0 |
| C | 0 | 10 | 0 |
| D | 0 | 10 | 0 |
| Mode SS | |||
|---|---|---|---|
| Quadrant | BADHDUFLAG | Total packets | Discarded packets |
| A | 0 | 134 | 0 |
| B | 0 | 134 | 0 |
| C | 0 | 134 | 0 |
| D | 0 | 134 | 0 |
| Mode M0 | |||
|---|---|---|---|
| Quadrant | BADHDUFLAG | Total packets | Discarded packets |
| A | 0 | 13661 | 3 |
| B | 0 | 14155 | 2 |
| C | 0 | 13438 | 2 |
| D | 0 | 22610 | 2 |
| Quadrant | Total seconds | Saturated seconds | Saturation percentage |
|---|---|---|---|
| A | 6523 | 46 | 0.705197% |
| B | 6523 | 67 | 1.027135% |
| C | 6523 | 21 | 0.321938% |
| D | 6524 | 491 | 7.526058% |
Noise dominated data is calculated using 1-second bins in cleaned event files. If a bin has >2000 counts, and if more than 50% of those come from <1% of pixels, then it is considered to be noise-dominated and hence unusable.
| Quadrant | # 1 sec bins | Bins with >0 counts | Bins with >2000 counts | High rate bins dominated by noise | Noise dominated (total time) | Noise dominated (detector-on time) | Marked lightcurve |
|---|---|---|---|---|---|---|---|
| A | 7539 | 6524 | 0 | 0 | 0.00% | 0.00% | 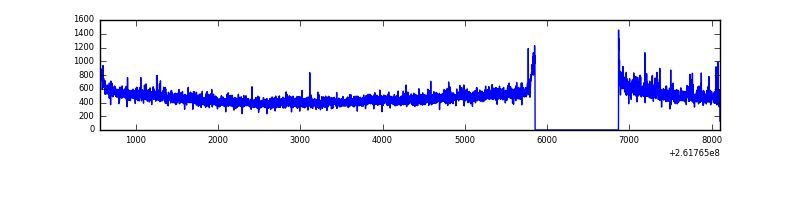 |
| B | 7539 | 6524 | 14 | 14 | 0.19% | 0.21% | 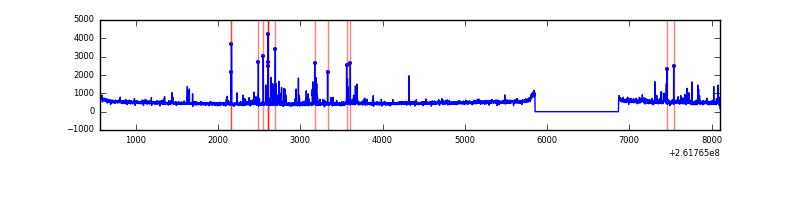 |
| C | 7539 | 6525 | 1 | 1 | 0.01% | 0.02% | 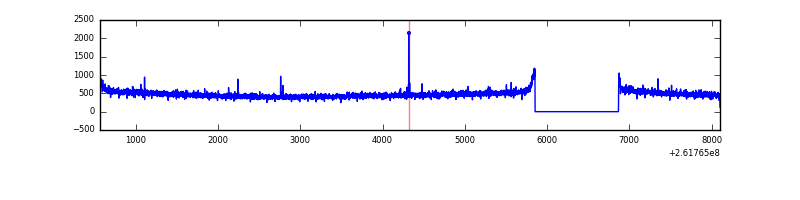 |
| D | 7540 | 6525 | 483 | 483 | 6.41% | 7.40% | 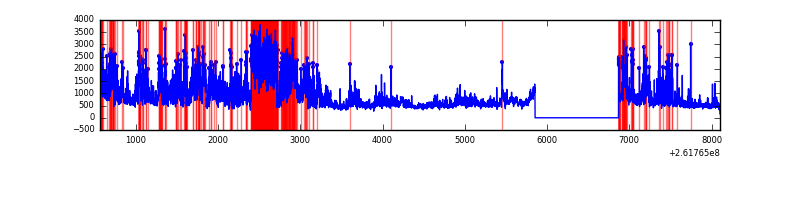 |
Top three noisy pixels from each quadrant. If the there are fewer than three noisy pixels in the level2.evt file, extra rows are filled as -1
| Pixel properties | Quadrant properties | ||||||
|---|---|---|---|---|---|---|---|
| Quadrant | DetID | PixID | Counts | Sigma | Mean | Median | Sigma |
| A | 8 | 15 | 37344 | 230.41 | 783 | 765 | 158.8 |
| A | 1 | 162 | 28077 | 172.04 | 783 | 765 | 158.8 |
| A | 1 | 178 | 10459 | 61.06 | 783 | 765 | 158.8 |
| B | 3 | 64 | 170566 | 1133.78 | 785 | 764 | 149.8 |
| B | 0 | 214 | 23957 | 154.86 | 785 | 764 | 149.8 |
| B | 0 | 219 | 23131 | 149.35 | 785 | 764 | 149.8 |
| C | 3 | 233 | 90920 | 503.25 | 765 | 768 | 179.1 |
| C | 12 | 4 | 6344 | 31.13 | 765 | 768 | 179.1 |
| C | 13 | 61 | 5604 | 27.0 | 765 | 768 | 179.1 |
| D | 1 | 52 | 1186655 | 6492.05 | 747 | 727 | 182.7 |
| D | 5 | 222 | 1131934 | 6192.49 | 747 | 727 | 182.7 |
| D | 13 | 122 | 532726 | 2912.29 | 747 | 727 | 182.7 |
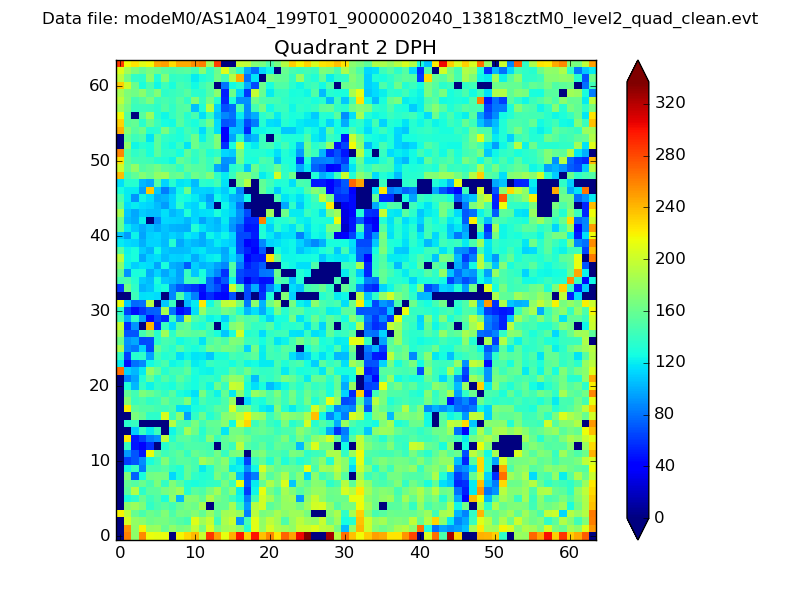
Histogram calculated using DETX and DETY for each event in the final _common_clean file
| Quadrant A | 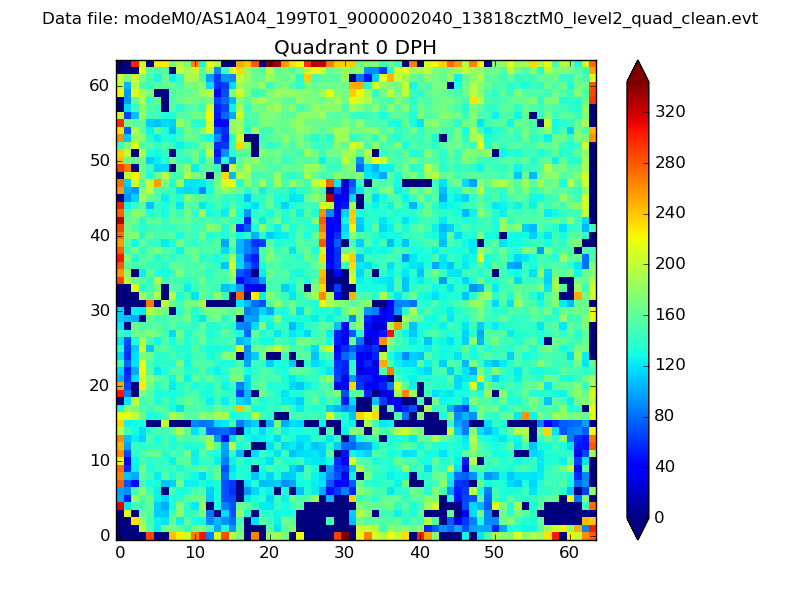 |
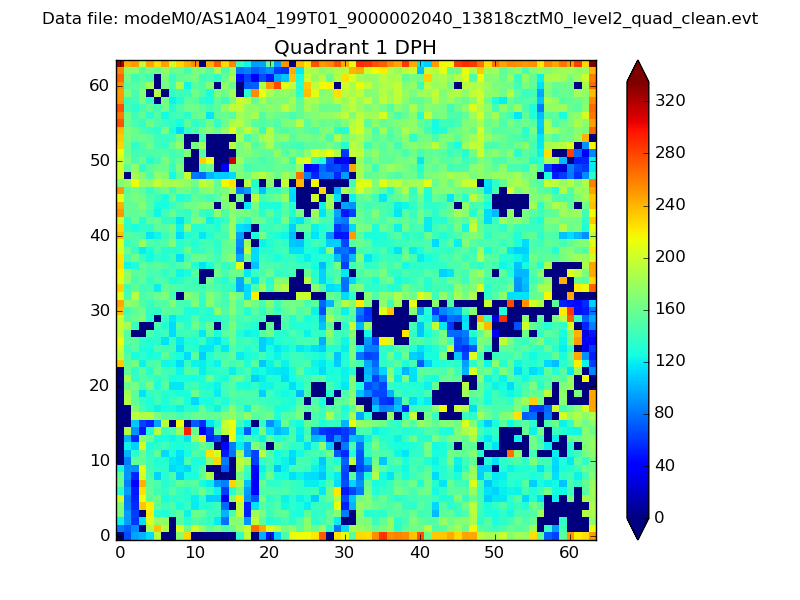 |
Quadrant B |
|---|---|---|---|
| Quadrant D | 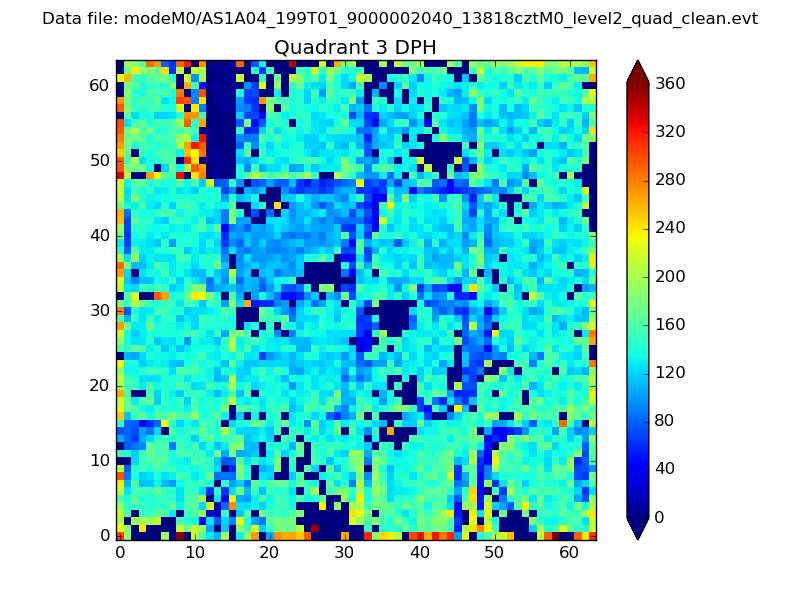 |
 |
Quadrant C |
| Plot type | Count rate plots | Images |
|---|---|---|
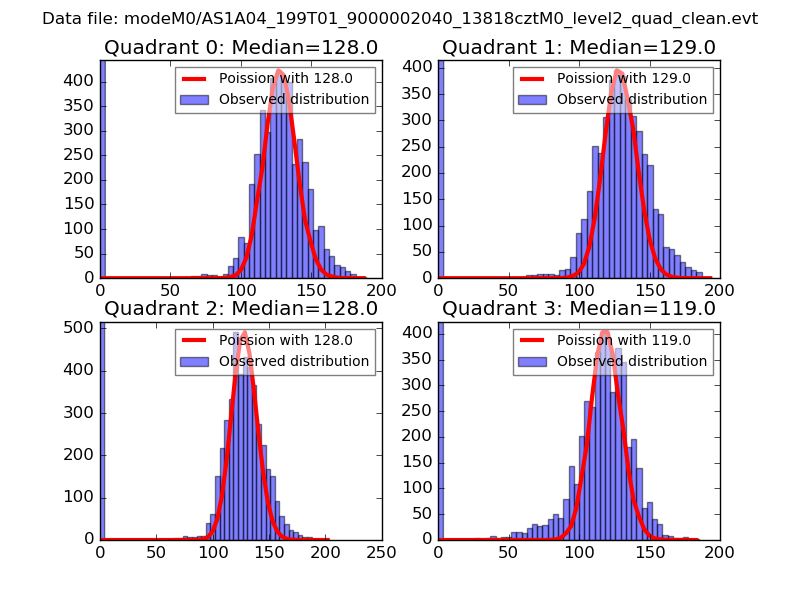
| Comparison with Poisson distribution Blue bars denote a histogram of data divided into 1 sec bins. Red curve is a Poisson curve with rate = median count rate of data. |
 |
 |
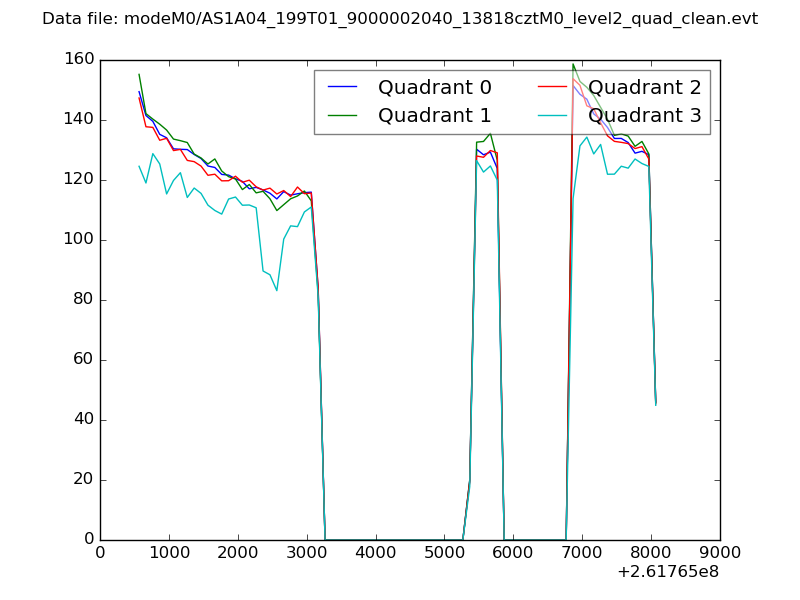
| Quadrant-wise count rates Data is divided into 100 sec bins |
 |
|
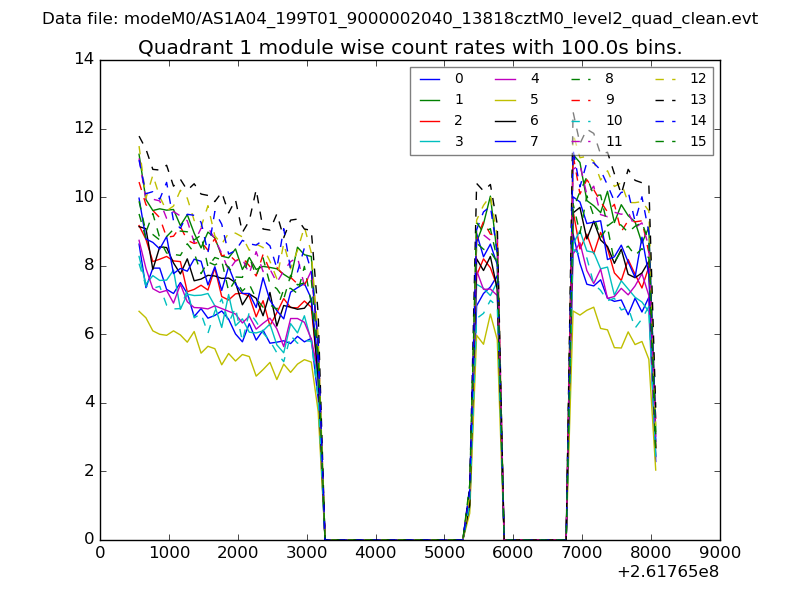
| Module-wise count rates for Quadrant A Data is divided into 100 sec bins |
 |
 |
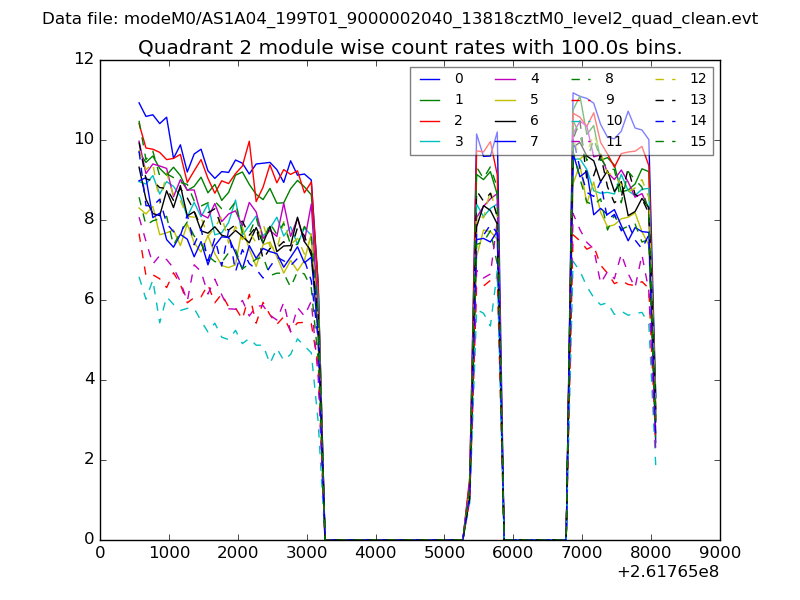
| Module-wise count rates for Quadrant B Data is divided into 100 sec bins |
 |
 |
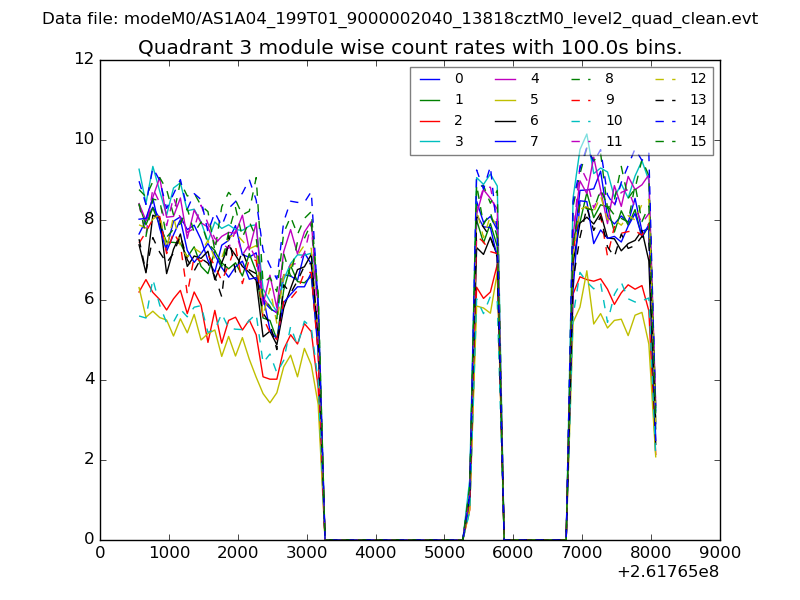
| Module-wise count rates for Quadrant C Data is divided into 100 sec bins |
 |
 |
| Module-wise count rates for Quadrant D Data is divided into 100 sec bins |
 |
 |
| Parameter | Plot |
|---|---|
| CZT HV Monitor | 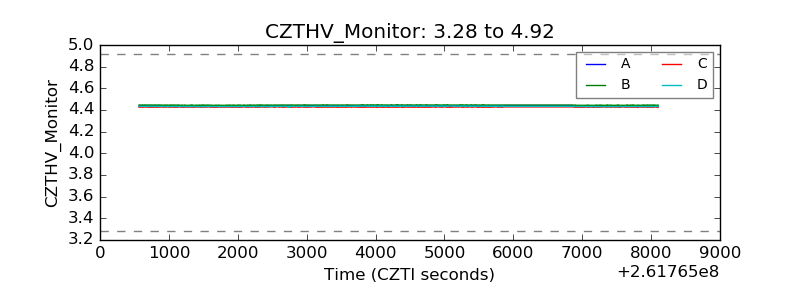 |
| D_VDD | 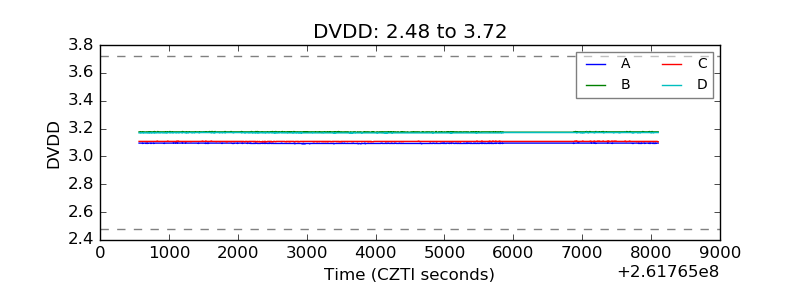 |
| Temperature 1 | 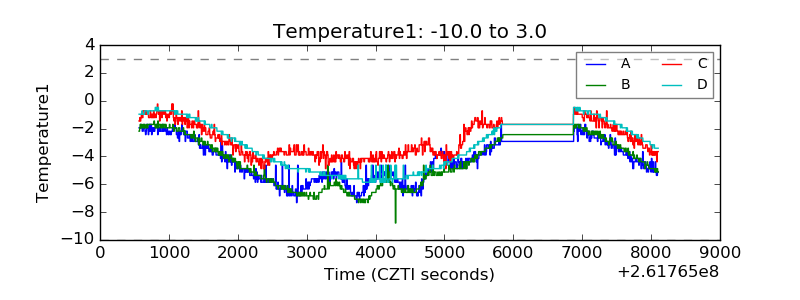 |
| Veto HV Monitor | 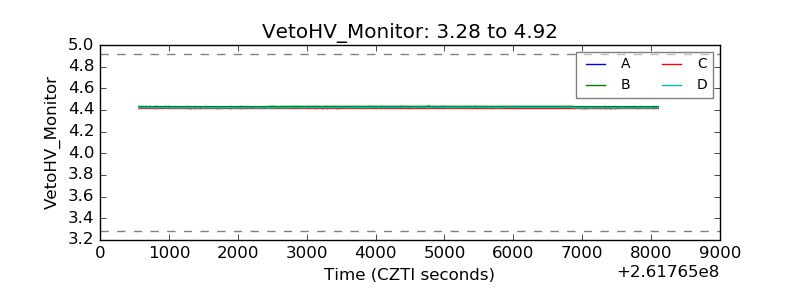 |
| Veto LLD | 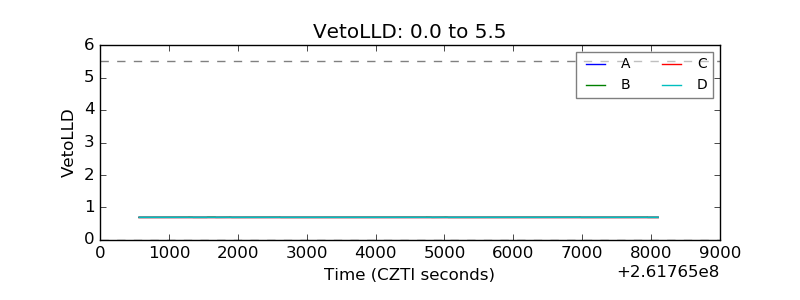 |
| Alpha Counter | 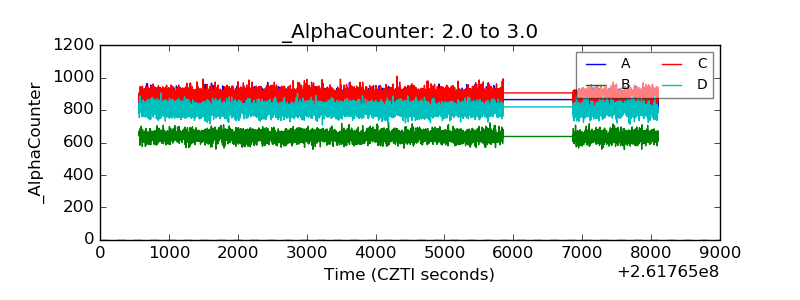 |
| _CPM_Rate | 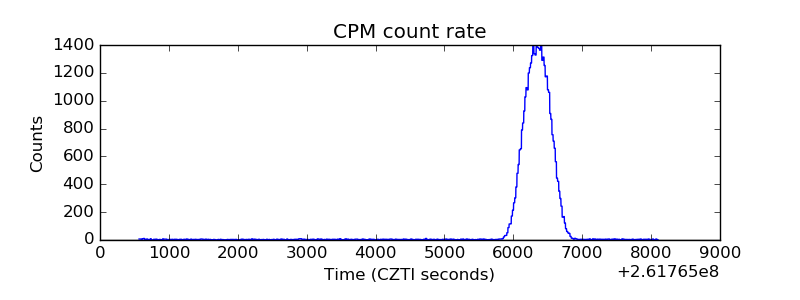 |
| CZT Counter | 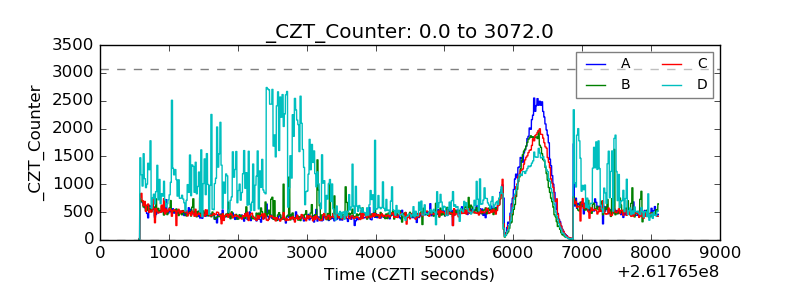 |
| +2.5 Volts monitor |  |
| +5 Volts monitor |  |
| _ROLL_ROT | 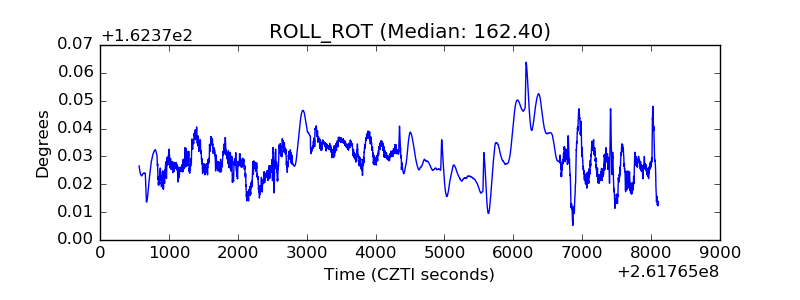 |
| _Roll_DEC | 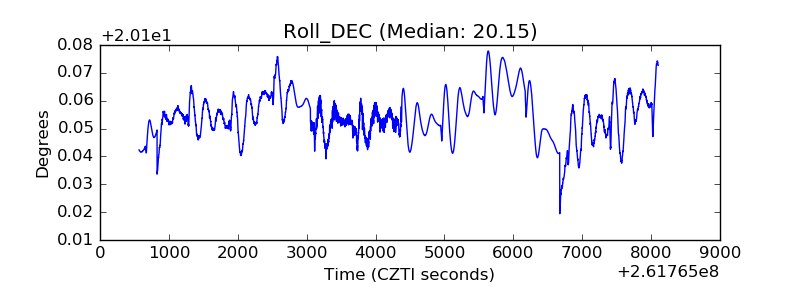 |
| _Roll_RA | 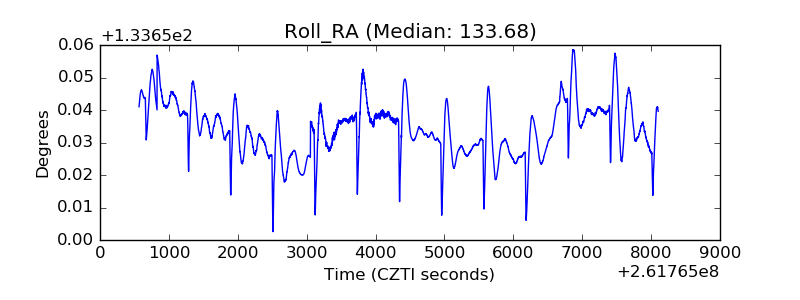 |
| Veto Counter | 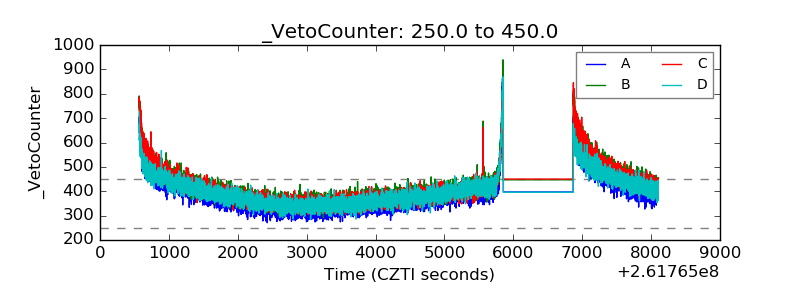 |