| Param | Original file | Final file |
|---|---|---|
| Filename | modeM0/AS1A04_199T01_9000002040_13820cztM0_level2.evt | modeM0/AS1A04_199T01_9000002040_13820cztM0_level2_quad_clean.evt |
| Size (bytes) | 507,502,080 | 88,655,040 |
| Size | 484.0 MB | 84.5 MB |
| Events in quadrant A | 3,134,702 | 570,621 |
| Events in quadrant B | 3,350,896 | 582,383 |
| Events in quadrant C | 3,075,599 | 571,399 |
| Events in quadrant D | 5,372,310 | 511,511 |
| Mode M9 | |||
|---|---|---|---|
| Quadrant | BADHDUFLAG | Total packets | Discarded packets |
| A | 0 | 21 | 0 |
| B | 0 | 21 | 0 |
| C | 0 | 21 | 0 |
| D | 0 | 21 | 0 |
| Mode SS | |||
|---|---|---|---|
| Quadrant | BADHDUFLAG | Total packets | Discarded packets |
| A | 0 | 132 | 0 |
| B | 0 | 132 | 0 |
| C | 0 | 132 | 0 |
| D | 0 | 132 | 0 |
| Mode M0 | |||
|---|---|---|---|
| Quadrant | BADHDUFLAG | Total packets | Discarded packets |
| A | 0 | 13611 | 3 |
| B | 0 | 14070 | 2 |
| C | 0 | 13351 | 2 |
| D | 0 | 20414 | 2 |
| Quadrant | Total seconds | Saturated seconds | Saturation percentage |
|---|---|---|---|
| A | 6430 | 68 | 1.057543% |
| B | 6430 | 103 | 1.601866% |
| C | 6430 | 31 | 0.482115% |
| D | 6430 | 590 | 9.175739% |
Noise dominated data is calculated using 1-second bins in cleaned event files. If a bin has >2000 counts, and if more than 50% of those come from <1% of pixels, then it is considered to be noise-dominated and hence unusable.
| Quadrant | # 1 sec bins | Bins with >0 counts | Bins with >2000 counts | High rate bins dominated by noise | Noise dominated (total time) | Noise dominated (detector-on time) | Marked lightcurve |
|---|---|---|---|---|---|---|---|
| A | 8576 | 6432 | 0 | 0 | 0.00% | 0.00% | 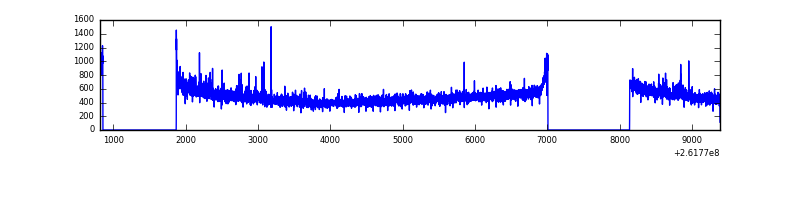 |
| B | 8576 | 6431 | 19 | 19 | 0.22% | 0.30% | 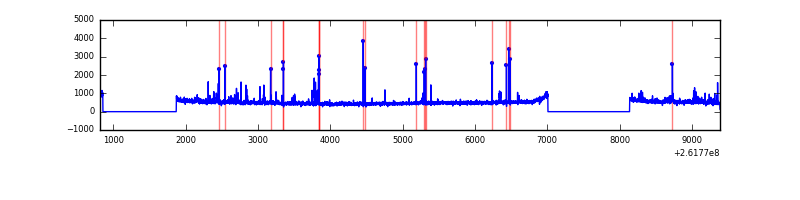 |
| C | 8576 | 6433 | 0 | 0 | 0.00% | 0.00% | 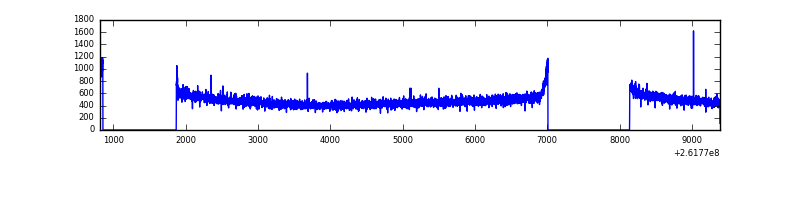 |
| D | 8576 | 6431 | 457 | 457 | 5.33% | 7.11% | 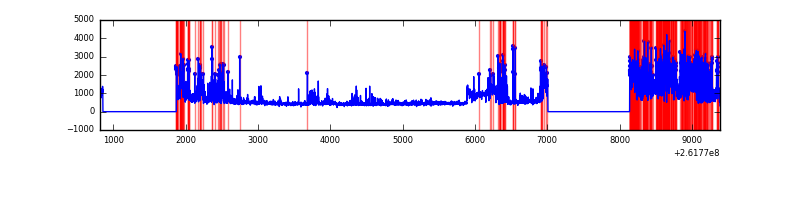 |
Top three noisy pixels from each quadrant. If the there are fewer than three noisy pixels in the level2.evt file, extra rows are filled as -1
| Pixel properties | Quadrant properties | ||||||
|---|---|---|---|---|---|---|---|
| Quadrant | DetID | PixID | Counts | Sigma | Mean | Median | Sigma |
| A | 8 | 15 | 53696 | 326.67 | 786 | 769 | 162.0 |
| A | 1 | 162 | 26668 | 159.85 | 786 | 769 | 162.0 |
| A | 1 | 178 | 11155 | 64.1 | 786 | 769 | 162.0 |
| B | 0 | 219 | 62162 | 408.16 | 790 | 769 | 150.4 |
| B | 3 | 64 | 59048 | 387.46 | 790 | 769 | 150.4 |
| B | 3 | 209 | 36930 | 240.41 | 790 | 769 | 150.4 |
| C | 3 | 233 | 70088 | 388.72 | 766 | 771 | 178.3 |
| C | 4 | 175 | 13364 | 70.62 | 766 | 771 | 178.3 |
| C | 13 | 61 | 5510 | 26.58 | 766 | 771 | 178.3 |
| D | 10 | 157 | 1414494 | 7786.25 | 742 | 721 | 181.6 |
| D | 5 | 222 | 377433 | 2074.71 | 742 | 721 | 181.6 |
| D | 13 | 122 | 314220 | 1726.57 | 742 | 721 | 181.6 |
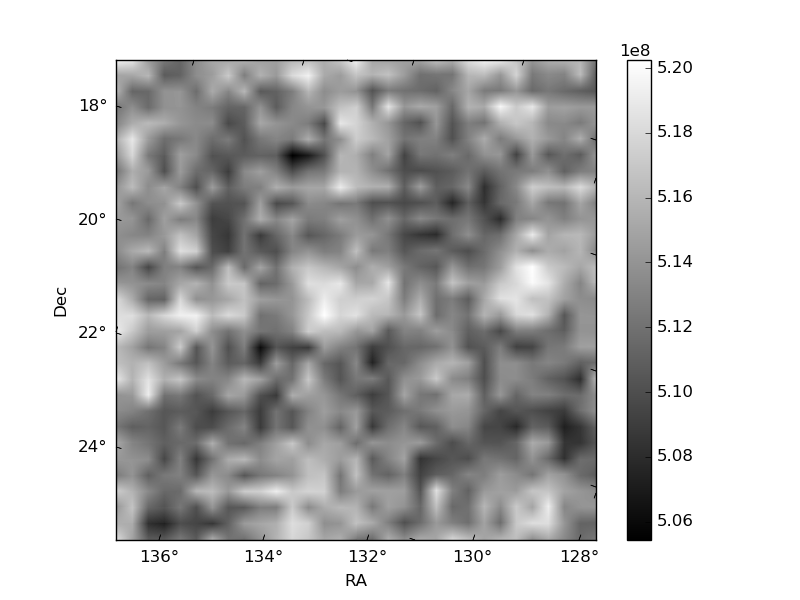
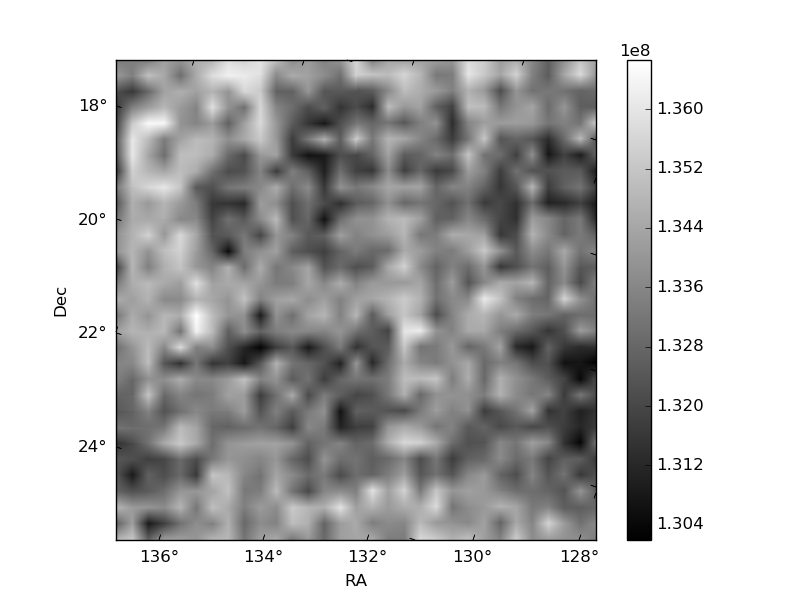
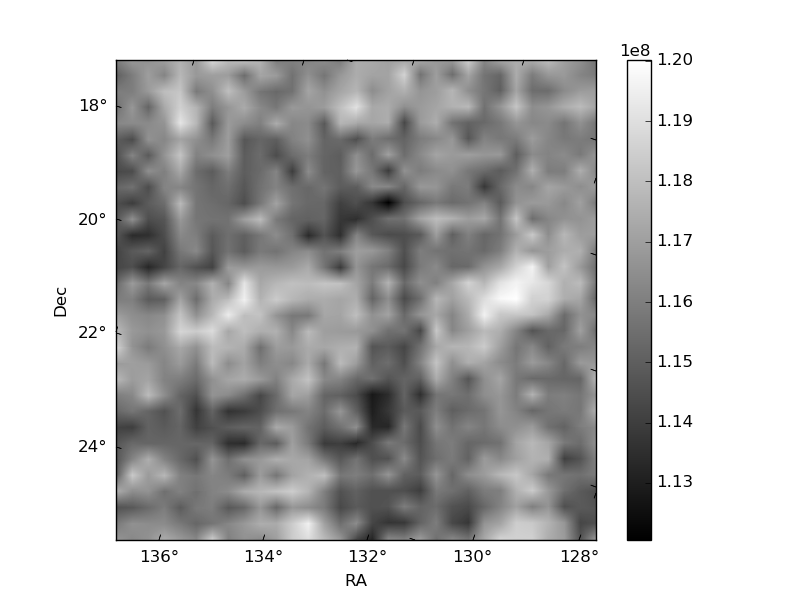
Histogram calculated using DETX and DETY for each event in the final _common_clean file
| Quadrant A | 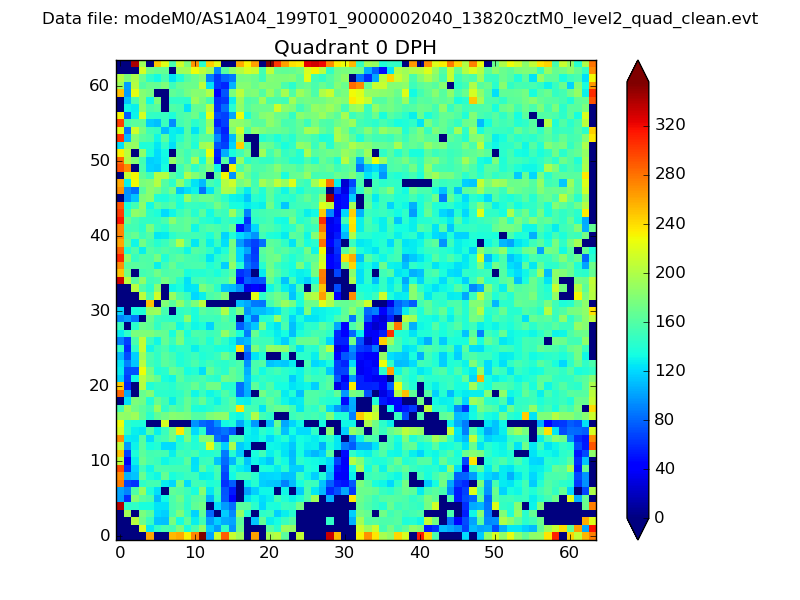 |
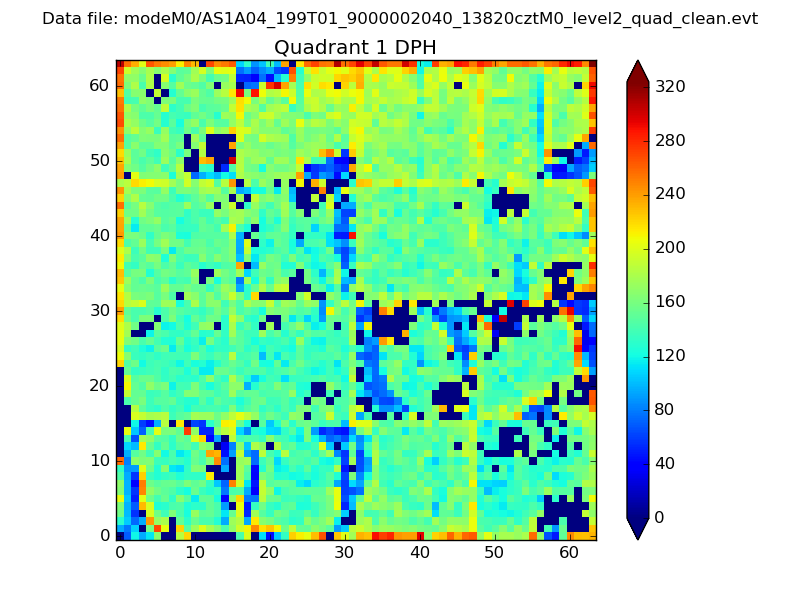 |
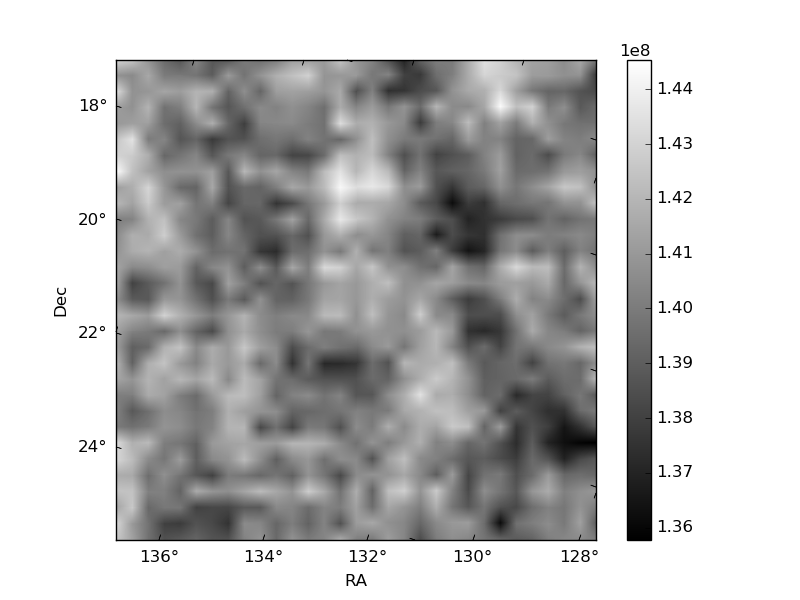
Quadrant B |
|---|---|---|---|
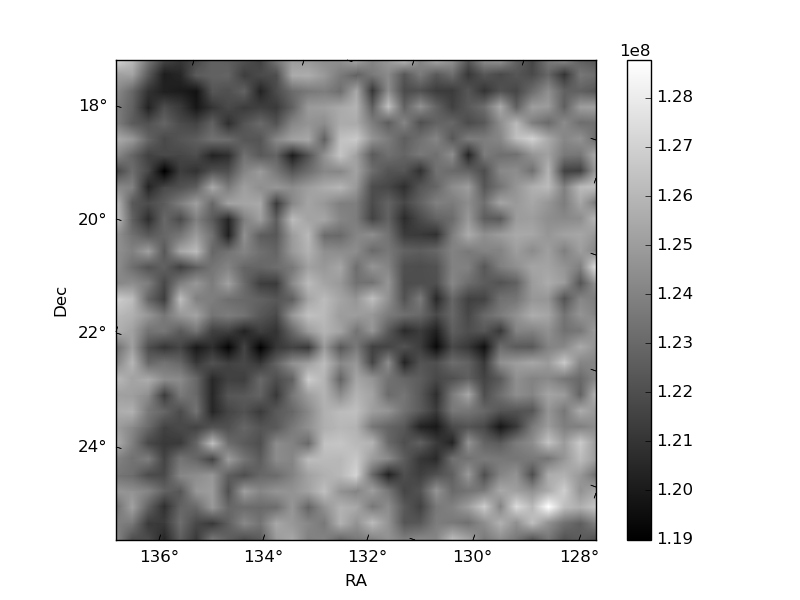
| Quadrant D | 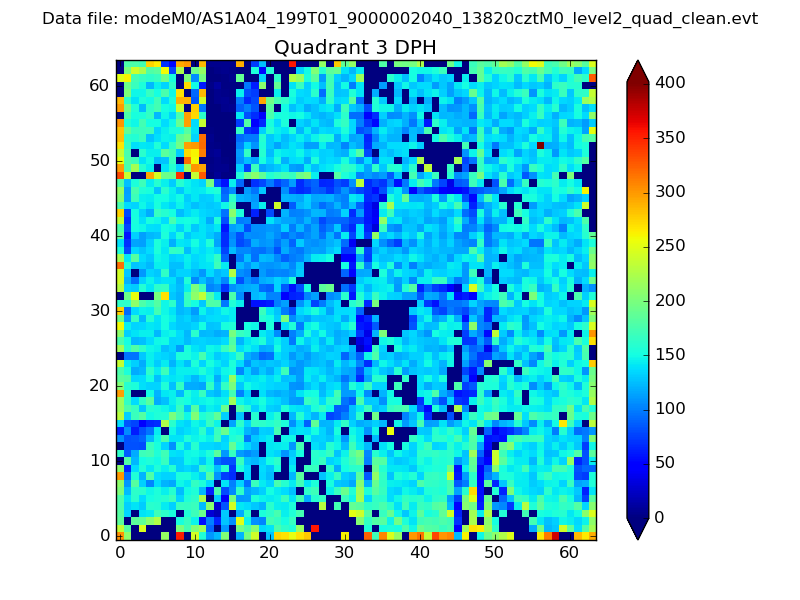 |
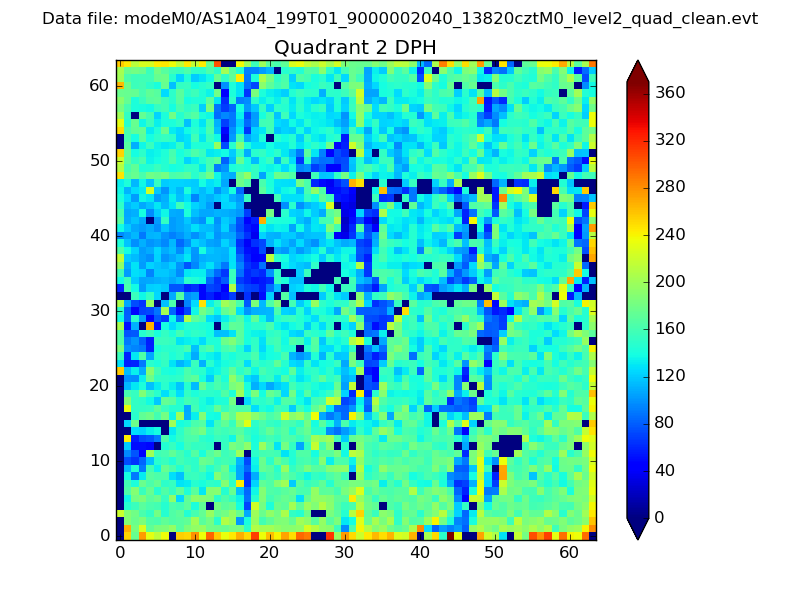 |
Quadrant C |
| Plot type | Count rate plots | Images |
|---|---|---|
| Comparison with Poisson distribution Blue bars denote a histogram of data divided into 1 sec bins. Red curve is a Poisson curve with rate = median count rate of data. |
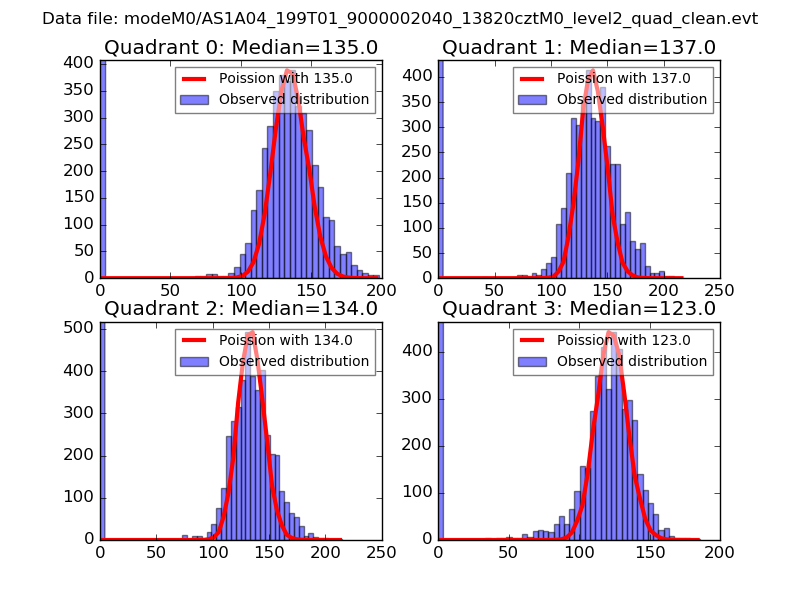 |
 |
| Quadrant-wise count rates Data is divided into 100 sec bins |
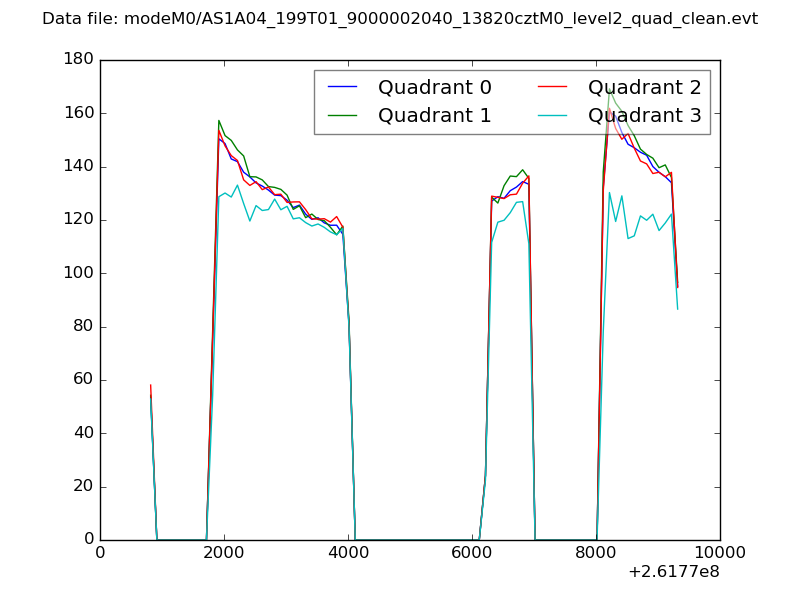 |
|
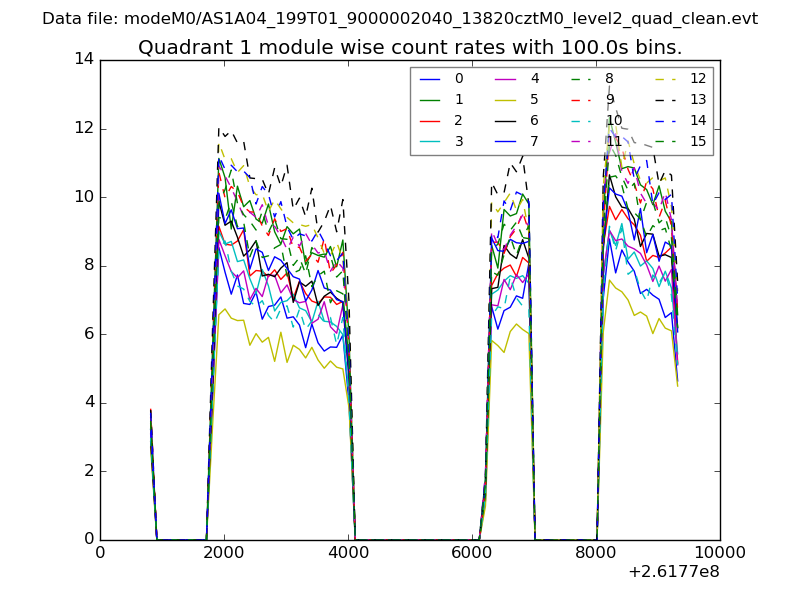
| Module-wise count rates for Quadrant A Data is divided into 100 sec bins |
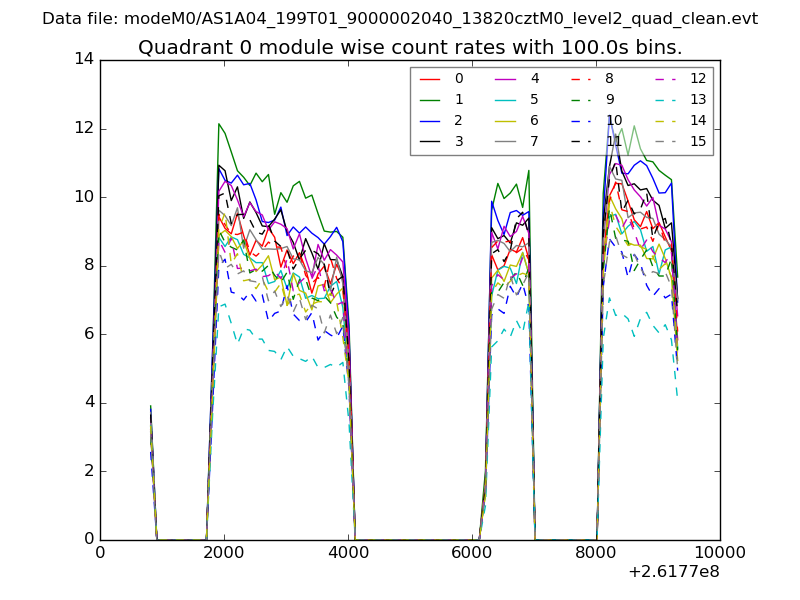 |
 |
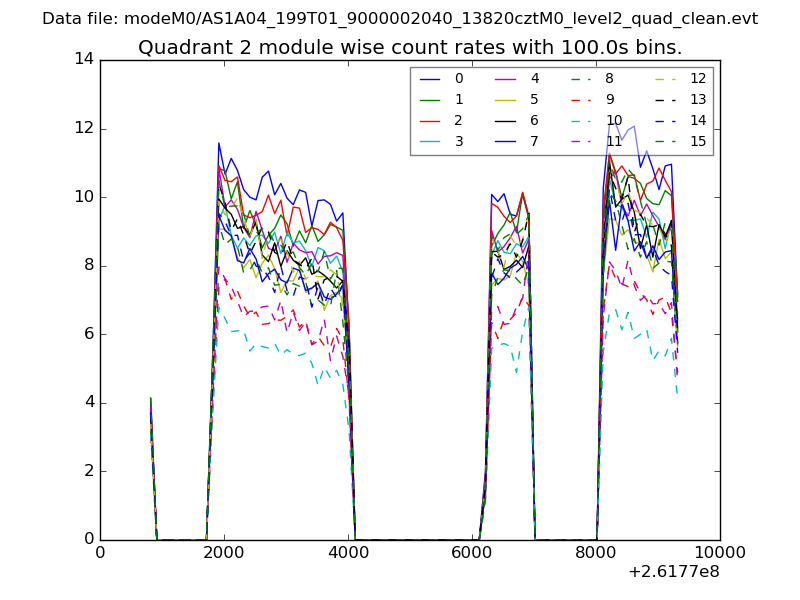
| Module-wise count rates for Quadrant B Data is divided into 100 sec bins |
 |
 |
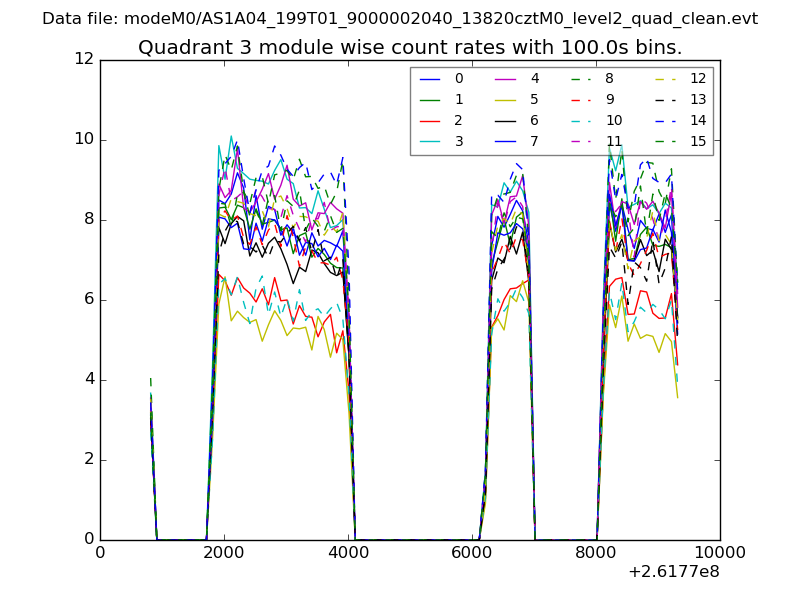
| Module-wise count rates for Quadrant C Data is divided into 100 sec bins |
 |
 |
| Module-wise count rates for Quadrant D Data is divided into 100 sec bins |
 |
 |
| Parameter | Plot |
|---|---|
| CZT HV Monitor | 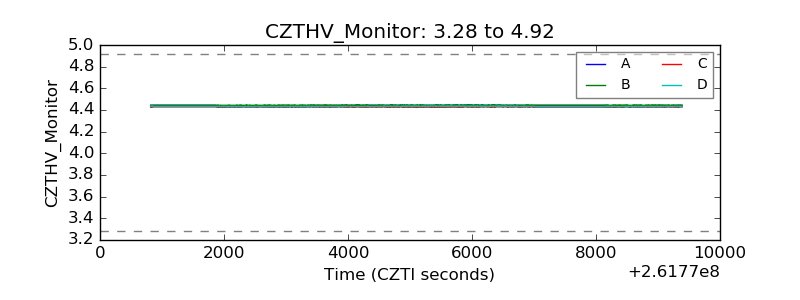 |
| D_VDD | 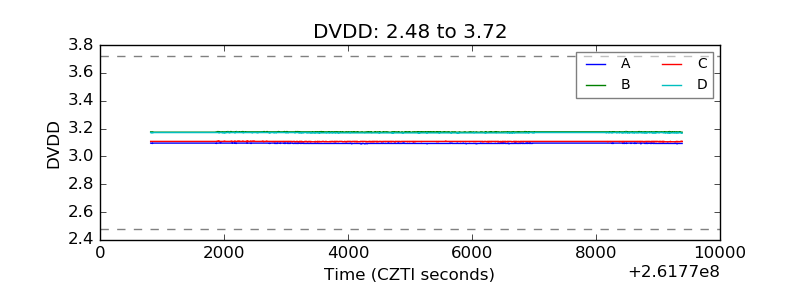 |
| Temperature 1 | 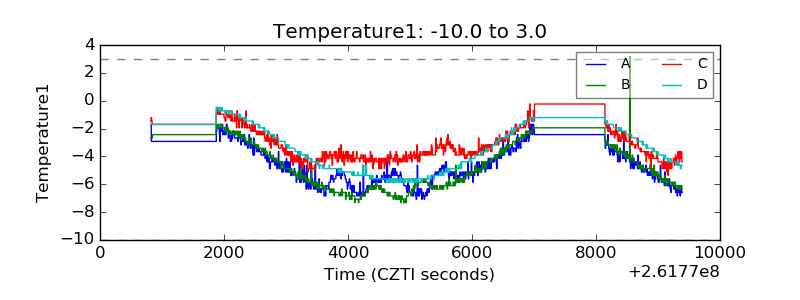 |
| Veto HV Monitor | 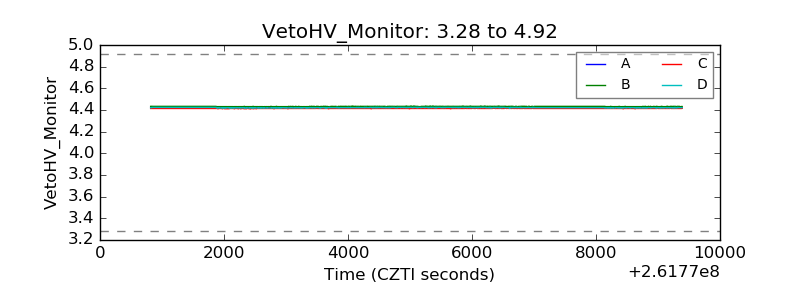 |
| Veto LLD | 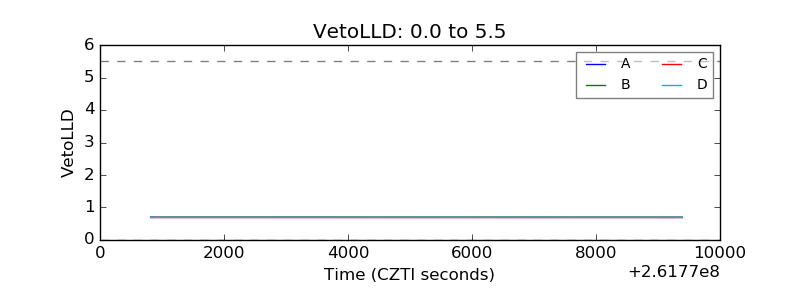 |
| Alpha Counter | 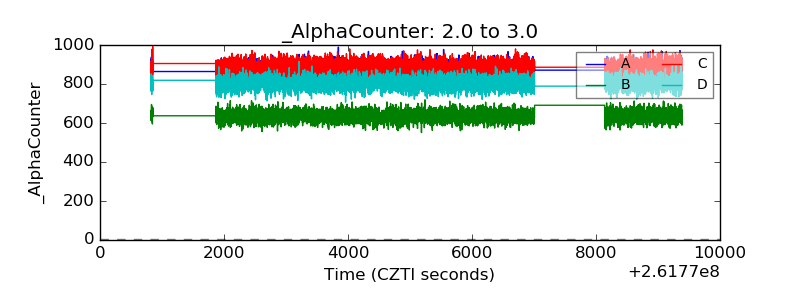 |
| _CPM_Rate | 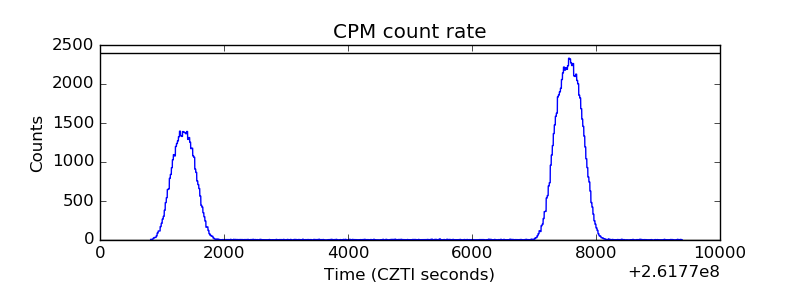 |
| CZT Counter | 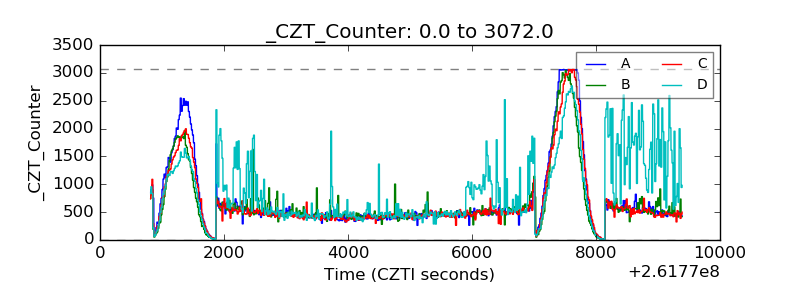 |
| +2.5 Volts monitor |  |
| +5 Volts monitor |  |
| _ROLL_ROT | 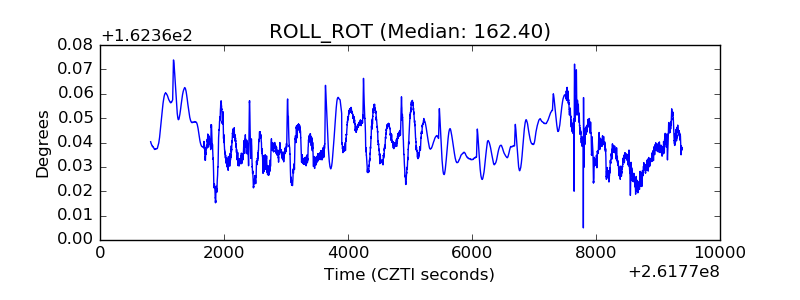 |
| _Roll_DEC | 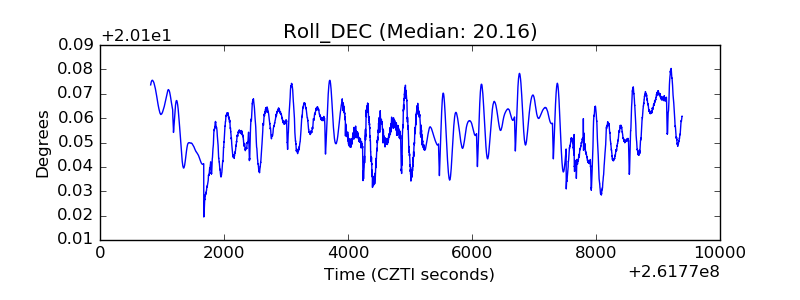 |
| _Roll_RA | 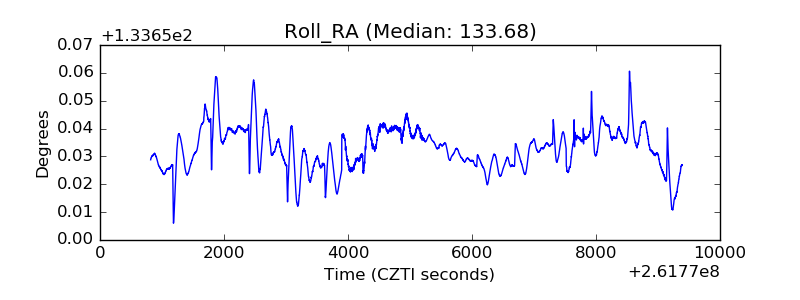 |
| Veto Counter | 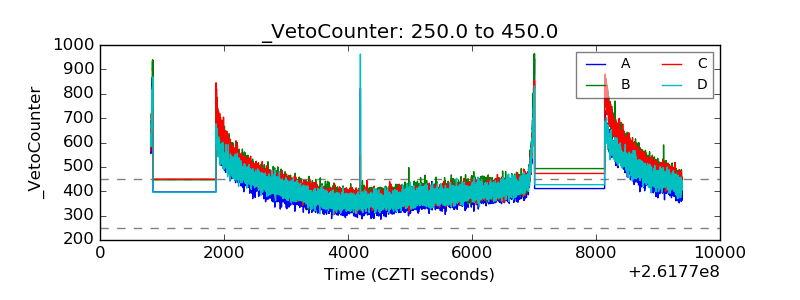 |