| Param | Original file | Final file |
|---|---|---|
| Filename | modeM0/AS1A04_199T01_9000002040_13821cztM0_level2.evt | modeM0/AS1A04_199T01_9000002040_13821cztM0_level2_quad_clean.evt |
| Size (bytes) | 572,595,840 | 90,097,920 |
| Size | 546.1 MB | 85.9 MB |
| Events in quadrant A | 3,075,865 | 586,453 |
| Events in quadrant B | 3,301,655 | 604,840 |
| Events in quadrant C | 3,061,020 | 588,009 |
| Events in quadrant D | 7,473,892 | 507,156 |
| Mode M9 | |||
|---|---|---|---|
| Quadrant | BADHDUFLAG | Total packets | Discarded packets |
| A | 0 | 21 | 0 |
| B | 0 | 21 | 0 |
| C | 0 | 21 | 0 |
| D | 0 | 22 | 0 |
| Mode SS | |||
|---|---|---|---|
| Quadrant | BADHDUFLAG | Total packets | Discarded packets |
| A | 0 | 128 | 0 |
| B | 0 | 128 | 0 |
| C | 0 | 128 | 0 |
| D | 0 | 128 | 0 |
| Mode M0 | |||
|---|---|---|---|
| Quadrant | BADHDUFLAG | Total packets | Discarded packets |
| A | 0 | 13175 | 3 |
| B | 0 | 13742 | 2 |
| C | 0 | 13104 | 2 |
| D | 0 | 26617 | 2 |
| Quadrant | Total seconds | Saturated seconds | Saturation percentage |
|---|---|---|---|
| A | 6331 | 19 | 0.300111% |
| B | 6331 | 48 | 0.758174% |
| C | 6331 | 5 | 0.078976% |
| D | 6331 | 919 | 14.515874% |
Noise dominated data is calculated using 1-second bins in cleaned event files. If a bin has >2000 counts, and if more than 50% of those come from <1% of pixels, then it is considered to be noise-dominated and hence unusable.
| Quadrant | # 1 sec bins | Bins with >0 counts | Bins with >2000 counts | High rate bins dominated by noise | Noise dominated (total time) | Noise dominated (detector-on time) | Marked lightcurve |
|---|---|---|---|---|---|---|---|
| A | 7587 | 6333 | 1 | 1 | 0.01% | 0.02% | 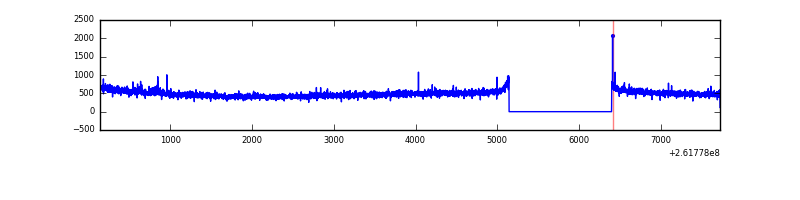 |
| B | 7587 | 6333 | 17 | 17 | 0.22% | 0.27% | 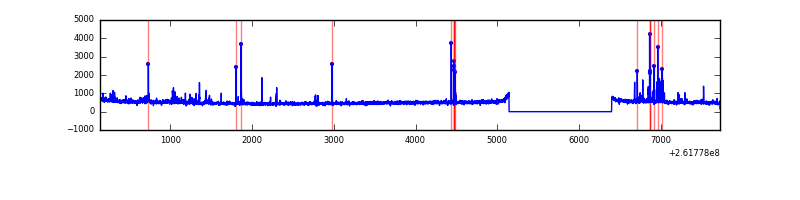 |
| C | 7587 | 6333 | 0 | 0 | 0.00% | 0.00% | 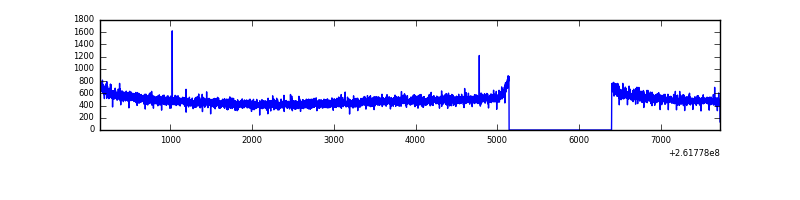 |
| D | 7587 | 6332 | 851 | 851 | 11.22% | 13.44% | 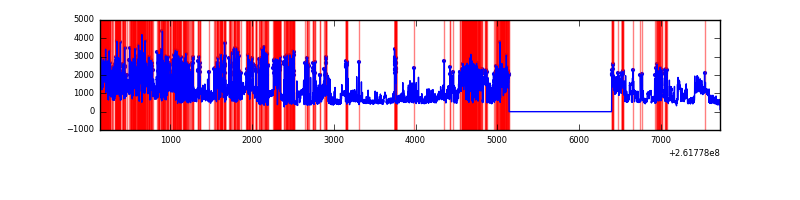 |
Top three noisy pixels from each quadrant. If the there are fewer than three noisy pixels in the level2.evt file, extra rows are filled as -1
| Pixel properties | Quadrant properties | ||||||
|---|---|---|---|---|---|---|---|
| Quadrant | DetID | PixID | Counts | Sigma | Mean | Median | Sigma |
| A | 8 | 15 | 33403 | 205.05 | 782 | 766 | 159.2 |
| A | 1 | 162 | 17264 | 103.65 | 782 | 766 | 159.2 |
| A | 0 | 226 | 7201 | 40.43 | 782 | 766 | 159.2 |
| B | 3 | 64 | 102922 | 685.56 | 789 | 770 | 149.0 |
| B | 0 | 219 | 47575 | 314.12 | 789 | 770 | 149.0 |
| B | 4 | 80 | 34499 | 226.36 | 789 | 770 | 149.0 |
| C | 3 | 233 | 55224 | 308.26 | 765 | 771 | 176.6 |
| C | 4 | 175 | 18254 | 98.97 | 765 | 771 | 176.6 |
| C | 13 | 61 | 5504 | 26.79 | 765 | 771 | 176.6 |
| D | 10 | 157 | 2211402 | 12543.3 | 725 | 706 | 176.2 |
| D | 13 | 122 | 1481263 | 8400.55 | 725 | 706 | 176.2 |
| D | 5 | 222 | 629586 | 3568.21 | 725 | 706 | 176.2 |
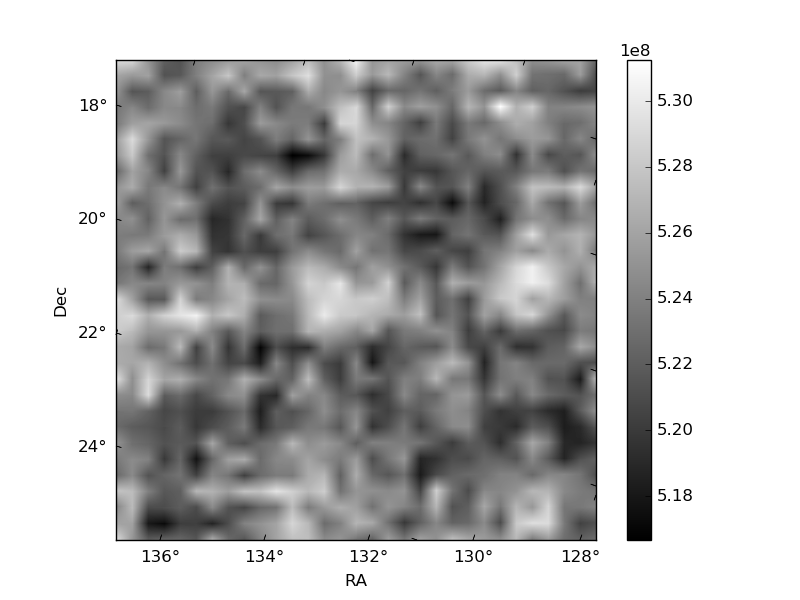
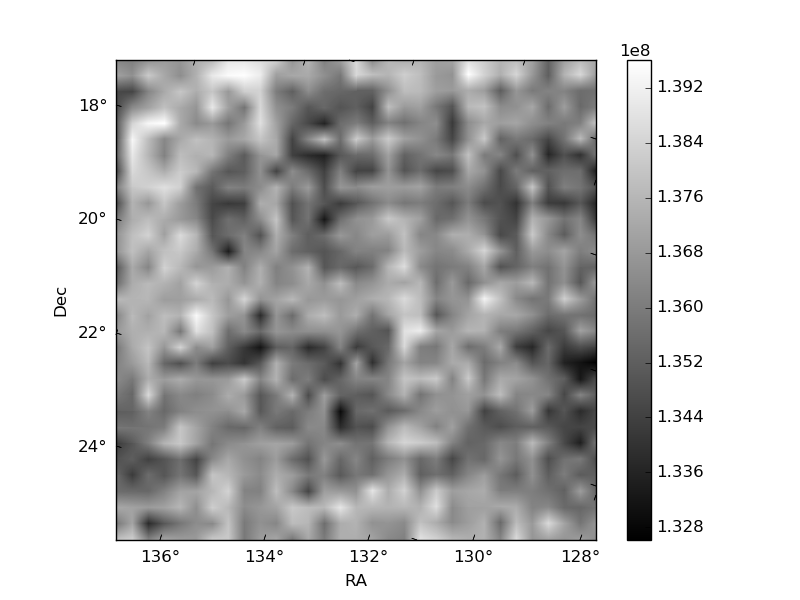
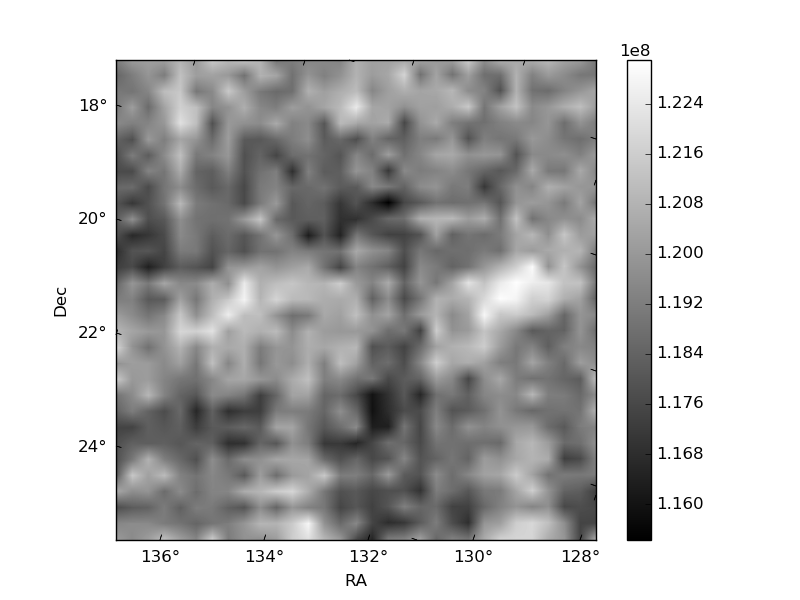
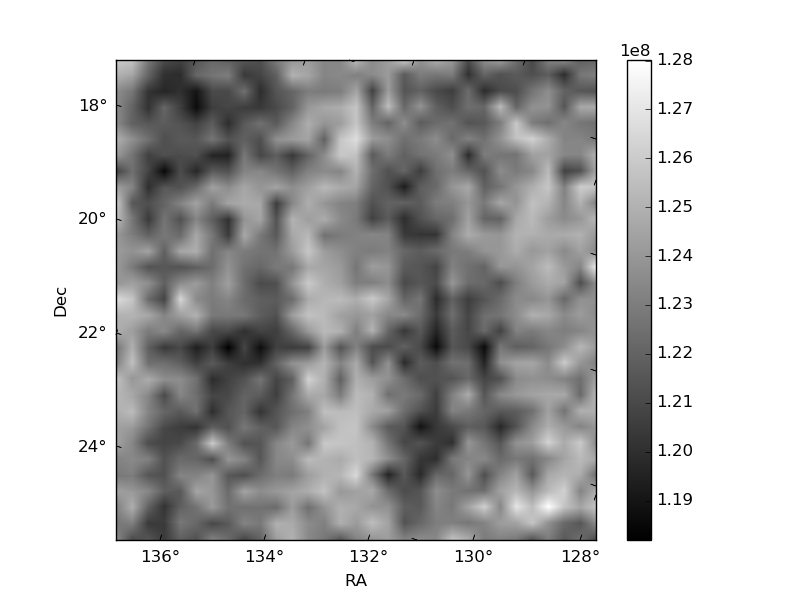
Histogram calculated using DETX and DETY for each event in the final _common_clean file
| Quadrant A | 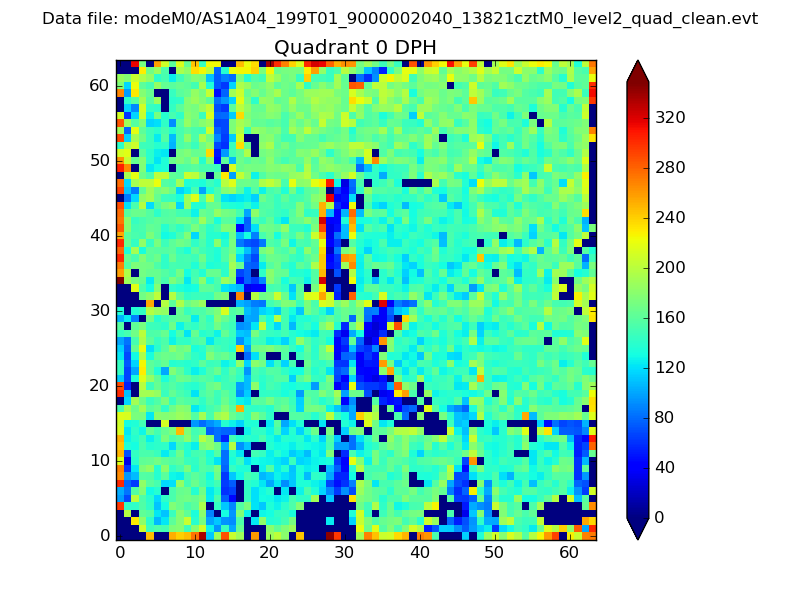 |
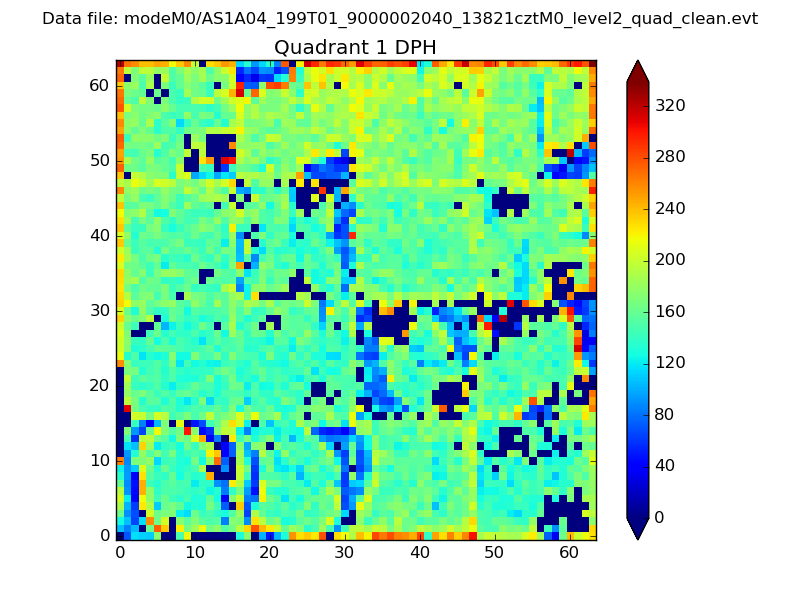 |
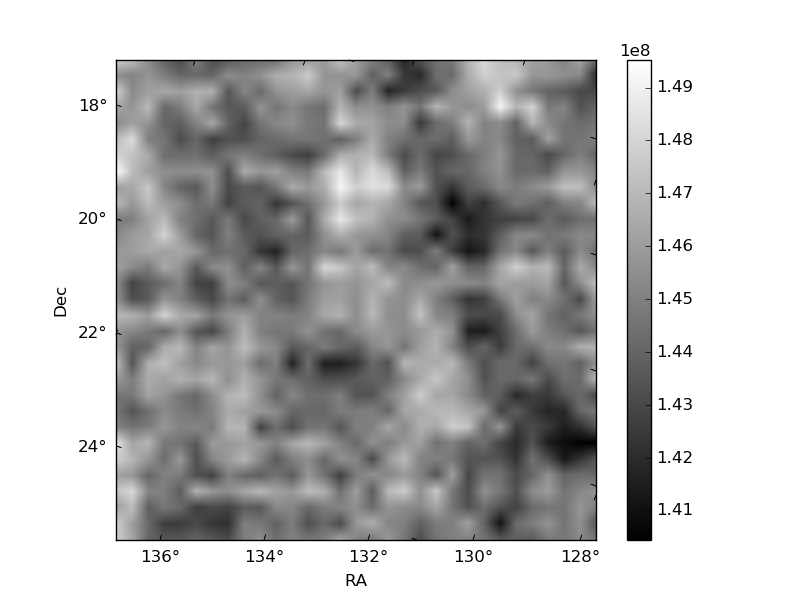
Quadrant B |
|---|---|---|---|
| Quadrant D | 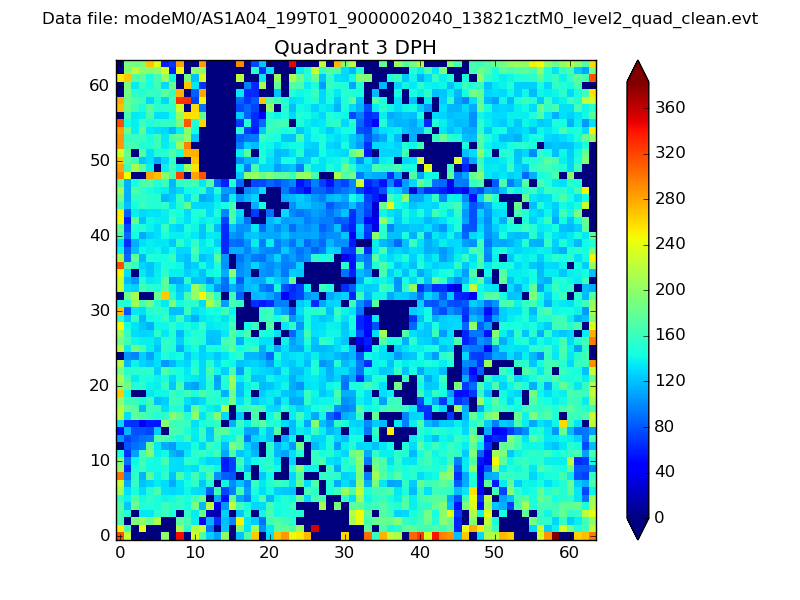 |
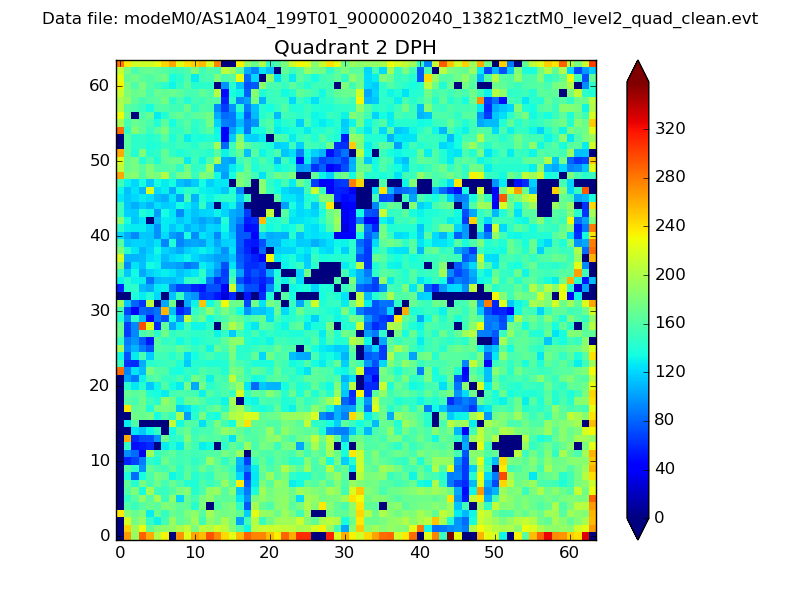 |
Quadrant C |
| Plot type | Count rate plots | Images |
|---|---|---|
| Comparison with Poisson distribution Blue bars denote a histogram of data divided into 1 sec bins. Red curve is a Poisson curve with rate = median count rate of data. |
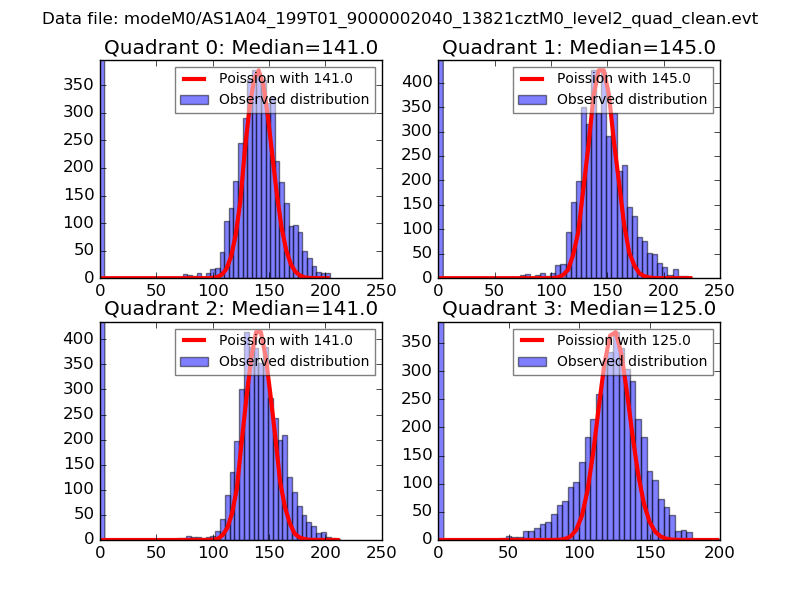 |
 |
| Quadrant-wise count rates Data is divided into 100 sec bins |
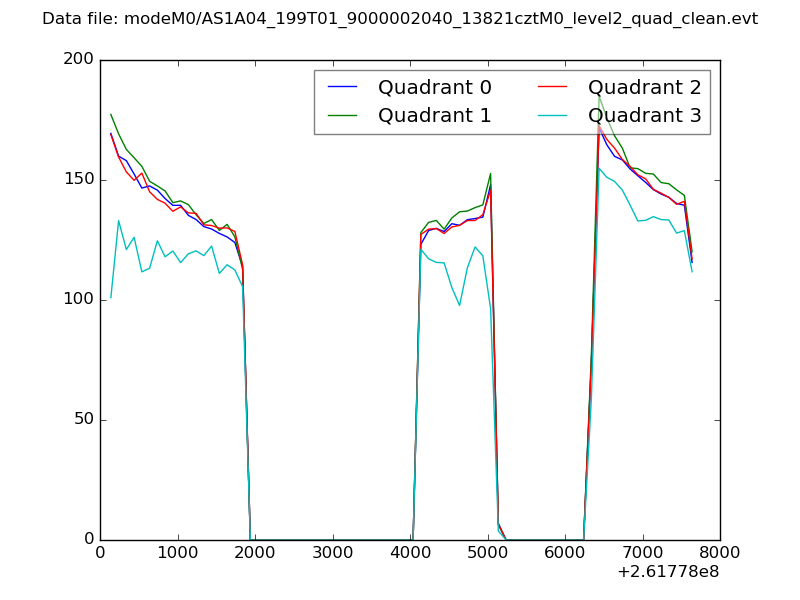 |
|
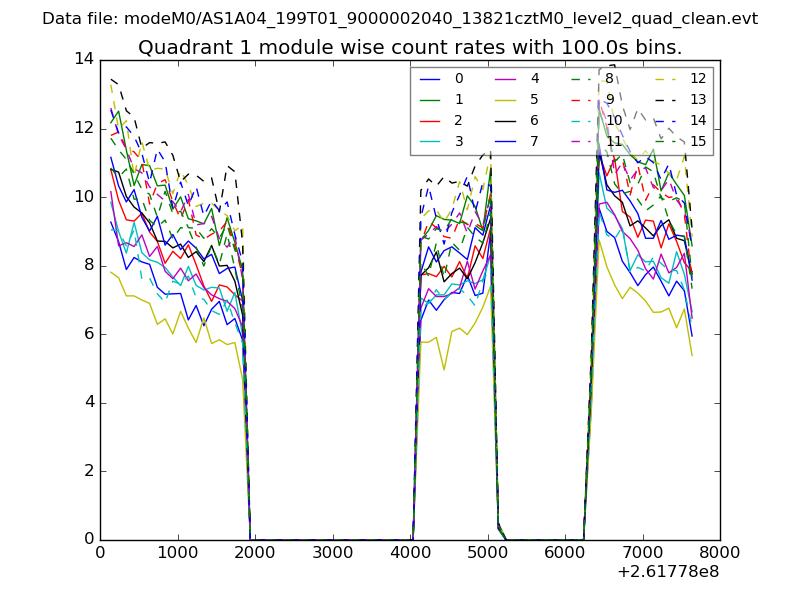
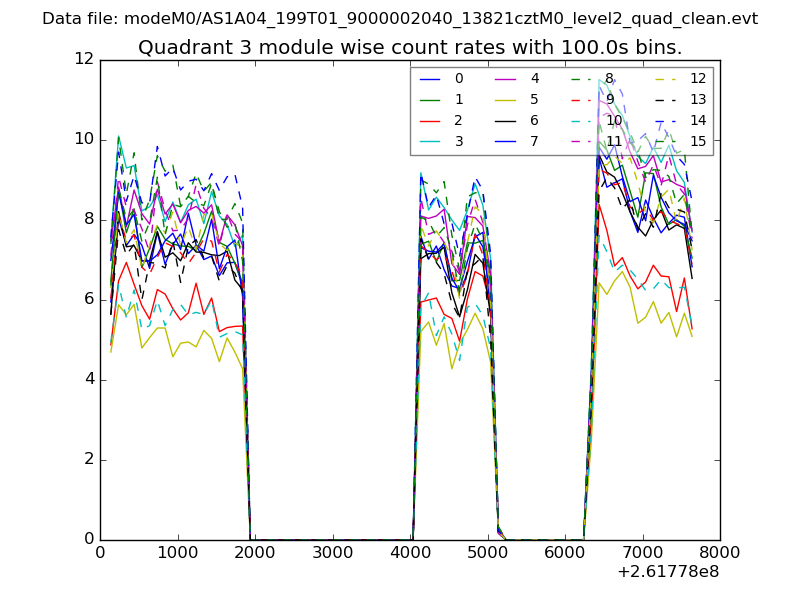
| Module-wise count rates for Quadrant A Data is divided into 100 sec bins |
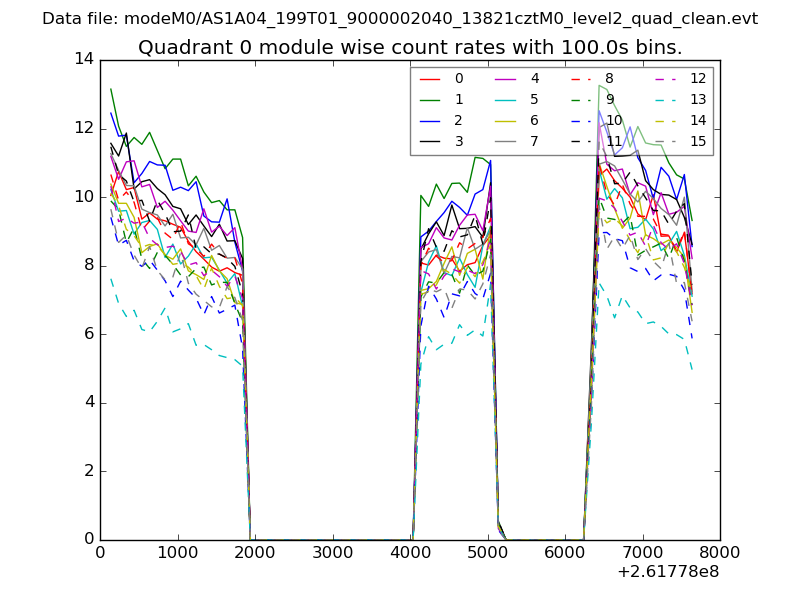 |
 |
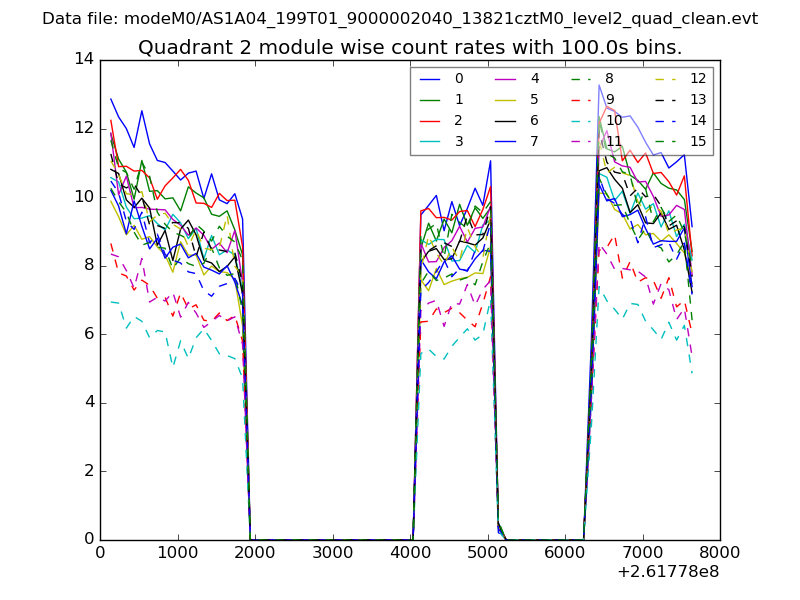
| Module-wise count rates for Quadrant B Data is divided into 100 sec bins |
 |
 |
| Module-wise count rates for Quadrant C Data is divided into 100 sec bins |
 |
 |
| Module-wise count rates for Quadrant D Data is divided into 100 sec bins |
 |
 |
| Parameter | Plot |
|---|---|
| CZT HV Monitor | 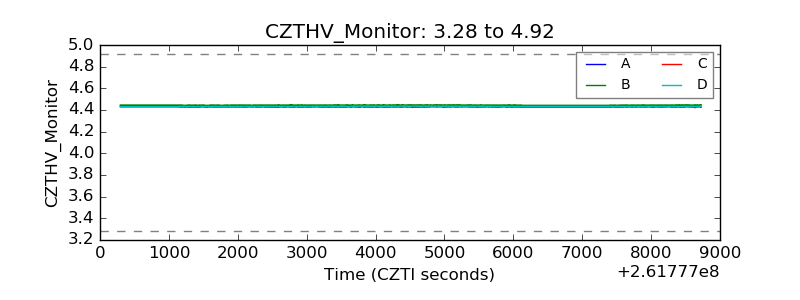 |
| D_VDD | 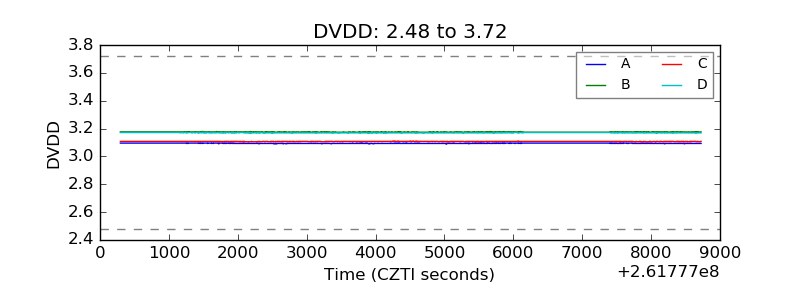 |
| Temperature 1 | 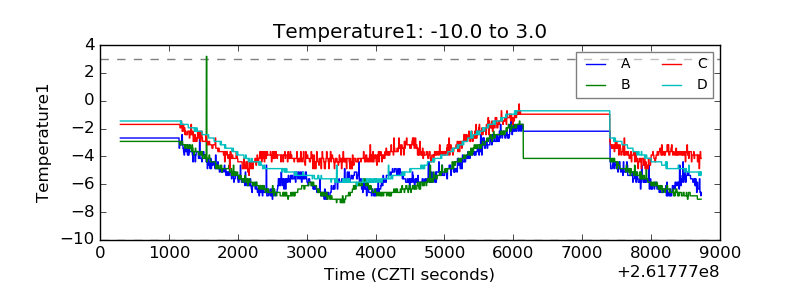 |
| Veto HV Monitor | 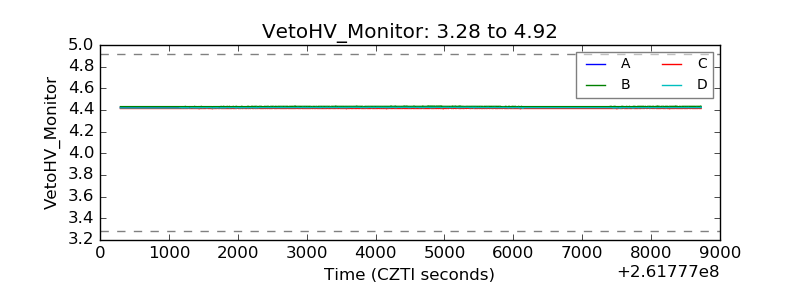 |
| Veto LLD | 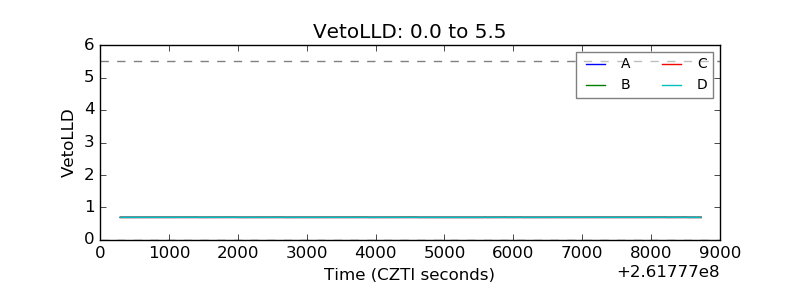 |
| Alpha Counter | 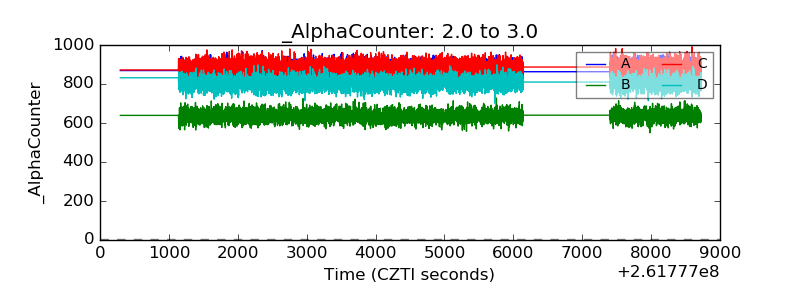 |
| _CPM_Rate | 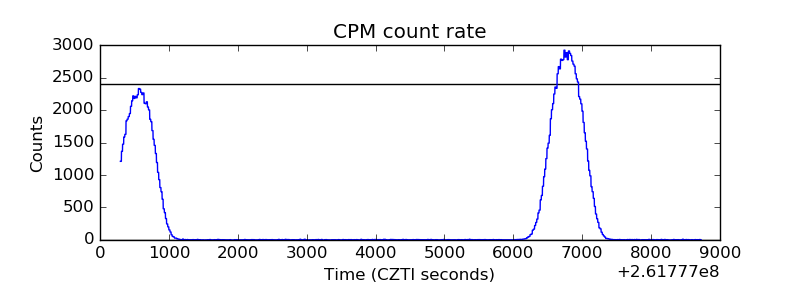 |
| CZT Counter | 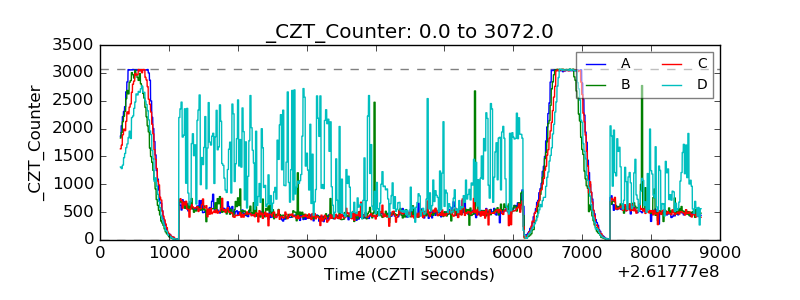 |
| +2.5 Volts monitor |  |
| +5 Volts monitor |  |
| _ROLL_ROT | 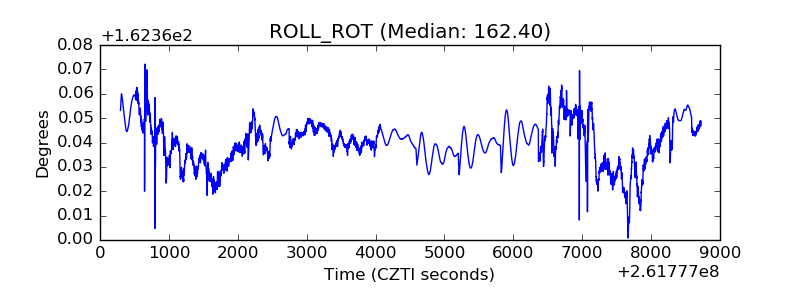 |
| _Roll_DEC | 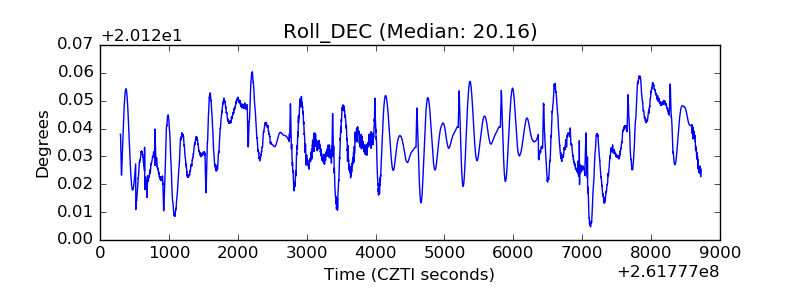 |
| _Roll_RA | 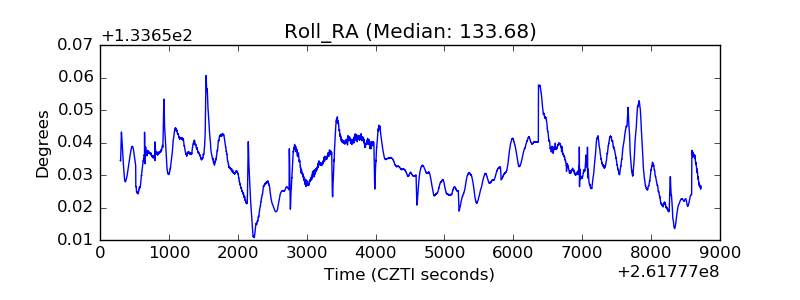 |
| Veto Counter | 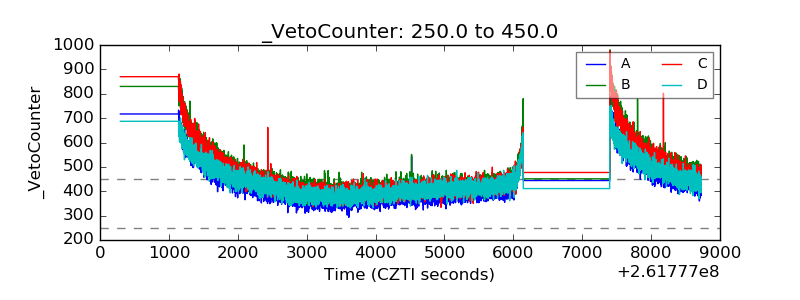 |