| Param | Original file | Final file |
|---|---|---|
| Filename | modeM0/AS1A04_199T01_9000002040_13824cztM0_level2.evt | modeM0/AS1A04_199T01_9000002040_13824cztM0_level2_quad_clean.evt |
| Size (bytes) | 515,848,320 | 71,187,840 |
| Size | 492.0 MB | 67.9 MB |
| Events in quadrant A | 3,315,491 | 429,813 |
| Events in quadrant B | 3,537,781 | 438,675 |
| Events in quadrant C | 3,313,483 | 422,830 |
| Events in quadrant D | 4,999,614 | 395,474 |
| Mode M9 | |||
|---|---|---|---|
| Quadrant | BADHDUFLAG | Total packets | Discarded packets |
| A | 0 | 26 | 0 |
| B | 0 | 26 | 0 |
| C | 0 | 26 | 0 |
| D | 0 | 26 | 0 |
| Mode SS | |||
|---|---|---|---|
| Quadrant | BADHDUFLAG | Total packets | Discarded packets |
| A | 0 | 138 | 0 |
| B | 0 | 138 | 0 |
| C | 0 | 138 | 0 |
| D | 0 | 138 | 0 |
| Mode M0 | |||
|---|---|---|---|
| Quadrant | BADHDUFLAG | Total packets | Discarded packets |
| A | 0 | 13953 | 3 |
| B | 0 | 14545 | 2 |
| C | 0 | 13987 | 2 |
| D | 0 | 19290 | 2 |
| Quadrant | Total seconds | Saturated seconds | Saturation percentage |
|---|---|---|---|
| A | 6725 | 62 | 0.921933% |
| B | 6725 | 116 | 1.724907% |
| C | 6725 | 48 | 0.713755% |
| D | 6725 | 140 | 2.081784% |
Noise dominated data is calculated using 1-second bins in cleaned event files. If a bin has >2000 counts, and if more than 50% of those come from <1% of pixels, then it is considered to be noise-dominated and hence unusable.
| Quadrant | # 1 sec bins | Bins with >0 counts | Bins with >2000 counts | High rate bins dominated by noise | Noise dominated (total time) | Noise dominated (detector-on time) | Marked lightcurve |
|---|---|---|---|---|---|---|---|
| A | 9306 | 6727 | 0 | 0 | 0.00% | 0.00% | 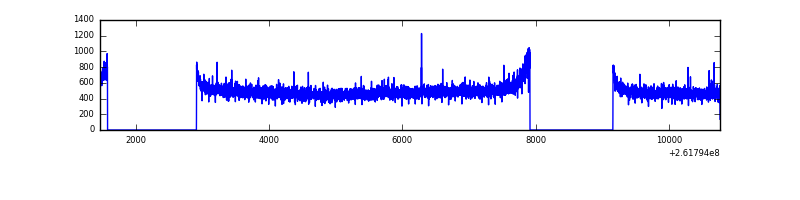 |
| B | 9306 | 6727 | 13 | 13 | 0.14% | 0.19% | 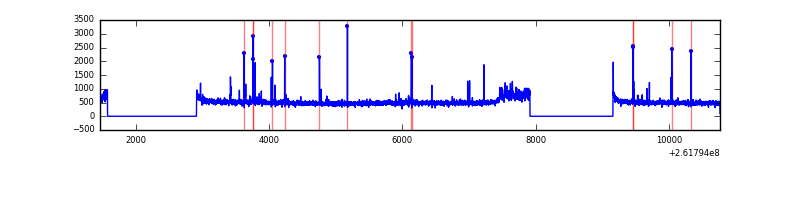 |
| C | 9306 | 6728 | 1 | 1 | 0.01% | 0.01% | 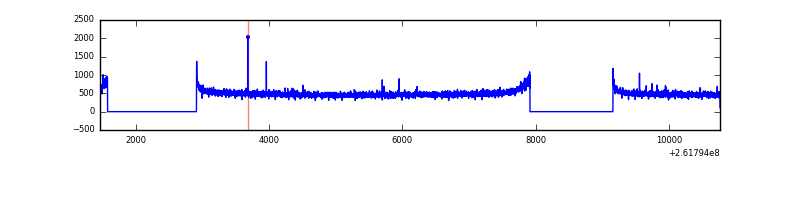 |
| D | 9306 | 6728 | 60 | 60 | 0.64% | 0.89% | 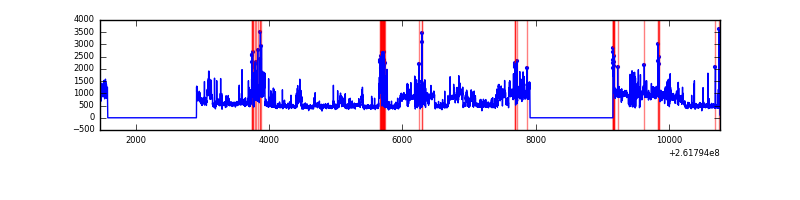 |
Top three noisy pixels from each quadrant. If the there are fewer than three noisy pixels in the level2.evt file, extra rows are filled as -1
| Pixel properties | Quadrant properties | ||||||
|---|---|---|---|---|---|---|---|
| Quadrant | DetID | PixID | Counts | Sigma | Mean | Median | Sigma |
| A | 1 | 162 | 14566 | 78.65 | 856 | 838 | 174.6 |
| A | 0 | 226 | 7720 | 39.43 | 856 | 838 | 174.6 |
| A | 12 | 194 | 6336 | 31.5 | 856 | 838 | 174.6 |
| B | 10 | 244 | 79598 | 484.18 | 861 | 841 | 162.7 |
| B | 4 | 80 | 34494 | 206.89 | 861 | 841 | 162.7 |
| B | 4 | 173 | 25046 | 148.81 | 861 | 841 | 162.7 |
| C | 3 | 233 | 77925 | 405.01 | 826 | 832 | 190.4 |
| C | 4 | 175 | 8876 | 42.26 | 826 | 832 | 190.4 |
| C | 13 | 61 | 6041 | 27.37 | 826 | 832 | 190.4 |
| D | 10 | 157 | 1541552 | 7784.22 | 813 | 791 | 197.9 |
| D | 1 | 52 | 125097 | 628.02 | 813 | 791 | 197.9 |
| D | 5 | 222 | 102588 | 514.3 | 813 | 791 | 197.9 |
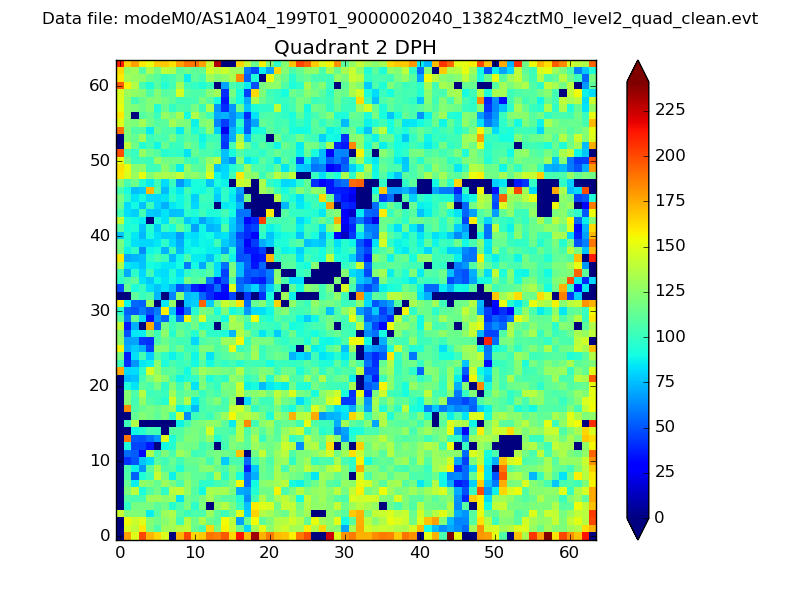
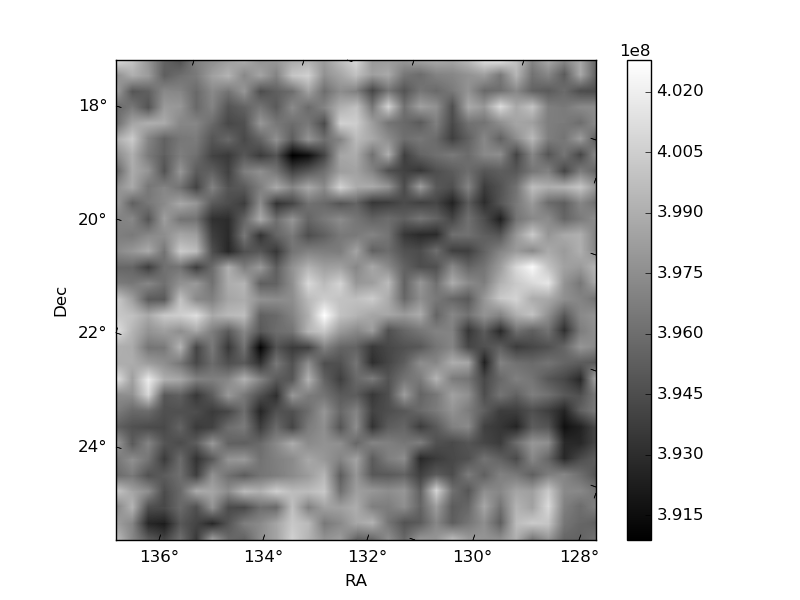
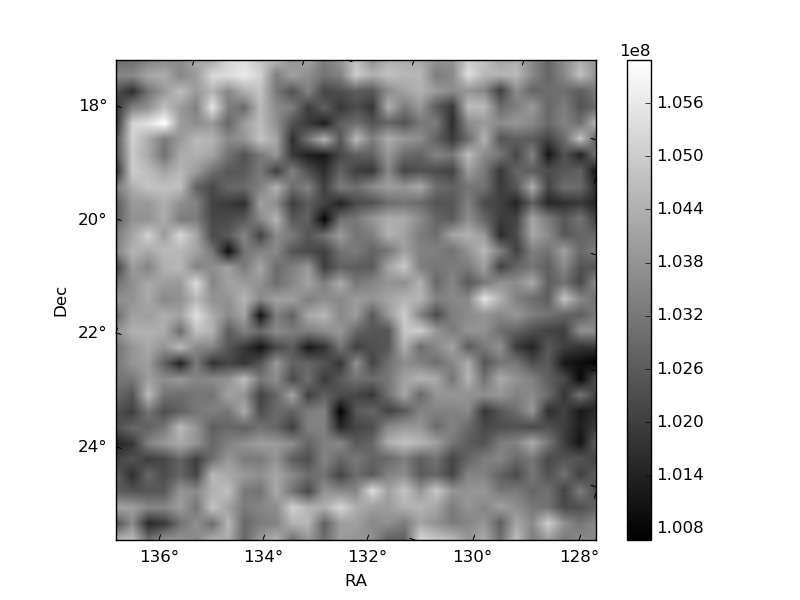
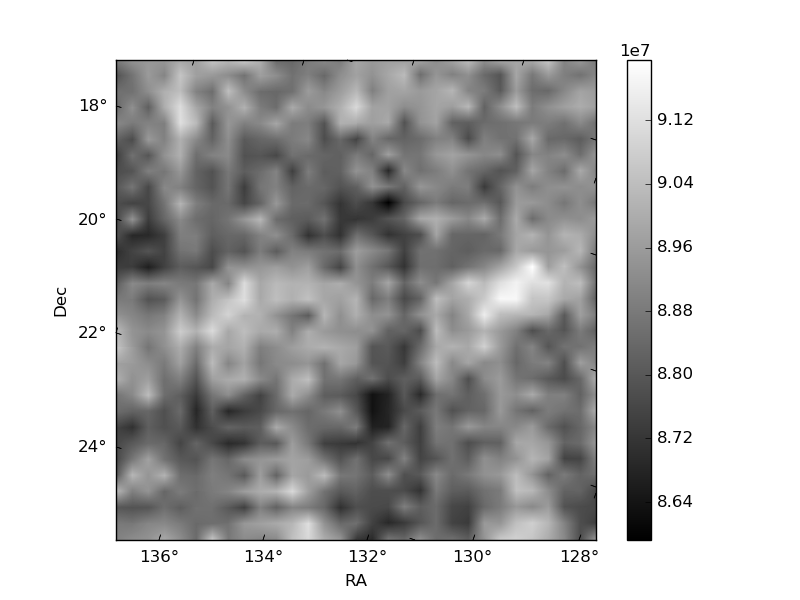
Histogram calculated using DETX and DETY for each event in the final _common_clean file
| Quadrant A | 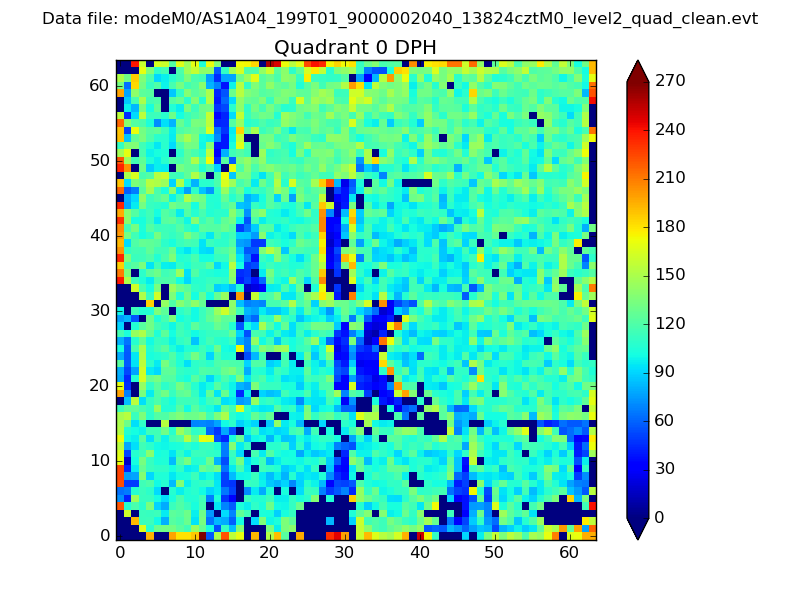 |
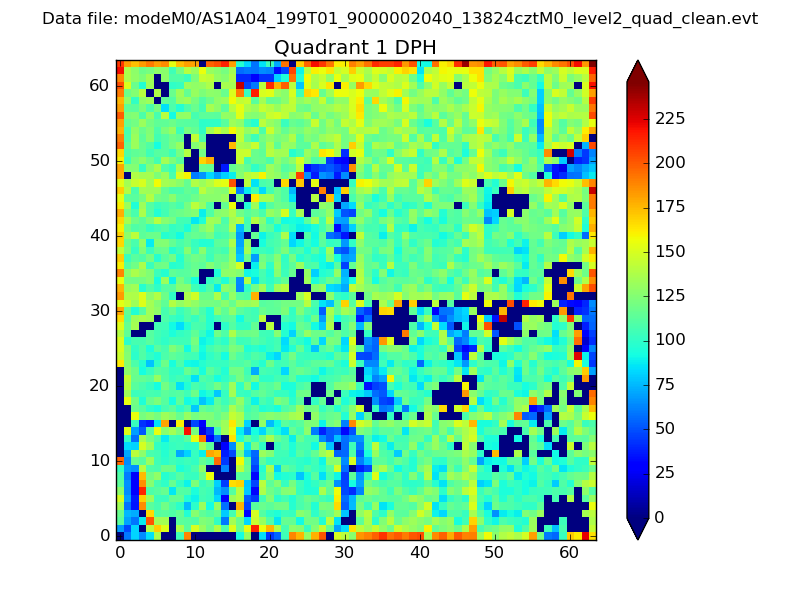 |
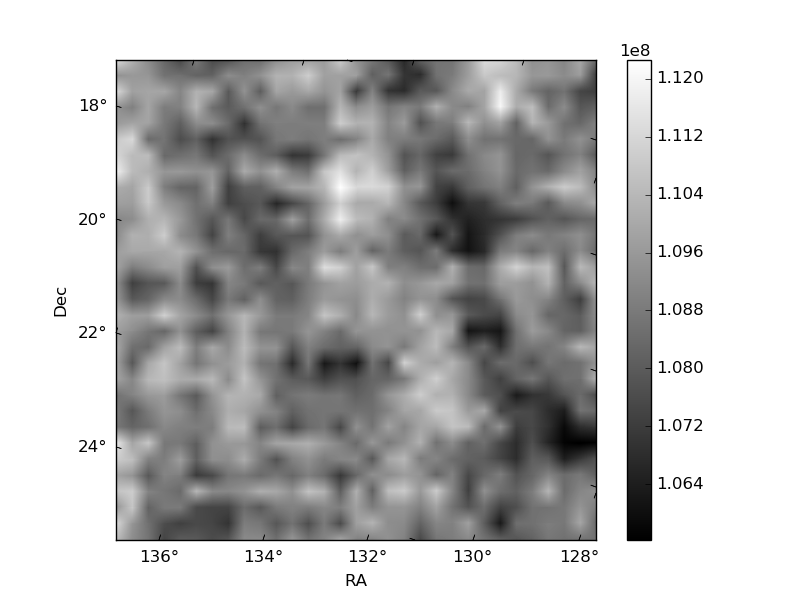
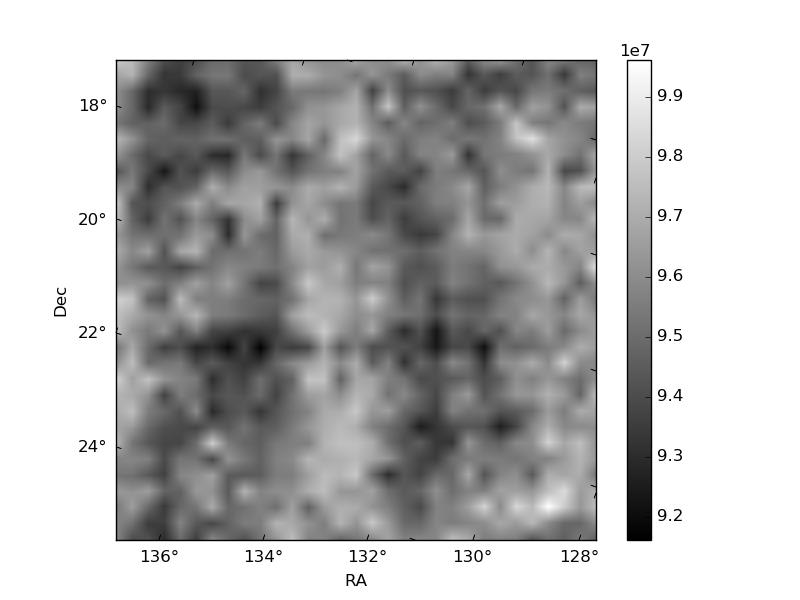
Quadrant B |
|---|---|---|---|
| Quadrant D | 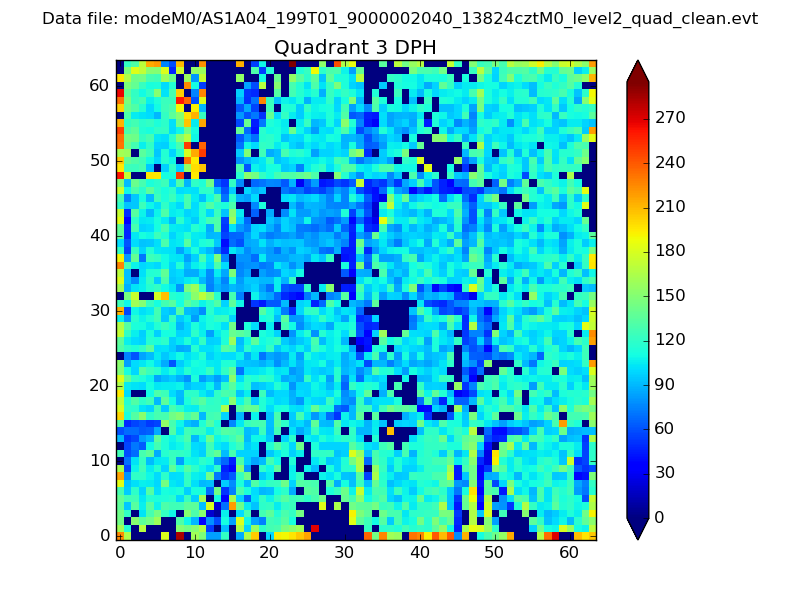 |
 |
Quadrant C |
| Plot type | Count rate plots | Images |
|---|---|---|
| Comparison with Poisson distribution Blue bars denote a histogram of data divided into 1 sec bins. Red curve is a Poisson curve with rate = median count rate of data. |
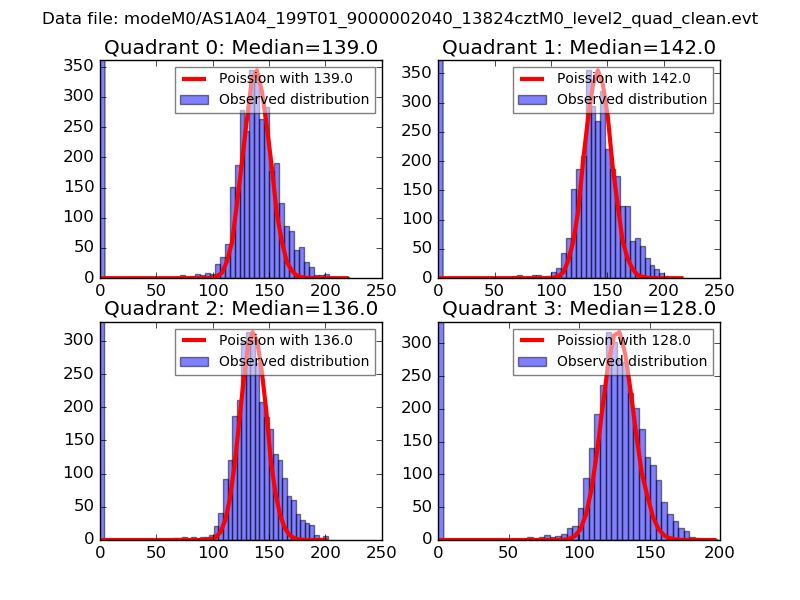 |
 |
| Quadrant-wise count rates Data is divided into 100 sec bins |
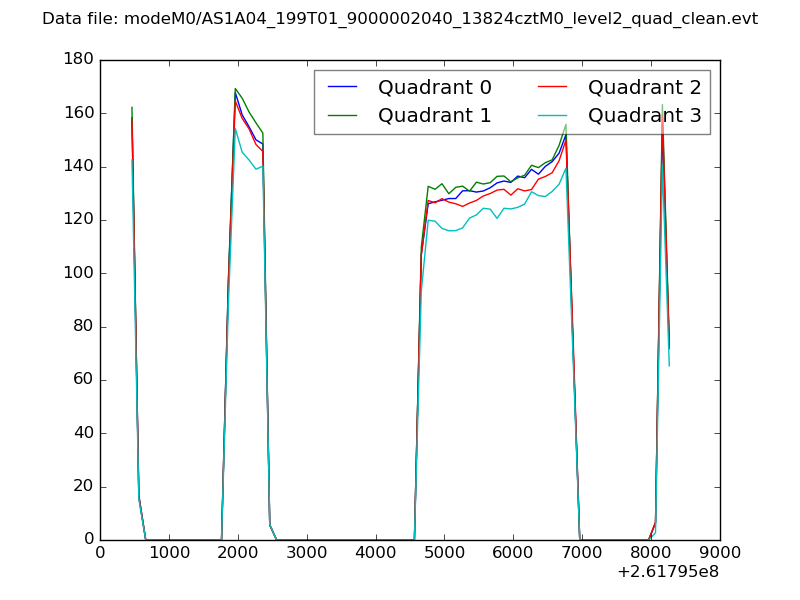 |
|
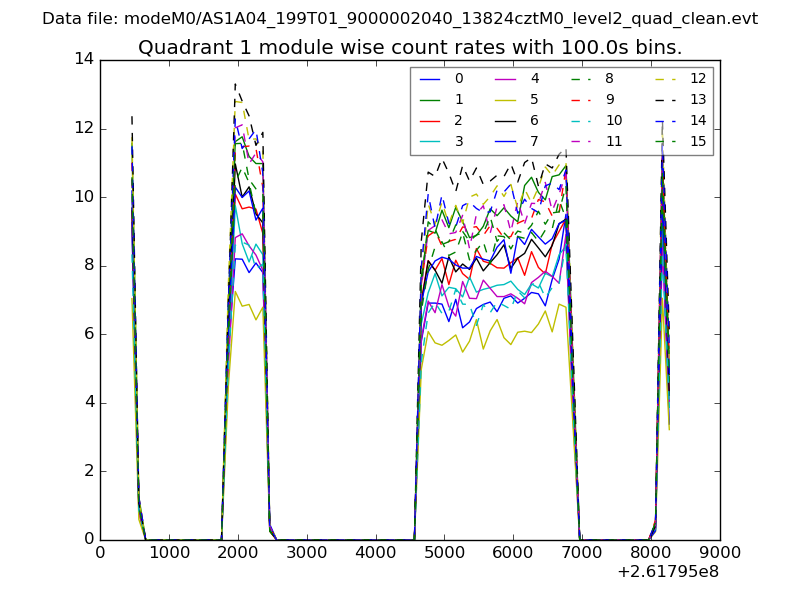
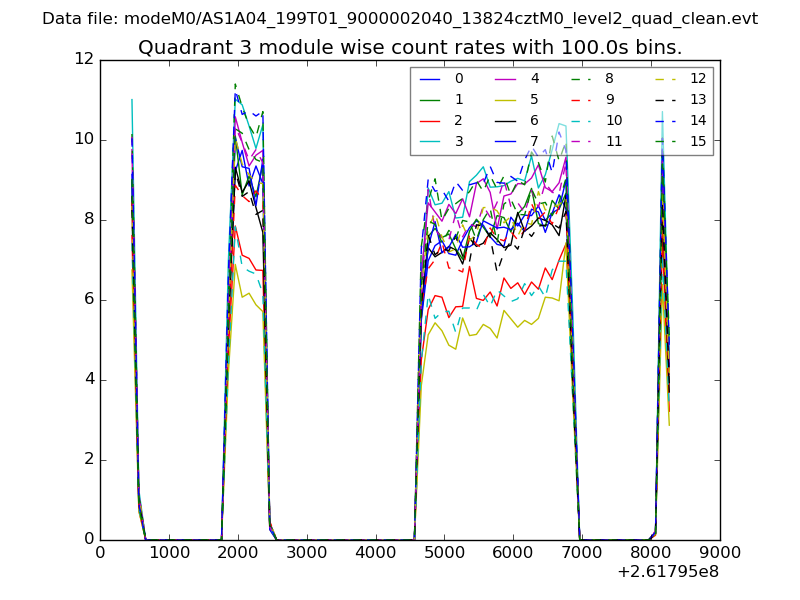
| Module-wise count rates for Quadrant A Data is divided into 100 sec bins |
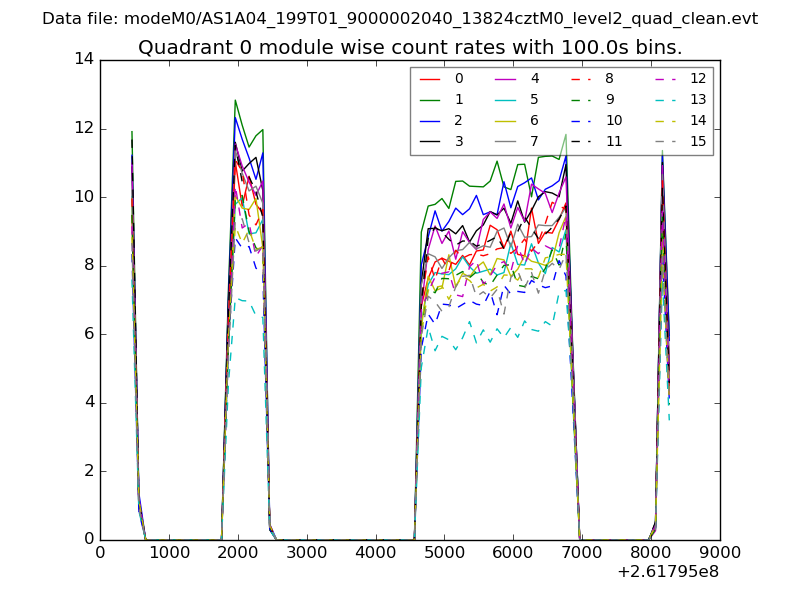 |
 |
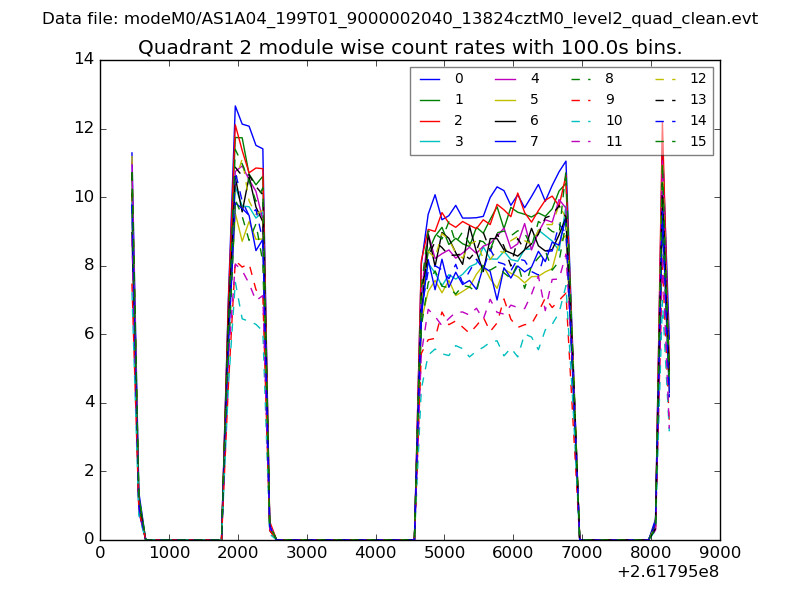
| Module-wise count rates for Quadrant B Data is divided into 100 sec bins |
 |
 |
| Module-wise count rates for Quadrant C Data is divided into 100 sec bins |
 |
 |
| Module-wise count rates for Quadrant D Data is divided into 100 sec bins |
 |
 |
| Parameter | Plot |
|---|---|
| CZT HV Monitor | 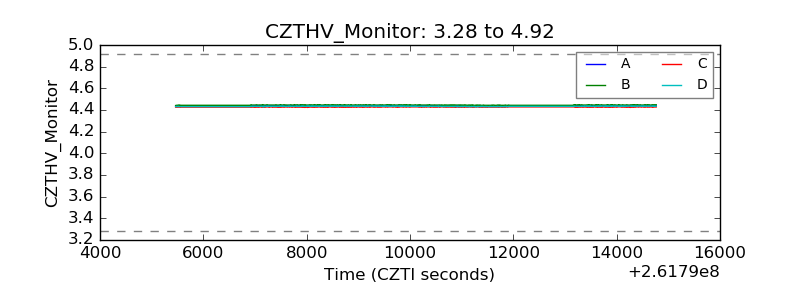 |
| D_VDD | 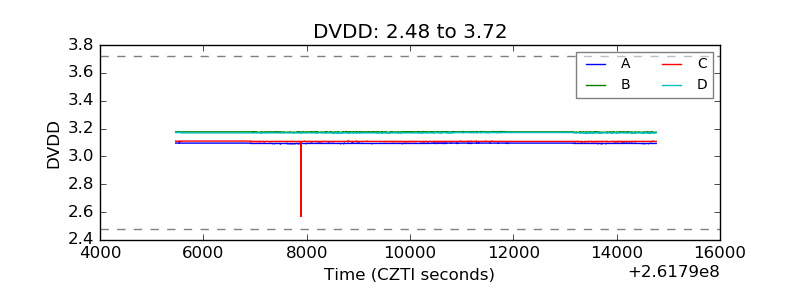 |
| Temperature 1 | 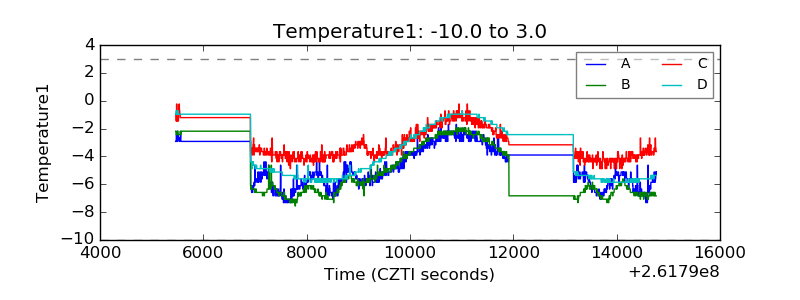 |
| Veto HV Monitor | 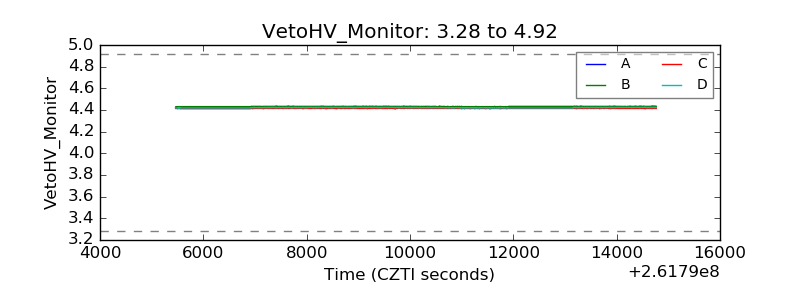 |
| Veto LLD | 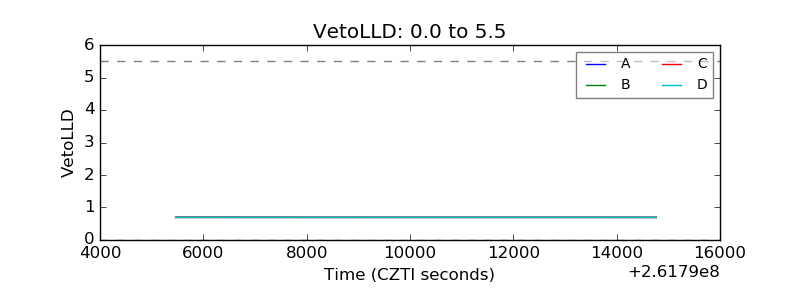 |
| Alpha Counter | 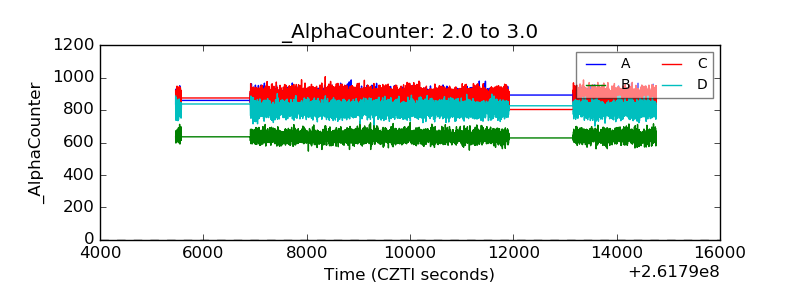 |
| _CPM_Rate | 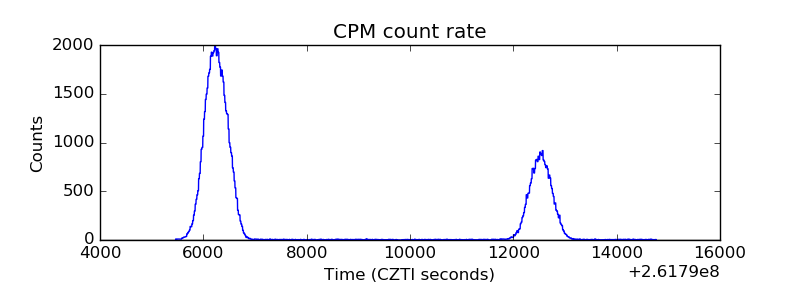 |
| CZT Counter | 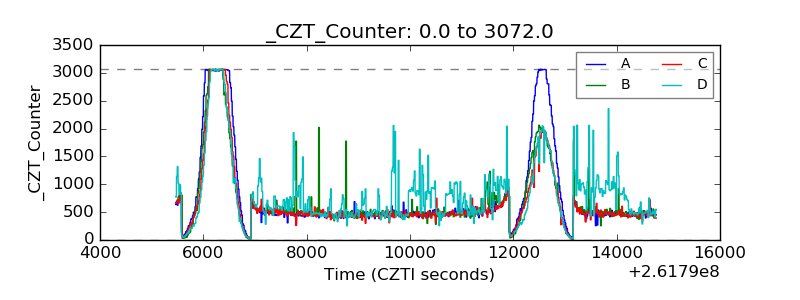 |
| +2.5 Volts monitor | 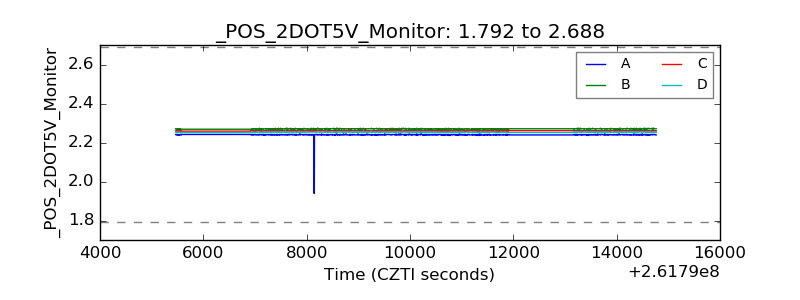 |
| +5 Volts monitor |  |
| _ROLL_ROT | 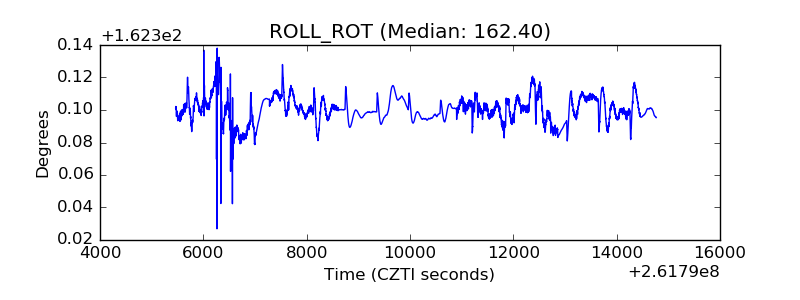 |
| _Roll_DEC | 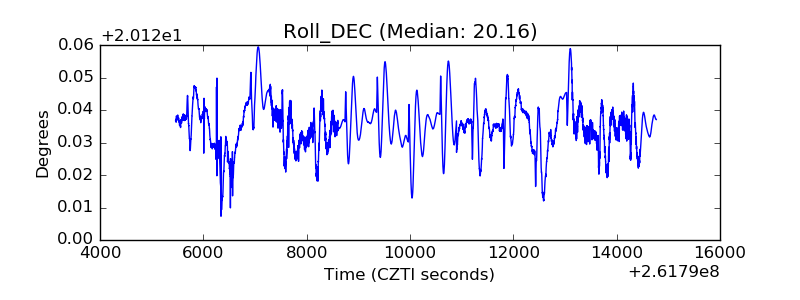 |
| _Roll_RA | 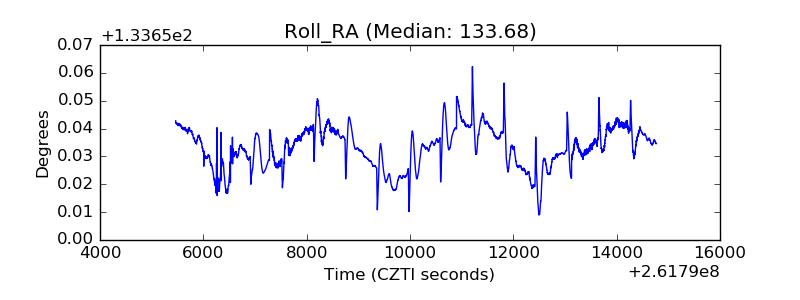 |
| Veto Counter | 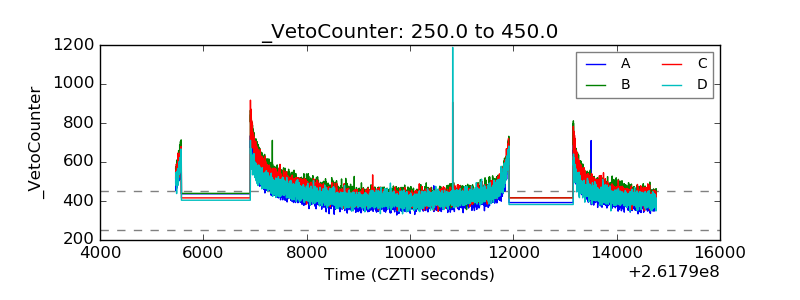 |