| Param | Original file | Final file |
|---|---|---|
| Filename | modeM0/AS1A04_199T01_9000002040_13825cztM0_level2.evt | modeM0/AS1A04_199T01_9000002040_13825cztM0_level2_quad_clean.evt |
| Size (bytes) | 544,201,920 | 66,767,040 |
| Size | 519.0 MB | 63.7 MB |
| Events in quadrant A | 3,288,334 | 395,057 |
| Events in quadrant B | 3,727,314 | 400,094 |
| Events in quadrant C | 3,260,332 | 391,466 |
| Events in quadrant D | 5,742,277 | 358,771 |
| Mode M9 | |||
|---|---|---|---|
| Quadrant | BADHDUFLAG | Total packets | Discarded packets |
| A | 0 | 20 | 0 |
| B | 0 | 20 | 0 |
| C | 0 | 20 | 0 |
| D | 0 | 21 | 0 |
| Mode SS | |||
|---|---|---|---|
| Quadrant | BADHDUFLAG | Total packets | Discarded packets |
| A | 0 | 138 | 0 |
| B | 0 | 138 | 0 |
| C | 0 | 138 | 0 |
| D | 0 | 138 | 0 |
| Mode M0 | |||
|---|---|---|---|
| Quadrant | BADHDUFLAG | Total packets | Discarded packets |
| A | 0 | 14084 | 3 |
| B | 0 | 15294 | 2 |
| C | 0 | 14063 | 2 |
| D | 0 | 21764 | 2 |
| Quadrant | Total seconds | Saturated seconds | Saturation percentage |
|---|---|---|---|
| A | 6833 | 72 | 1.053710% |
| B | 6833 | 130 | 1.902532% |
| C | 6833 | 47 | 0.687838% |
| D | 6833 | 332 | 4.858774% |
Noise dominated data is calculated using 1-second bins in cleaned event files. If a bin has >2000 counts, and if more than 50% of those come from <1% of pixels, then it is considered to be noise-dominated and hence unusable.
| Quadrant | # 1 sec bins | Bins with >0 counts | Bins with >2000 counts | High rate bins dominated by noise | Noise dominated (total time) | Noise dominated (detector-on time) | Marked lightcurve |
|---|---|---|---|---|---|---|---|
| A | 7794 | 6835 | 0 | 0 | 0.00% | 0.00% | 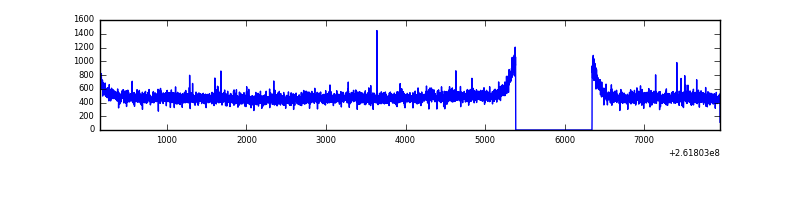 |
| B | 7794 | 6835 | 16 | 16 | 0.21% | 0.23% | 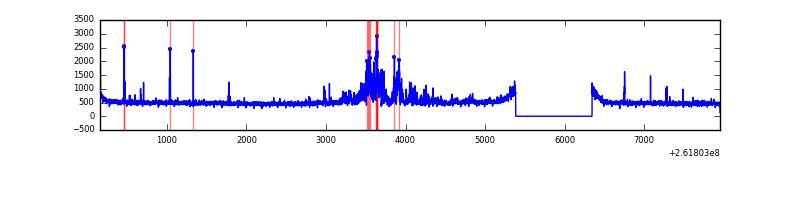 |
| C | 7794 | 6835 | 0 | 0 | 0.00% | 0.00% | 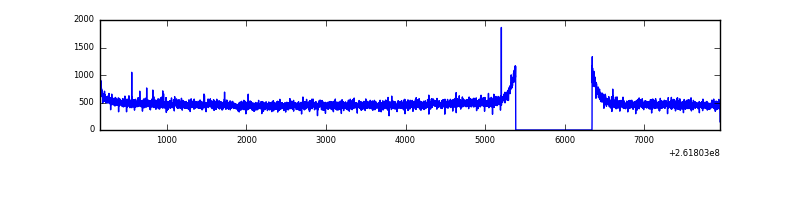 |
| D | 7794 | 6834 | 243 | 243 | 3.12% | 3.56% | 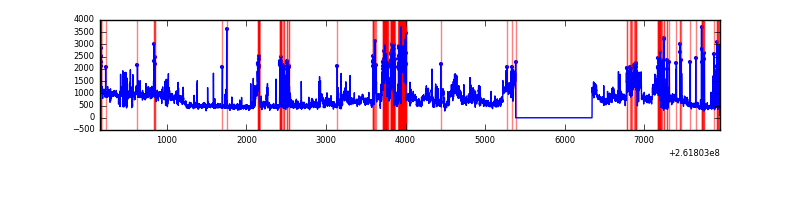 |
Top three noisy pixels from each quadrant. If the there are fewer than three noisy pixels in the level2.evt file, extra rows are filled as -1
| Pixel properties | Quadrant properties | ||||||
|---|---|---|---|---|---|---|---|
| Quadrant | DetID | PixID | Counts | Sigma | Mean | Median | Sigma |
| A | 1 | 162 | 19345 | 106.97 | 845 | 826 | 173.1 |
| A | 0 | 226 | 7938 | 41.08 | 845 | 826 | 173.1 |
| A | 1 | 178 | 6702 | 33.94 | 845 | 826 | 173.1 |
| B | 0 | 219 | 359726 | 2220.35 | 847 | 829 | 161.6 |
| B | 4 | 80 | 26263 | 157.35 | 847 | 829 | 161.6 |
| B | 12 | 111 | 19189 | 113.59 | 847 | 829 | 161.6 |
| C | 3 | 233 | 65615 | 342.38 | 817 | 823 | 189.2 |
| C | 13 | 61 | 5800 | 26.3 | 817 | 823 | 189.2 |
| C | 4 | 175 | 5791 | 26.25 | 817 | 823 | 189.2 |
| D | 10 | 157 | 1681888 | 8341.77 | 796 | 776 | 201.5 |
| D | 13 | 122 | 662725 | 3284.63 | 796 | 776 | 201.5 |
| D | 1 | 52 | 162864 | 804.29 | 796 | 776 | 201.5 |
Histogram calculated using DETX and DETY for each event in the final _common_clean file
| Quadrant A | 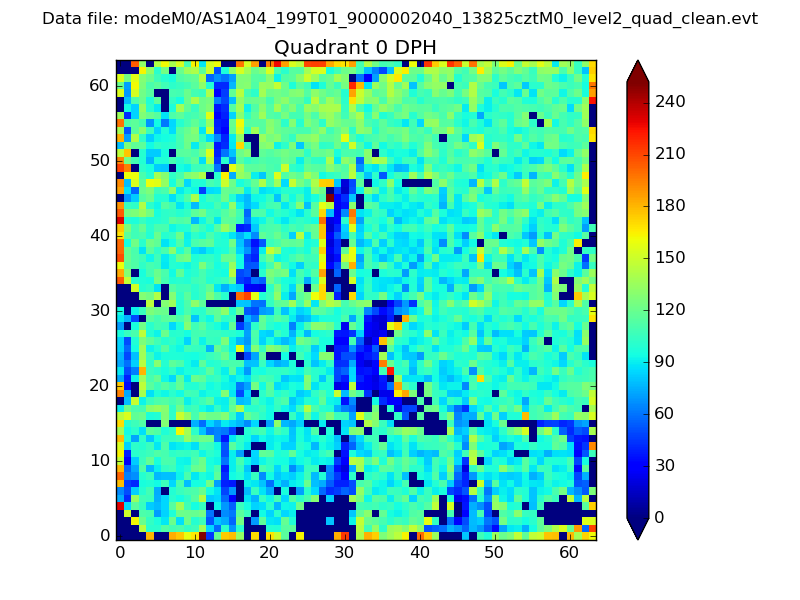 |
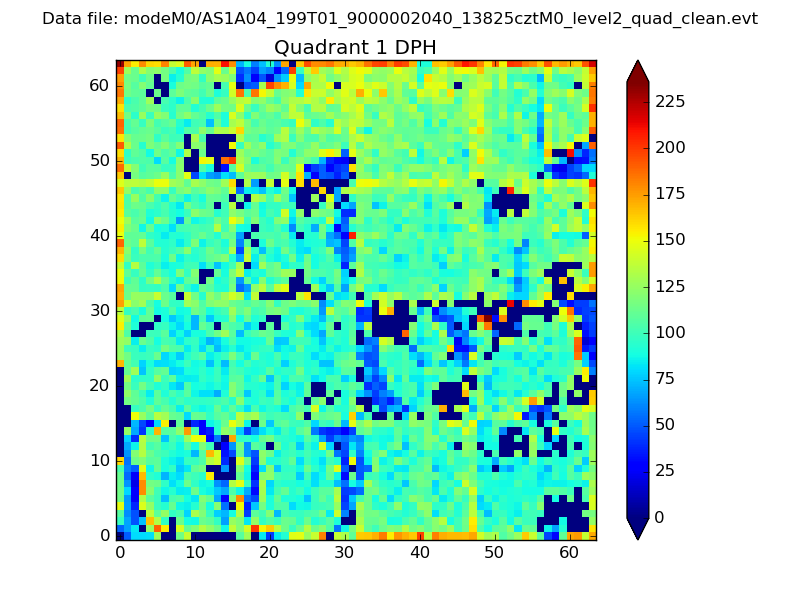 |
Quadrant B |
|---|---|---|---|
| Quadrant D | 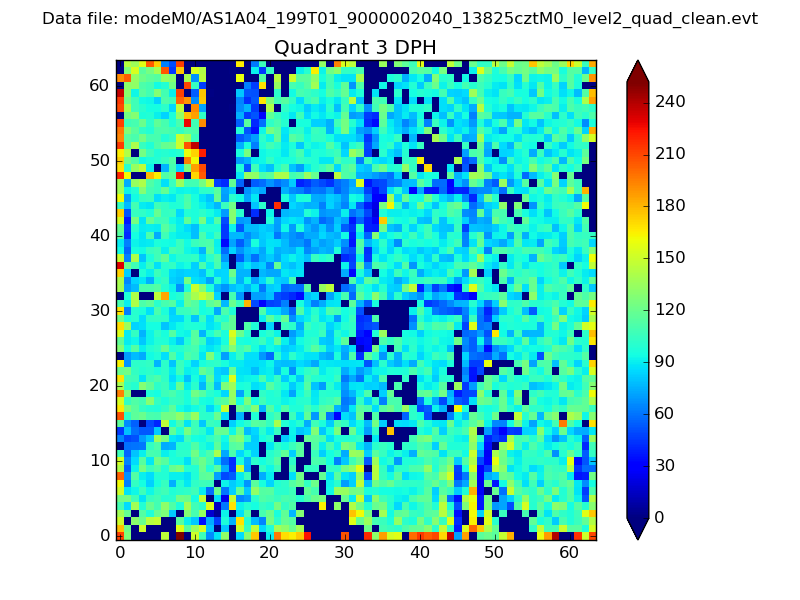 |
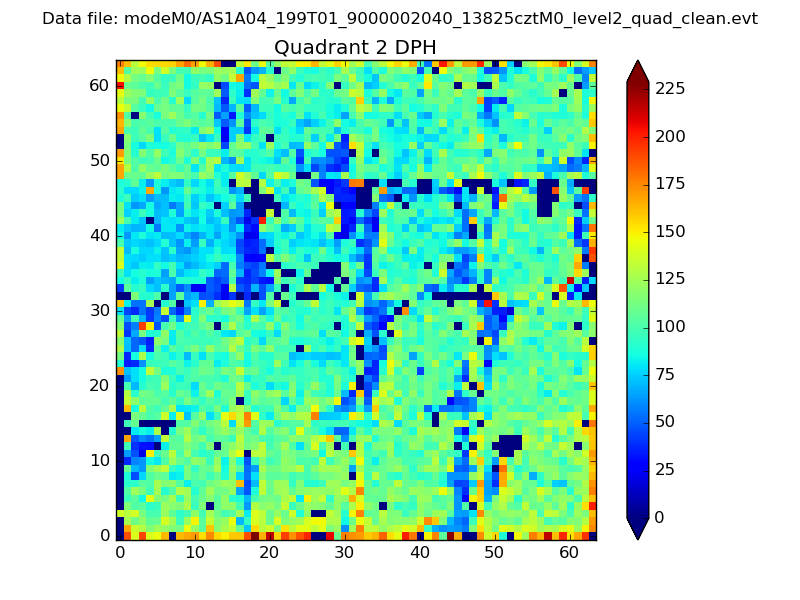 |
Quadrant C |
| Plot type | Count rate plots | Images |
|---|---|---|
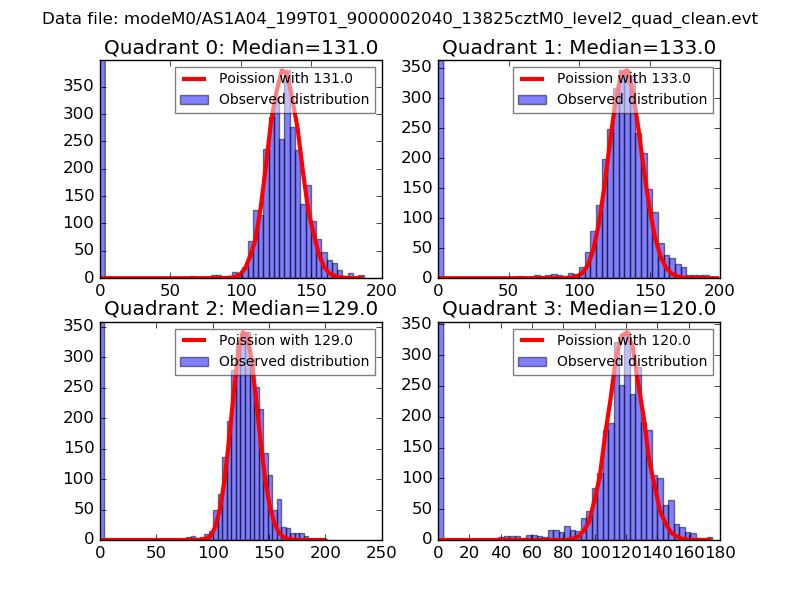
| Comparison with Poisson distribution Blue bars denote a histogram of data divided into 1 sec bins. Red curve is a Poisson curve with rate = median count rate of data. |
 |
 |
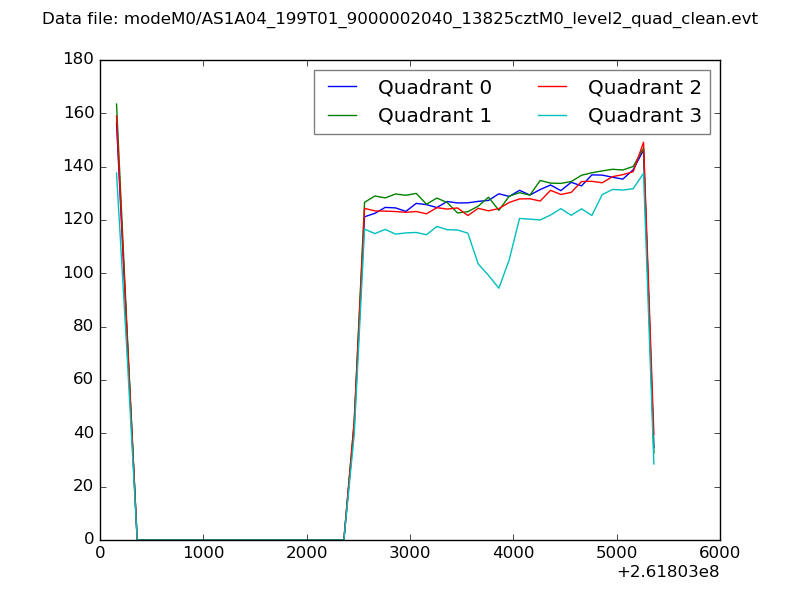
| Quadrant-wise count rates Data is divided into 100 sec bins |
 |
|
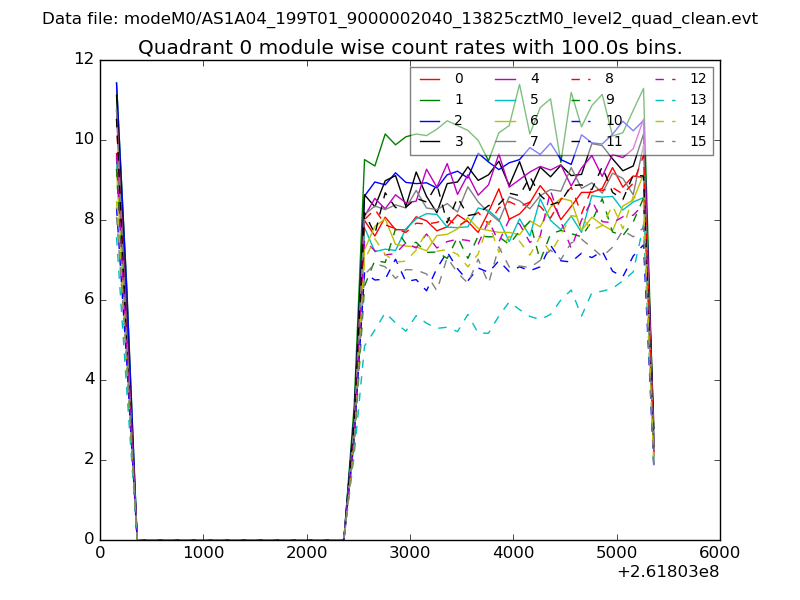
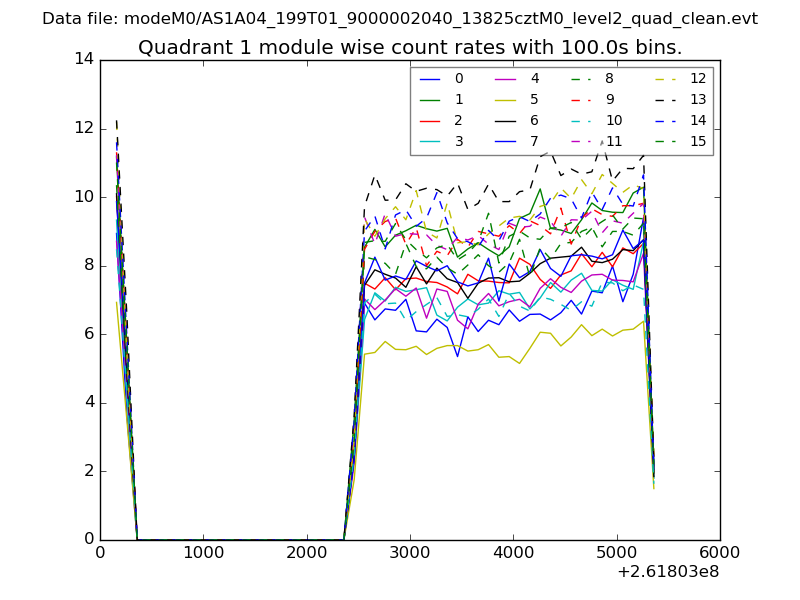
| Module-wise count rates for Quadrant A Data is divided into 100 sec bins |
 |
 |
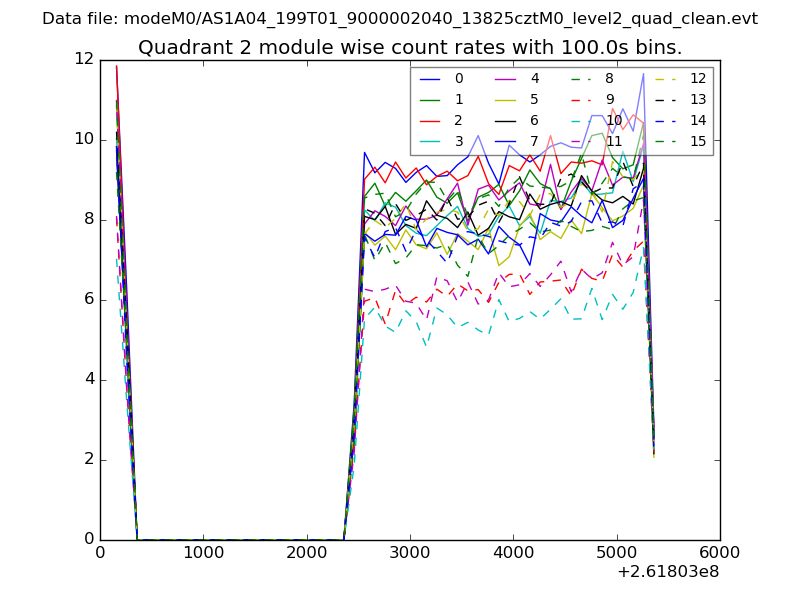
| Module-wise count rates for Quadrant B Data is divided into 100 sec bins |
 |
 |
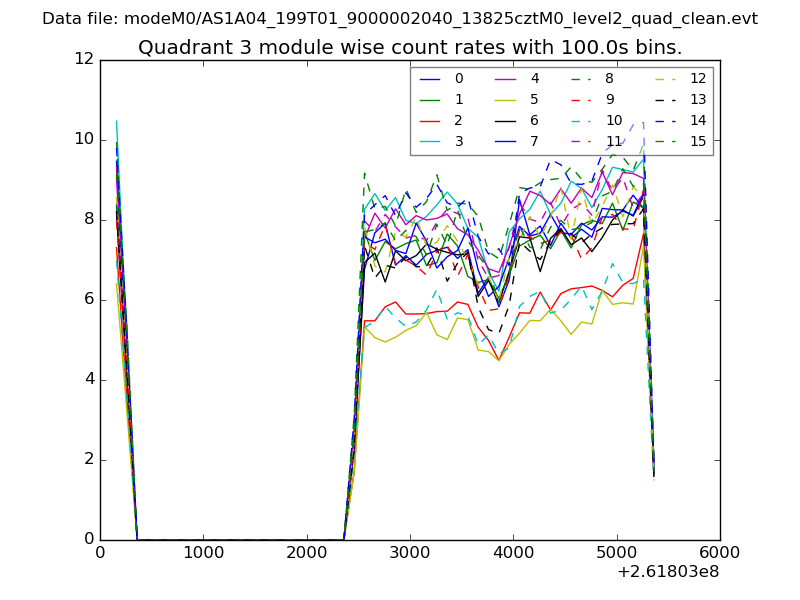
| Module-wise count rates for Quadrant C Data is divided into 100 sec bins |
 |
 |
| Module-wise count rates for Quadrant D Data is divided into 100 sec bins |
 |
 |
| Parameter | Plot |
|---|---|
| CZT HV Monitor | 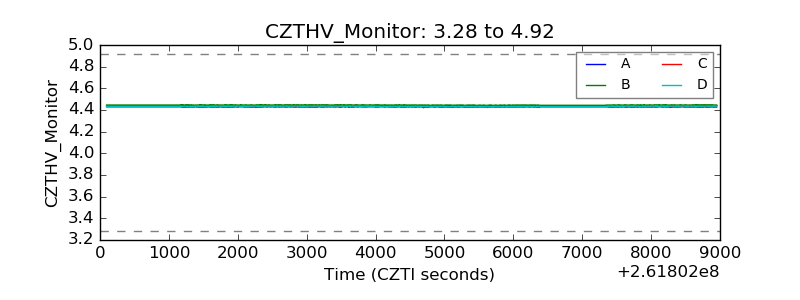 |
| D_VDD | 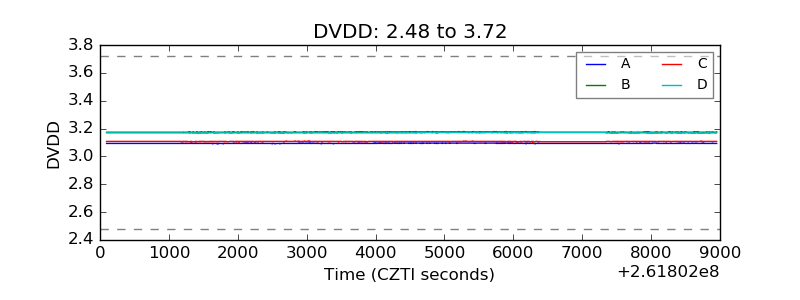 |
| Temperature 1 | 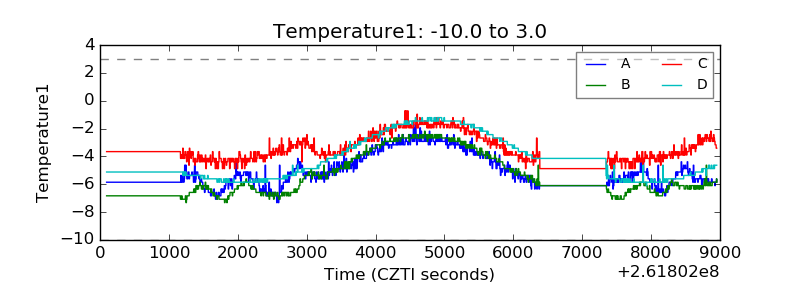 |
| Veto HV Monitor | 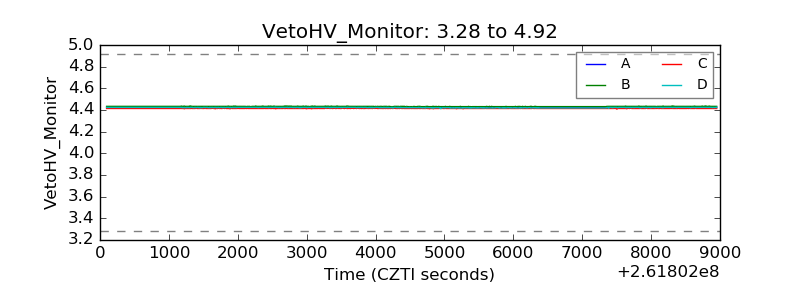 |
| Veto LLD | 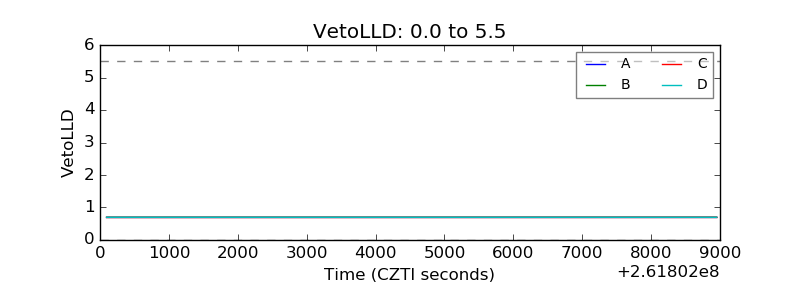 |
| Alpha Counter | 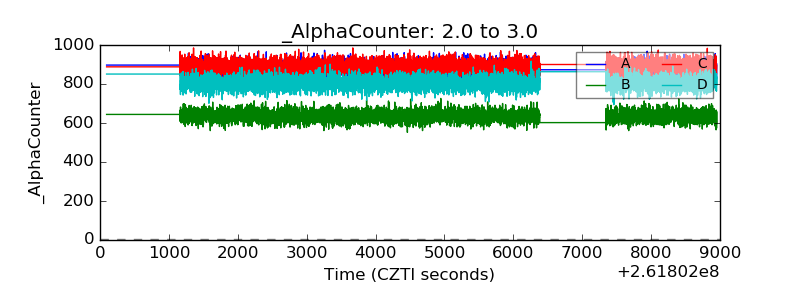 |
| _CPM_Rate | 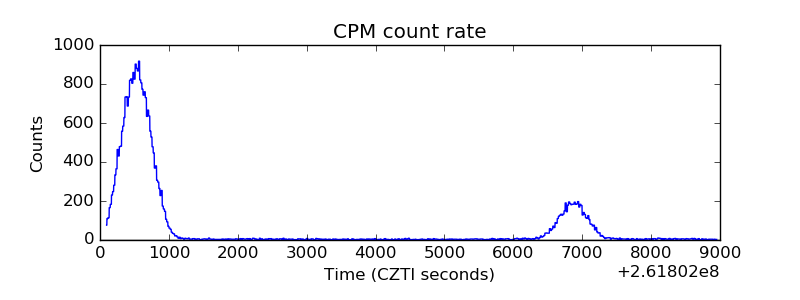 |
| CZT Counter | 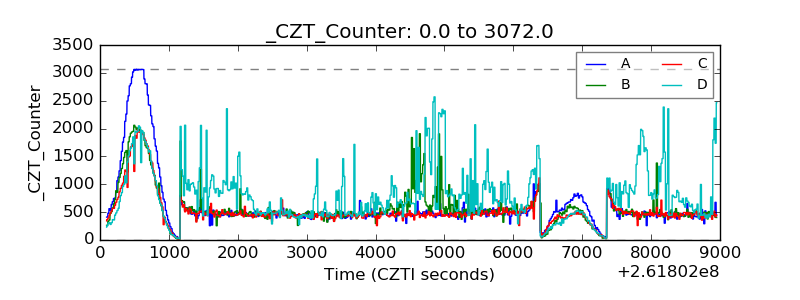 |
| +2.5 Volts monitor |  |
| +5 Volts monitor |  |
| _ROLL_ROT | 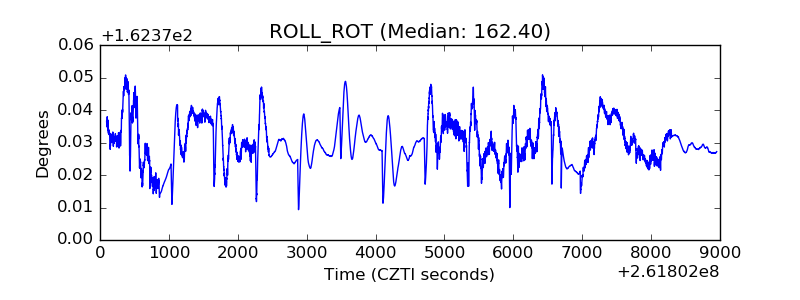 |
| _Roll_DEC | 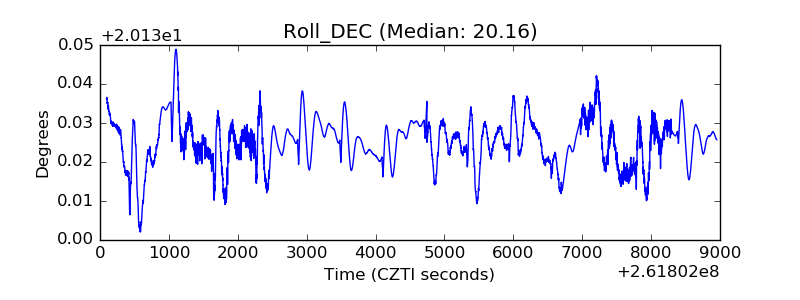 |
| _Roll_RA | 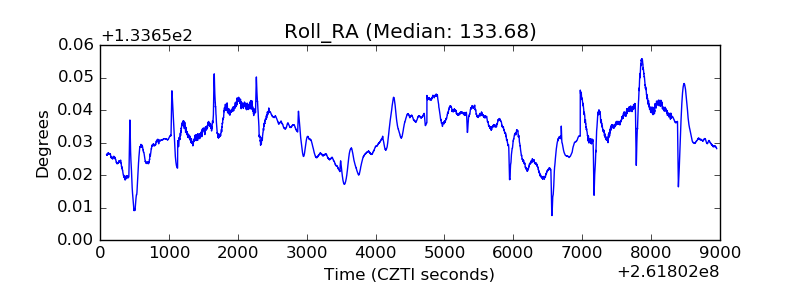 |
| Veto Counter | 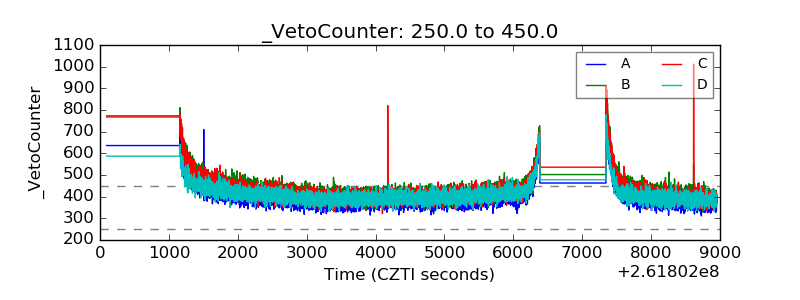 |