| Param | Original file | Final file |
|---|---|---|
| Filename | modeM0/AS1A04_199T01_9000002040_13826cztM0_level2.evt | modeM0/AS1A04_199T01_9000002040_13826cztM0_level2_quad_clean.evt |
| Size (bytes) | 575,533,440 | 75,628,800 |
| Size | 548.9 MB | 72.1 MB |
| Events in quadrant A | 3,447,363 | 453,893 |
| Events in quadrant B | 3,688,525 | 455,338 |
| Events in quadrant C | 3,439,373 | 454,243 |
| Events in quadrant D | 6,363,216 | 421,531 |
| Mode M9 | |||
|---|---|---|---|
| Quadrant | BADHDUFLAG | Total packets | Discarded packets |
| A | 0 | 7 | 0 |
| B | 0 | 7 | 0 |
| C | 0 | 7 | 0 |
| D | 0 | 8 | 0 |
| Mode SS | |||
|---|---|---|---|
| Quadrant | BADHDUFLAG | Total packets | Discarded packets |
| A | 0 | 148 | 0 |
| B | 0 | 148 | 0 |
| C | 0 | 148 | 0 |
| D | 0 | 148 | 0 |
| Mode M0 | |||
|---|---|---|---|
| Quadrant | BADHDUFLAG | Total packets | Discarded packets |
| A | 0 | 14999 | 3 |
| B | 0 | 15574 | 2 |
| C | 0 | 14992 | 2 |
| D | 0 | 24027 | 2 |
| Quadrant | Total seconds | Saturated seconds | Saturation percentage |
|---|---|---|---|
| A | 7247 | 160 | 2.207810% |
| B | 7247 | 266 | 3.670484% |
| C | 7247 | 118 | 1.628260% |
| D | 7247 | 431 | 5.947289% |
Noise dominated data is calculated using 1-second bins in cleaned event files. If a bin has >2000 counts, and if more than 50% of those come from <1% of pixels, then it is considered to be noise-dominated and hence unusable.
| Quadrant | # 1 sec bins | Bins with >0 counts | Bins with >2000 counts | High rate bins dominated by noise | Noise dominated (total time) | Noise dominated (detector-on time) | Marked lightcurve |
|---|---|---|---|---|---|---|---|
| A | 7783 | 7248 | 0 | 0 | 0.00% | 0.00% | 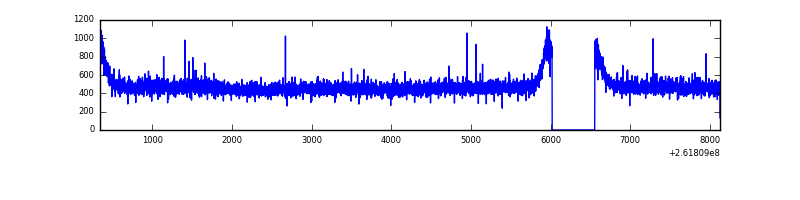 |
| B | 7783 | 7248 | 70 | 70 | 0.90% | 0.97% | 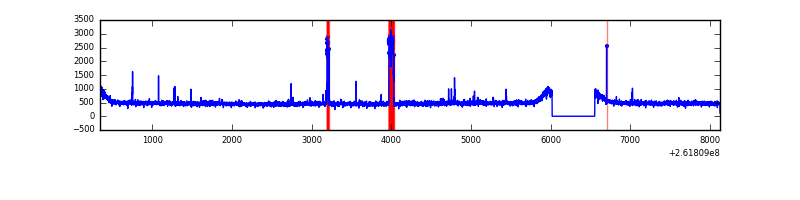 |
| C | 7783 | 7249 | 0 | 0 | 0.00% | 0.00% | 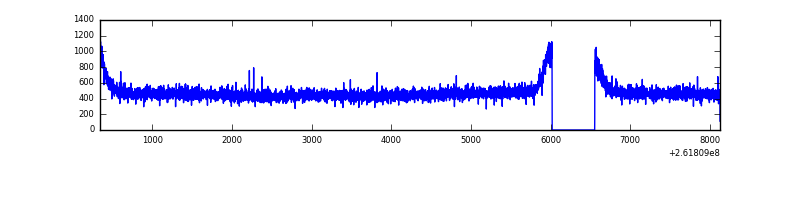 |
| D | 7783 | 7248 | 267 | 267 | 3.43% | 3.68% | 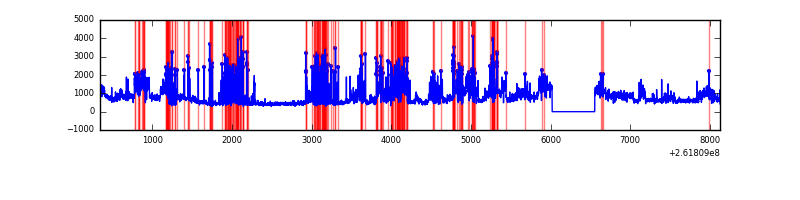 |
Top three noisy pixels from each quadrant. If the there are fewer than three noisy pixels in the level2.evt file, extra rows are filled as -1
| Pixel properties | Quadrant properties | ||||||
|---|---|---|---|---|---|---|---|
| Quadrant | DetID | PixID | Counts | Sigma | Mean | Median | Sigma |
| A | 1 | 162 | 15051 | 77.63 | 888 | 869 | 182.7 |
| A | 0 | 226 | 8275 | 40.54 | 888 | 869 | 182.7 |
| A | 0 | 23 | 7760 | 37.72 | 888 | 869 | 182.7 |
| B | 3 | 64 | 189926 | 1098.8 | 886 | 863 | 172.1 |
| B | 12 | 111 | 20572 | 114.55 | 886 | 863 | 172.1 |
| B | 4 | 173 | 17975 | 99.45 | 886 | 863 | 172.1 |
| C | 3 | 233 | 60194 | 292.57 | 866 | 871 | 202.8 |
| C | 13 | 61 | 6334 | 26.94 | 866 | 871 | 202.8 |
| C | 4 | 175 | 3574 | 13.33 | 866 | 871 | 202.8 |
| D | 10 | 157 | 2515252 | 11216.36 | 840 | 820 | 224.2 |
| D | 1 | 52 | 311094 | 1384.07 | 840 | 820 | 224.2 |
| D | 13 | 122 | 161013 | 714.59 | 840 | 820 | 224.2 |
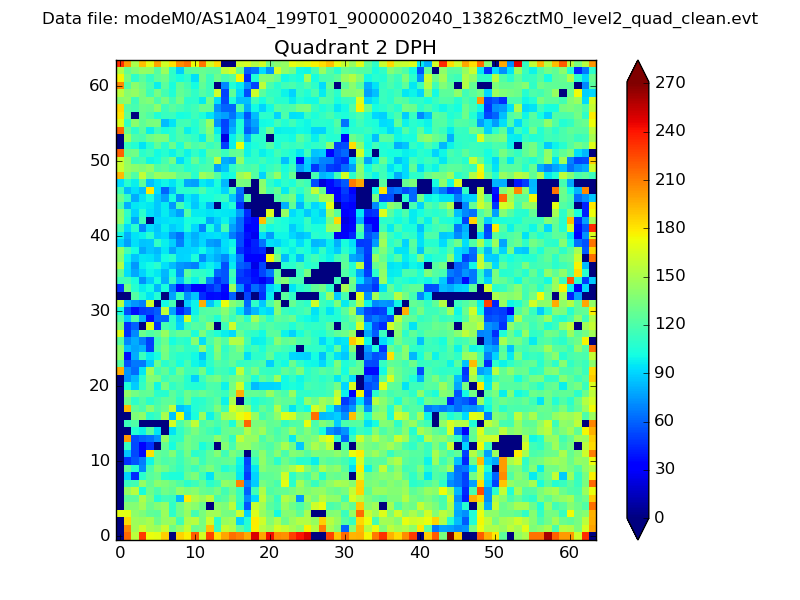
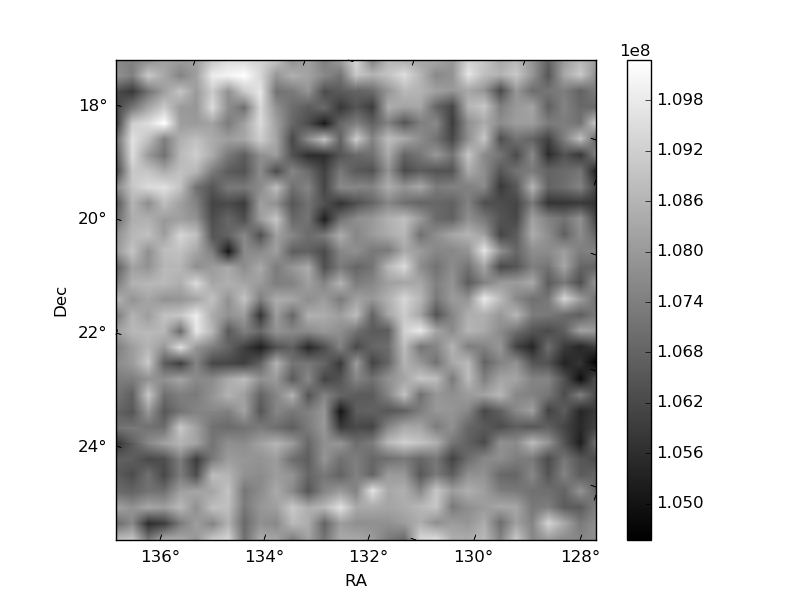
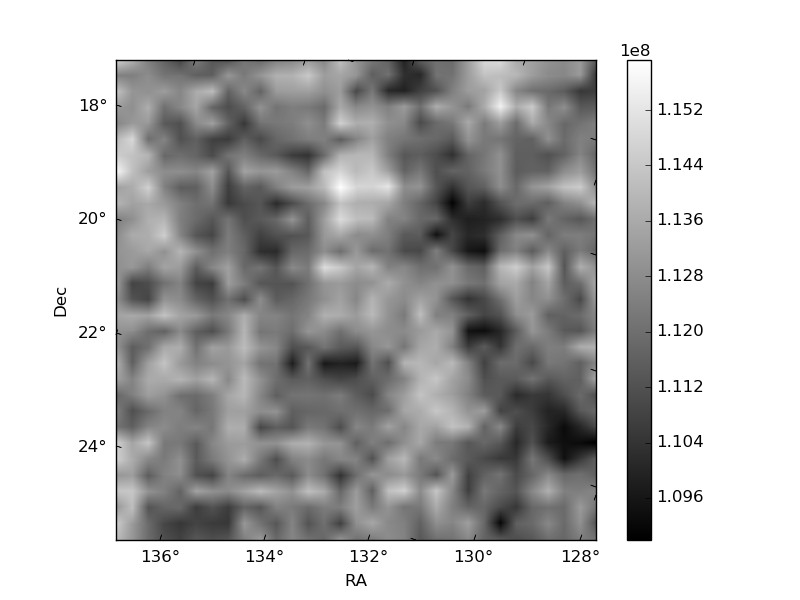
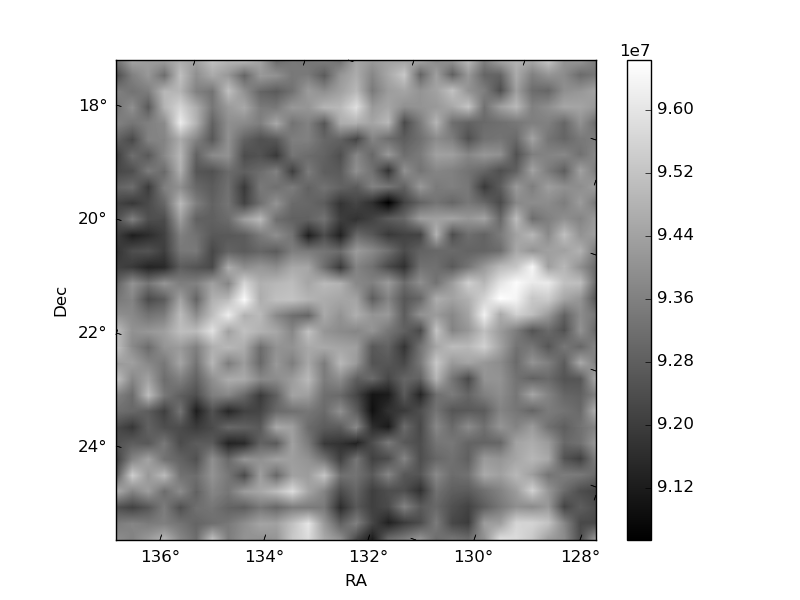
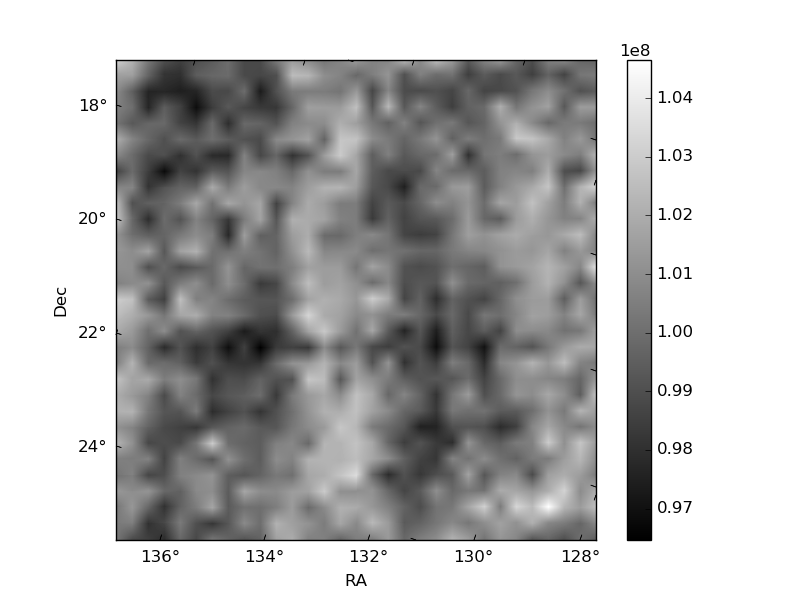
Histogram calculated using DETX and DETY for each event in the final _common_clean file
| Quadrant A | 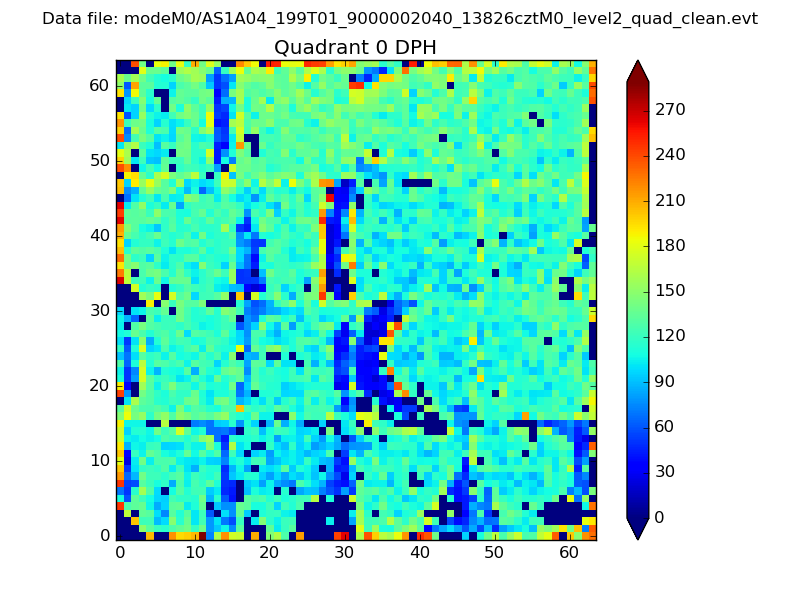 |
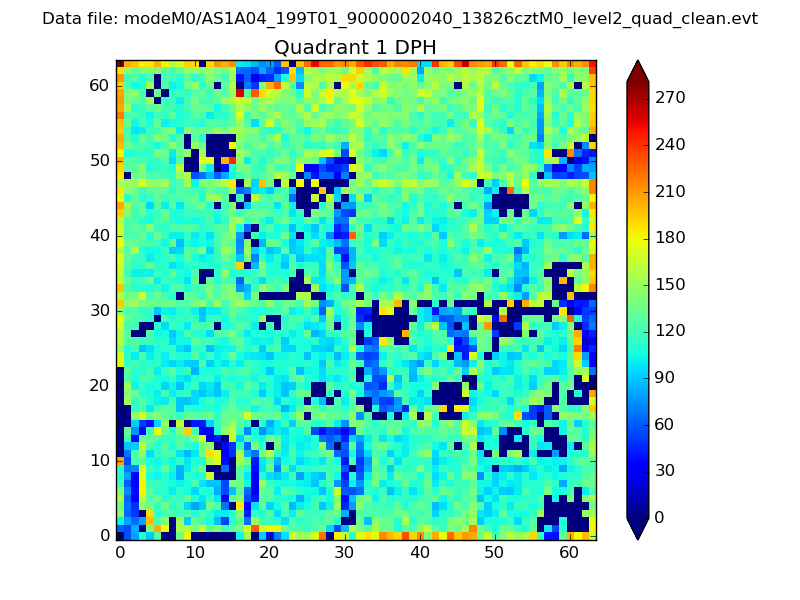 |
Quadrant B |
|---|---|---|---|
| Quadrant D | 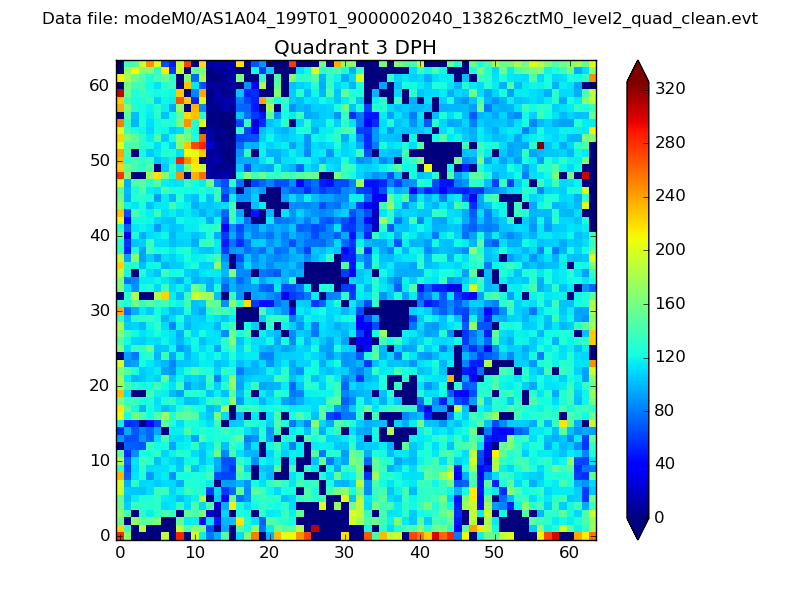 |
 |
Quadrant C |
| Plot type | Count rate plots | Images |
|---|---|---|
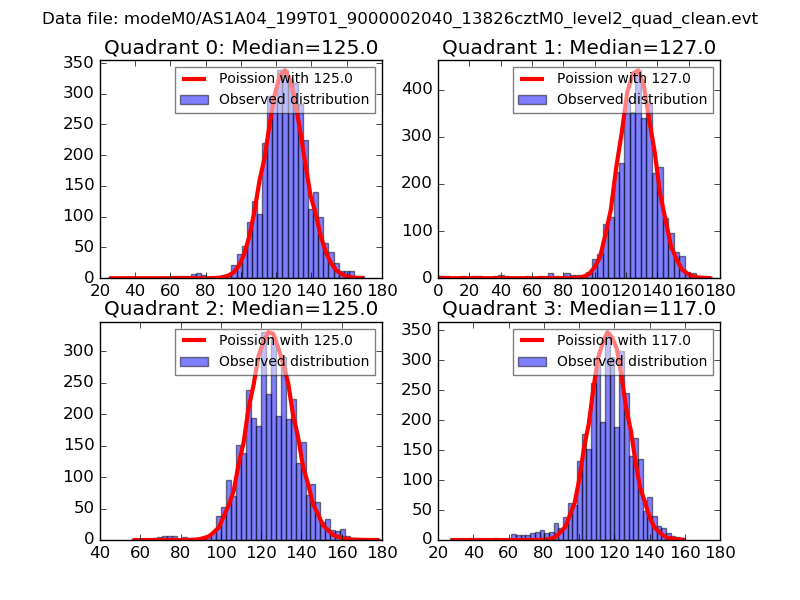
| Comparison with Poisson distribution Blue bars denote a histogram of data divided into 1 sec bins. Red curve is a Poisson curve with rate = median count rate of data. |
 |
 |
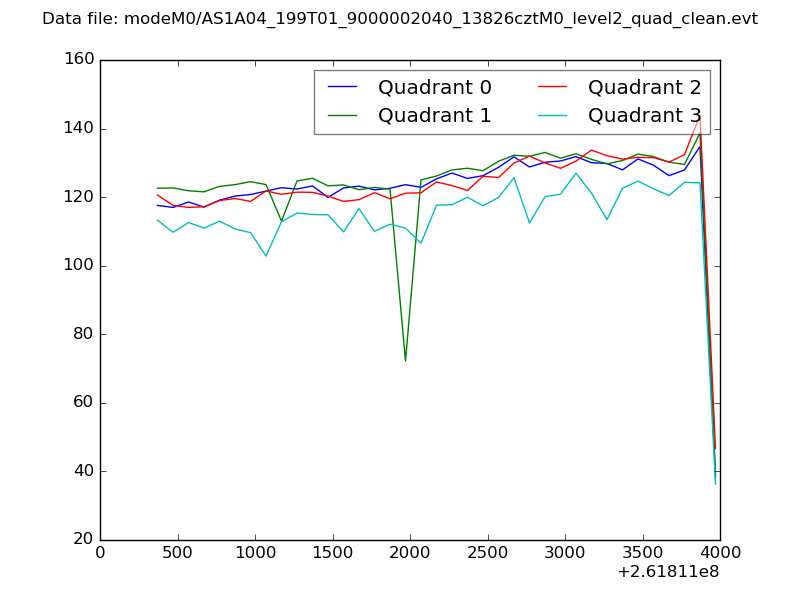
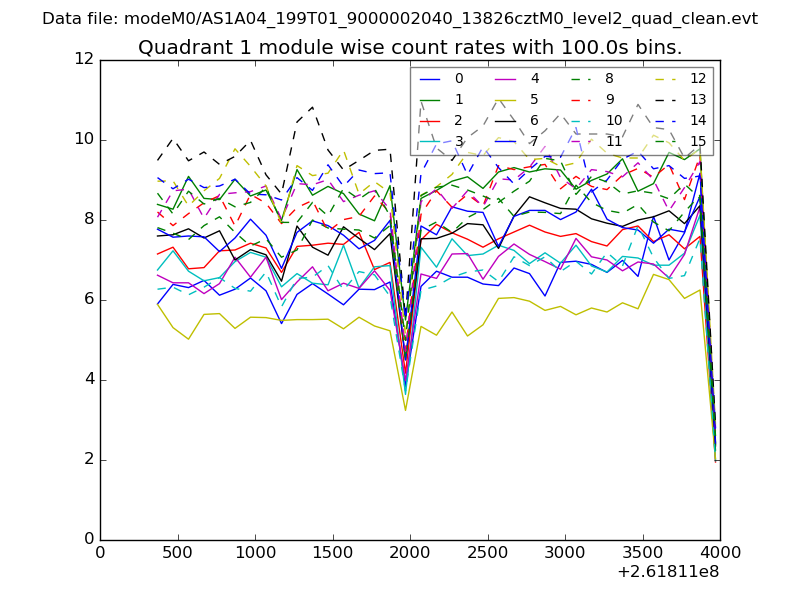
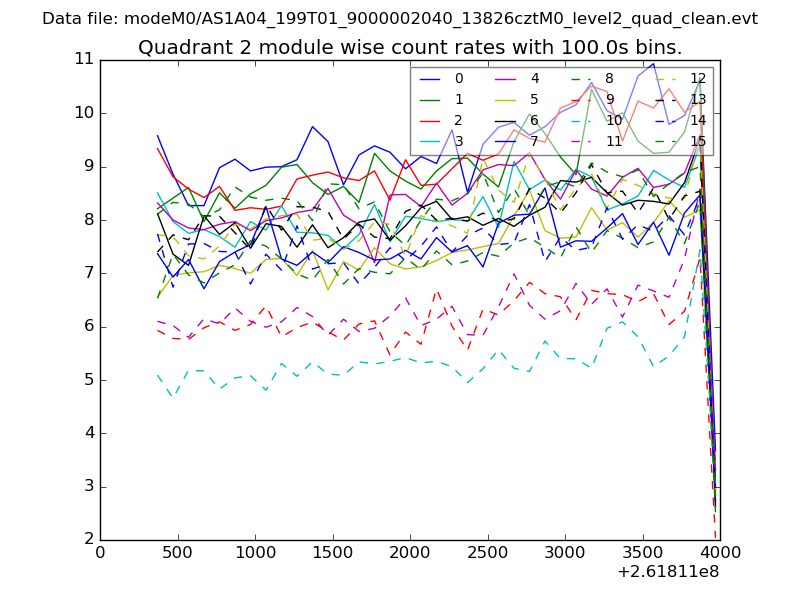
| Quadrant-wise count rates Data is divided into 100 sec bins |
 |
|
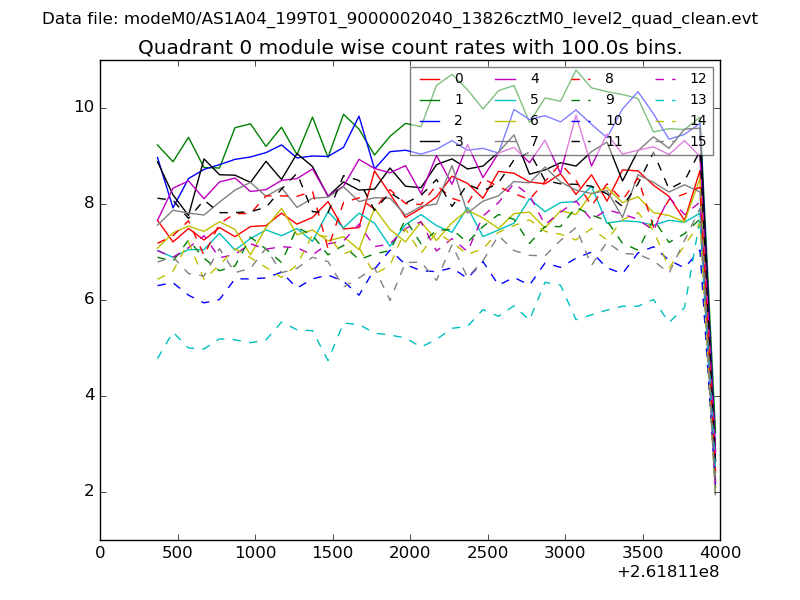
| Module-wise count rates for Quadrant A Data is divided into 100 sec bins |
 |
 |
| Module-wise count rates for Quadrant B Data is divided into 100 sec bins |
 |
 |
| Module-wise count rates for Quadrant C Data is divided into 100 sec bins |
 |
 |
| Module-wise count rates for Quadrant D Data is divided into 100 sec bins |
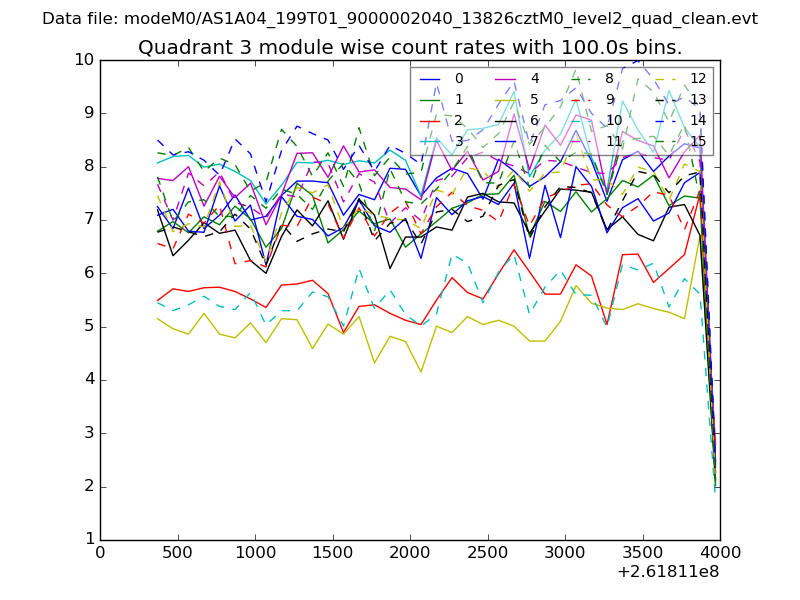 |
 |
| Parameter | Plot |
|---|---|
| CZT HV Monitor | 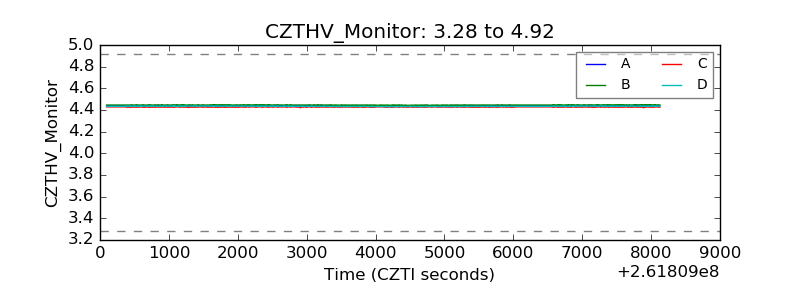 |
| D_VDD | 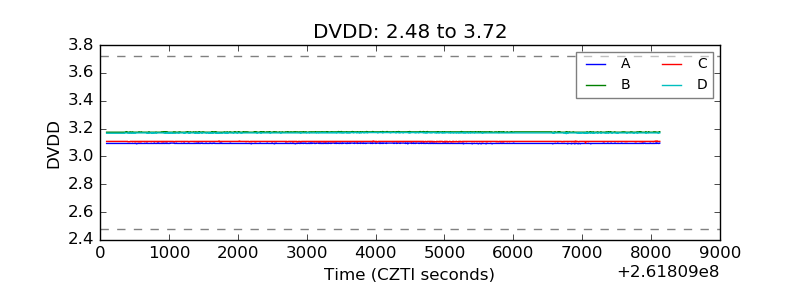 |
| Temperature 1 | 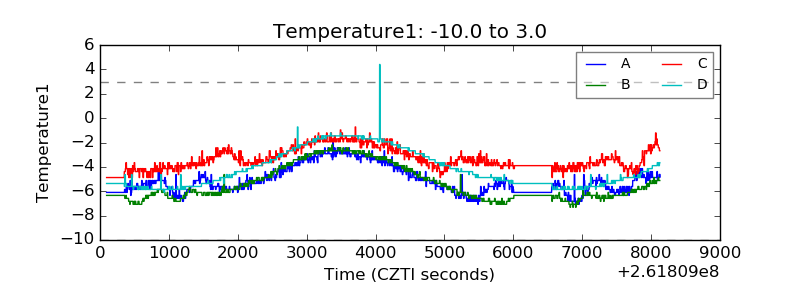 |
| Veto HV Monitor | 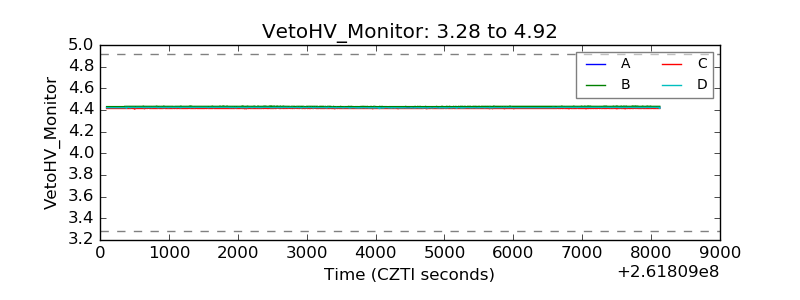 |
| Veto LLD | 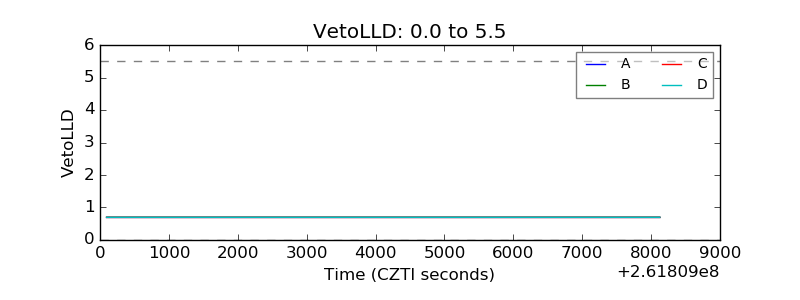 |
| Alpha Counter | 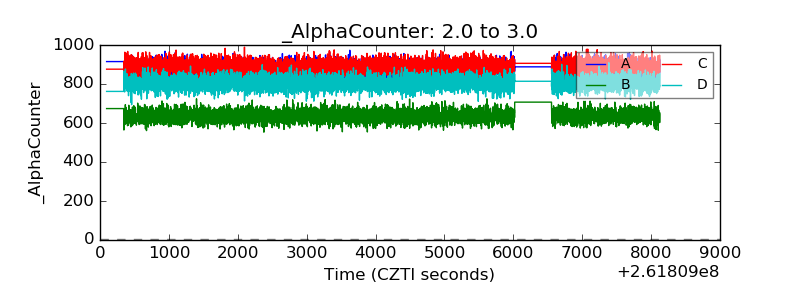 |
| _CPM_Rate | 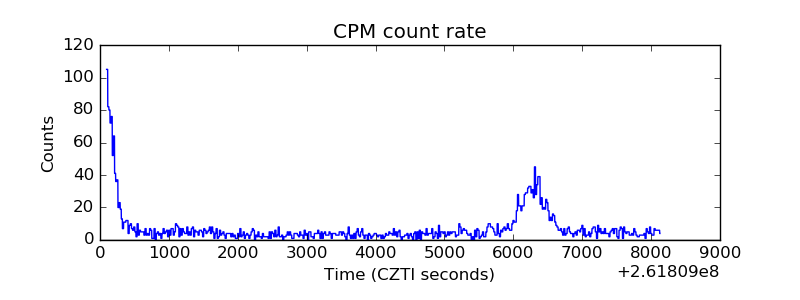 |
| CZT Counter | 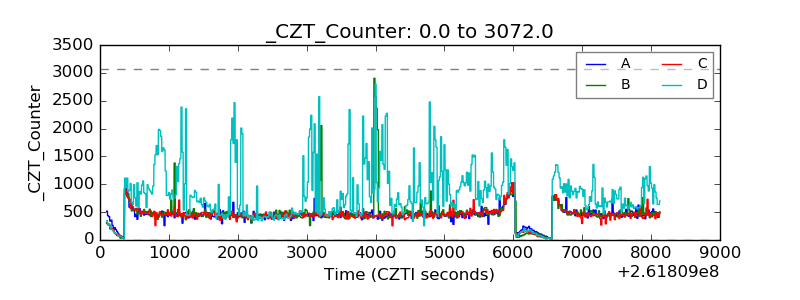 |
| +2.5 Volts monitor |  |
| +5 Volts monitor |  |
| _ROLL_ROT | 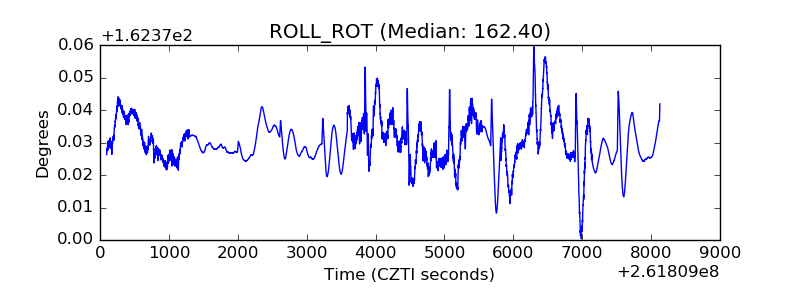 |
| _Roll_DEC | 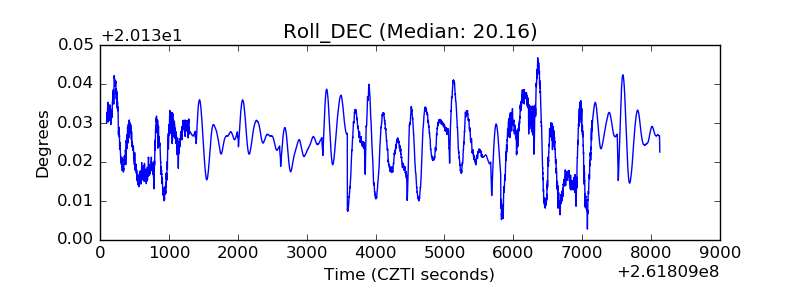 |
| _Roll_RA | 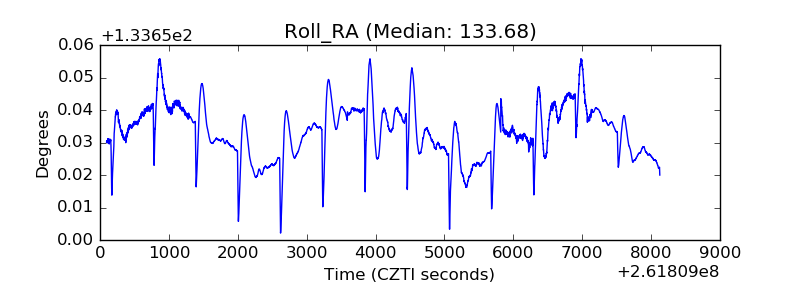 |
| Veto Counter | 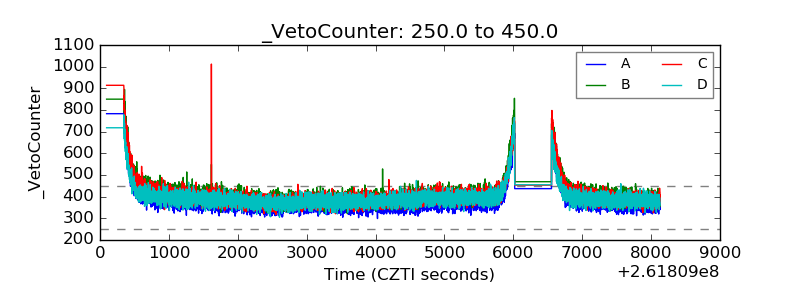 |