| Param | Original file | Final file |
|---|---|---|
| Filename | modeM0/AS1A04_199T01_9000002040_13827cztM0_level2.evt | modeM0/AS1A04_199T01_9000002040_13827cztM0_level2_quad_clean.evt |
| Size (bytes) | 591,811,200 | 80,928,000 |
| Size | 564.4 MB | 77.2 MB |
| Events in quadrant A | 3,664,091 | 485,556 |
| Events in quadrant B | 3,750,715 | 492,873 |
| Events in quadrant C | 3,671,134 | 481,434 |
| Events in quadrant D | 6,312,845 | 452,990 |
| Mode M9 | |||
|---|---|---|---|
| Quadrant | BADHDUFLAG | Total packets | Discarded packets |
| A | 0 | 2 | 0 |
| B | 0 | 2 | 0 |
| C | 0 | 2 | 0 |
| D | 0 | 2 | 0 |
| Mode SS | |||
|---|---|---|---|
| Quadrant | BADHDUFLAG | Total packets | Discarded packets |
| A | 0 | 156 | 0 |
| B | 0 | 156 | 0 |
| C | 0 | 156 | 0 |
| D | 0 | 156 | 0 |
| Mode M0 | |||
|---|---|---|---|
| Quadrant | BADHDUFLAG | Total packets | Discarded packets |
| A | 0 | 16053 | 2 |
| B | 0 | 16204 | 1 |
| C | 0 | 16055 | 1 |
| D | 0 | 24126 | 1 |
| Quadrant | Total seconds | Saturated seconds | Saturation percentage |
|---|---|---|---|
| A | 7739 | 344 | 4.445019% |
| B | 7739 | 375 | 4.845587% |
| C | 7739 | 281 | 3.630960% |
| D | 7739 | 339 | 4.380411% |
Noise dominated data is calculated using 1-second bins in cleaned event files. If a bin has >2000 counts, and if more than 50% of those come from <1% of pixels, then it is considered to be noise-dominated and hence unusable.
| Quadrant | # 1 sec bins | Bins with >0 counts | Bins with >2000 counts | High rate bins dominated by noise | Noise dominated (total time) | Noise dominated (detector-on time) | Marked lightcurve |
|---|---|---|---|---|---|---|---|
| A | 7785 | 7740 | 0 | 0 | 0.00% | 0.00% | 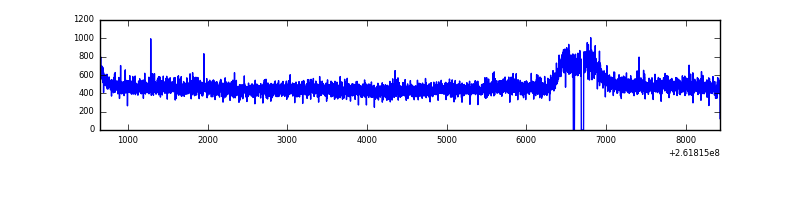 |
| B | 7785 | 7740 | 7 | 7 | 0.09% | 0.09% | 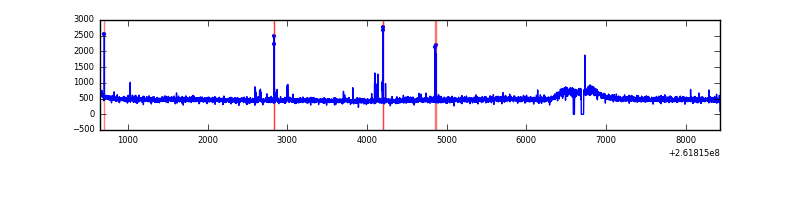 |
| C | 7785 | 7742 | 2 | 2 | 0.03% | 0.03% | 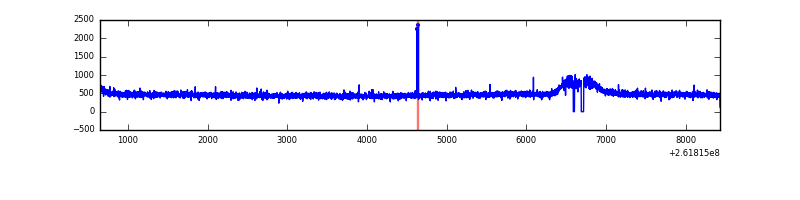 |
| D | 7785 | 7740 | 27 | 27 | 0.35% | 0.35% | 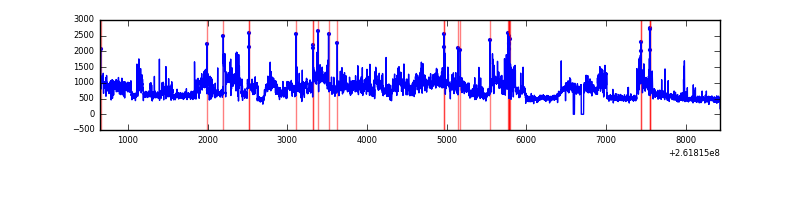 |
Top three noisy pixels from each quadrant. If the there are fewer than three noisy pixels in the level2.evt file, extra rows are filled as -1
| Pixel properties | Quadrant properties | ||||||
|---|---|---|---|---|---|---|---|
| Quadrant | DetID | PixID | Counts | Sigma | Mean | Median | Sigma |
| A | 1 | 162 | 15577 | 75.67 | 941 | 916 | 193.8 |
| A | 8 | 15 | 15410 | 74.81 | 941 | 916 | 193.8 |
| A | 0 | 226 | 8917 | 41.29 | 941 | 916 | 193.8 |
| B | 10 | 244 | 22453 | 117.72 | 943 | 918 | 182.9 |
| B | 12 | 111 | 22074 | 115.65 | 943 | 918 | 182.9 |
| B | 11 | 111 | 18818 | 97.85 | 943 | 918 | 182.9 |
| C | 3 | 233 | 56080 | 255.44 | 925 | 930 | 215.9 |
| C | 13 | 61 | 6788 | 27.13 | 925 | 930 | 215.9 |
| C | 14 | 234 | 5388 | 20.65 | 925 | 930 | 215.9 |
| D | 10 | 157 | 2167671 | 8850.87 | 908 | 887 | 244.8 |
| D | 1 | 52 | 403086 | 1642.9 | 908 | 887 | 244.8 |
| D | 8 | 195 | 259979 | 1058.34 | 908 | 887 | 244.8 |
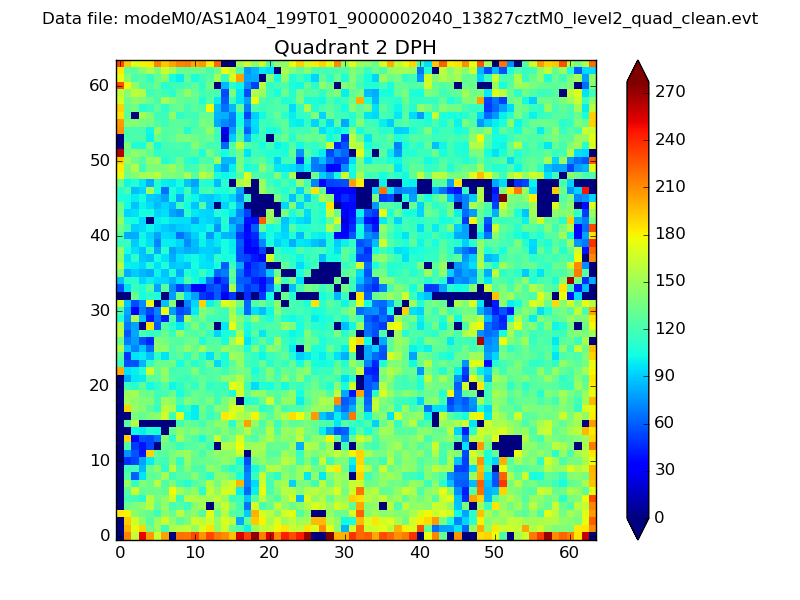
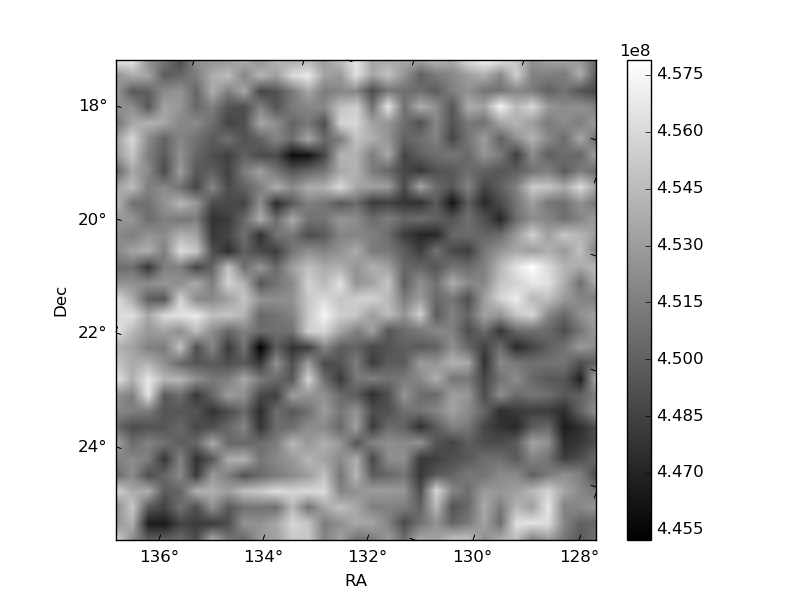
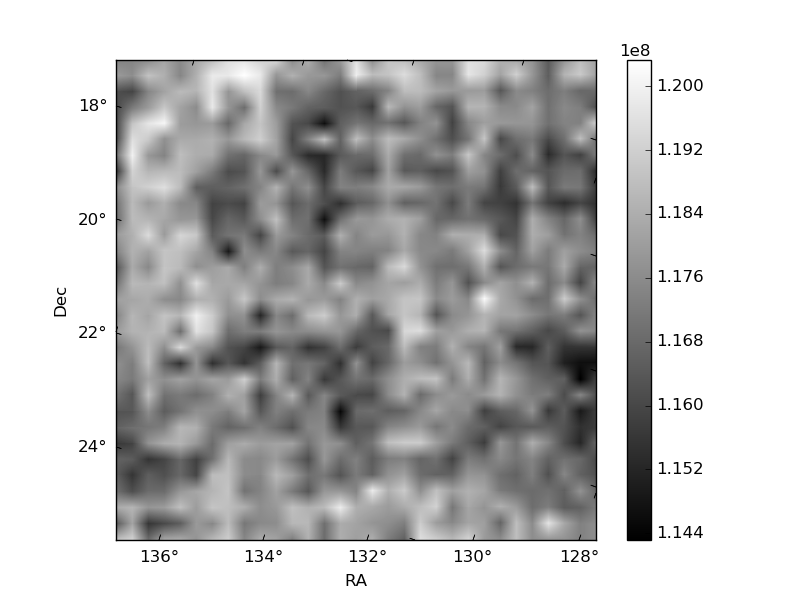
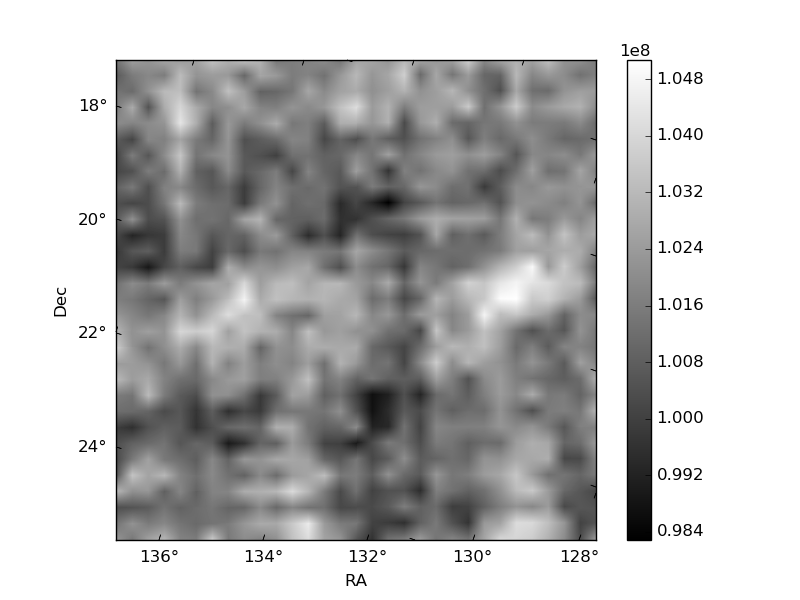
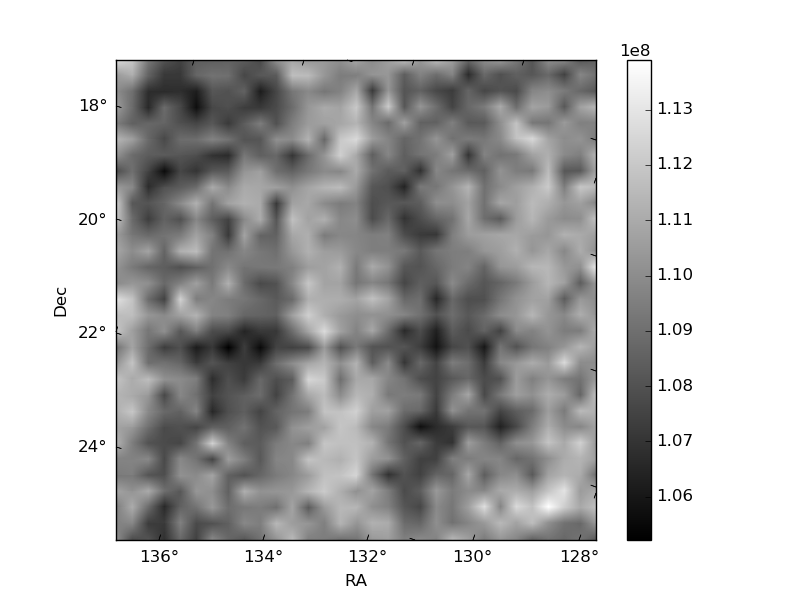
Histogram calculated using DETX and DETY for each event in the final _common_clean file
| Quadrant A | 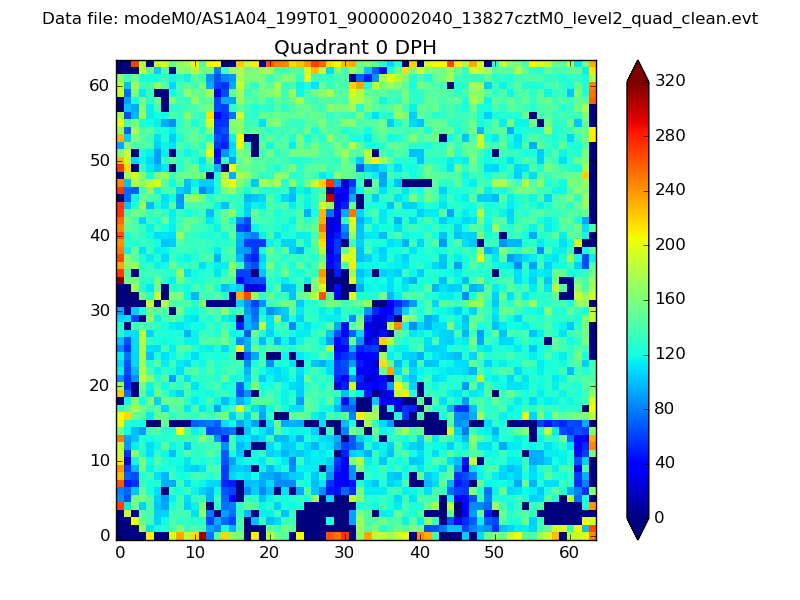 |
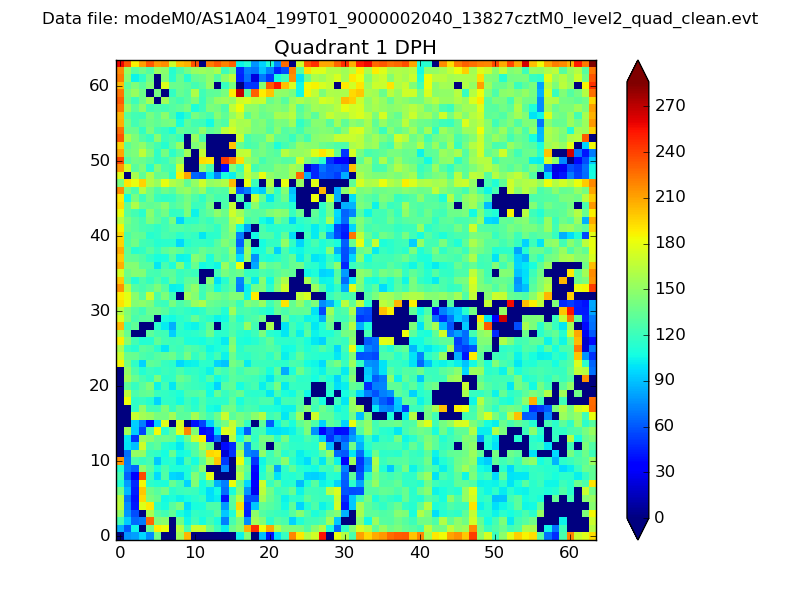 |
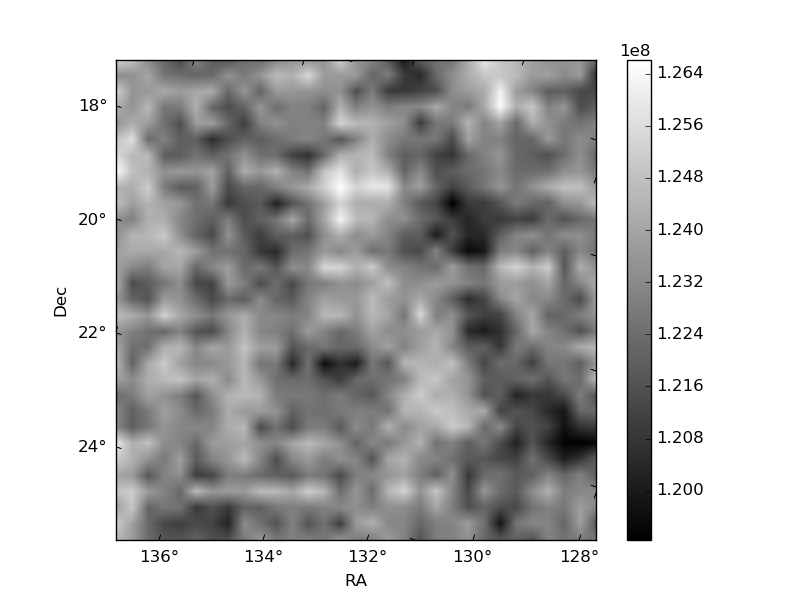
Quadrant B |
|---|---|---|---|
| Quadrant D | 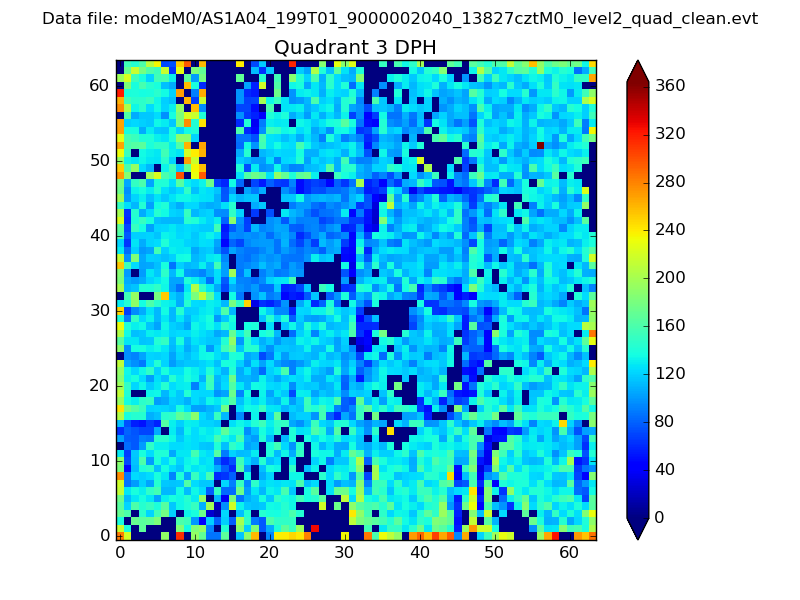 |
 |
Quadrant C |
| Plot type | Count rate plots | Images |
|---|---|---|
| Comparison with Poisson distribution Blue bars denote a histogram of data divided into 1 sec bins. Red curve is a Poisson curve with rate = median count rate of data. |
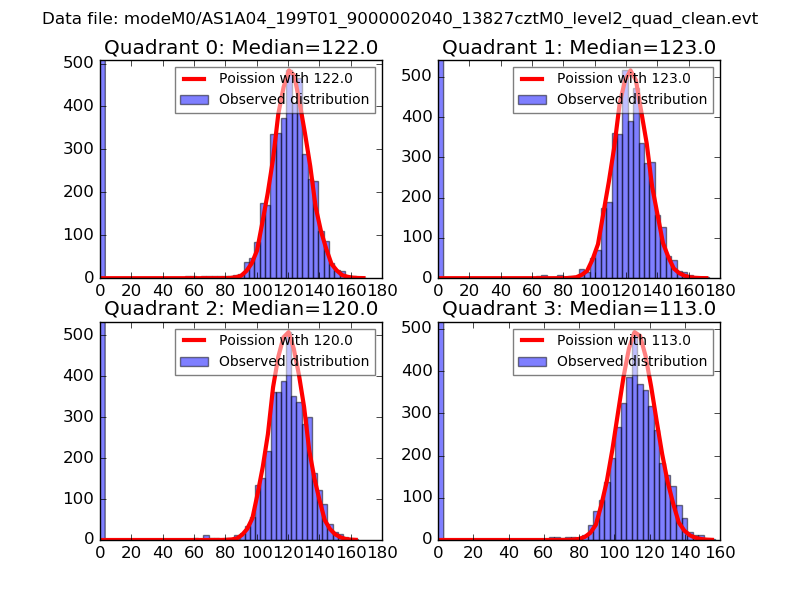 |
 |
| Quadrant-wise count rates Data is divided into 100 sec bins |
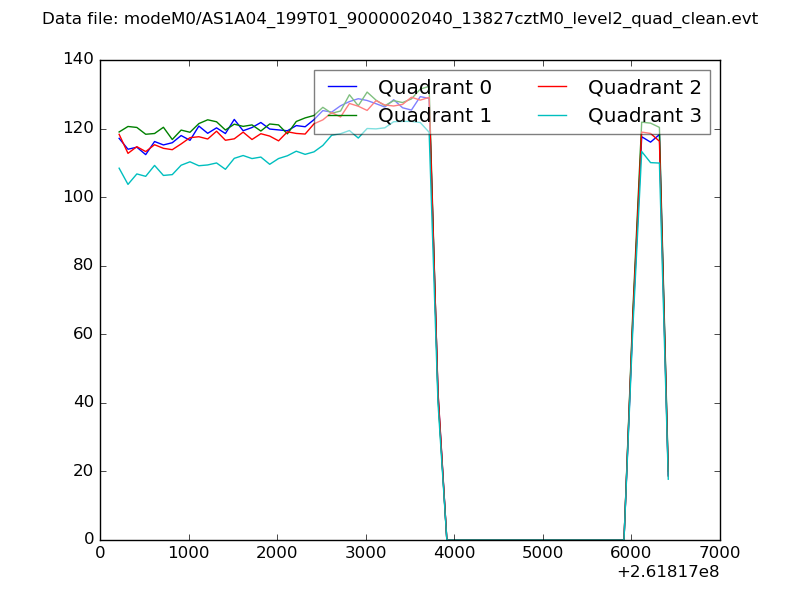 |
|
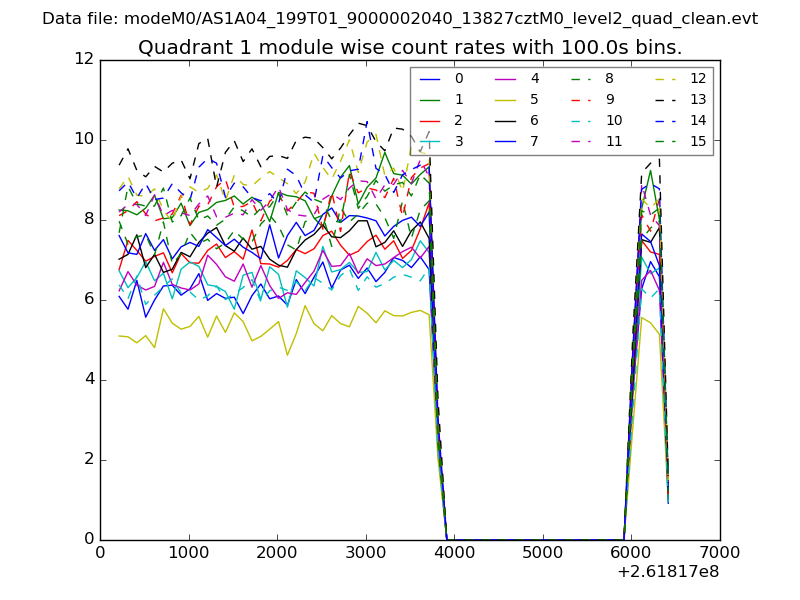
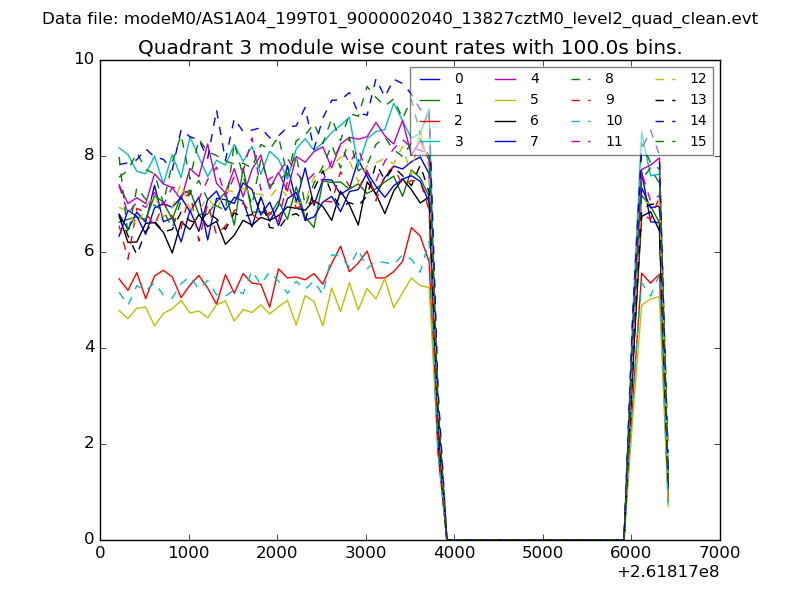
| Module-wise count rates for Quadrant A Data is divided into 100 sec bins |
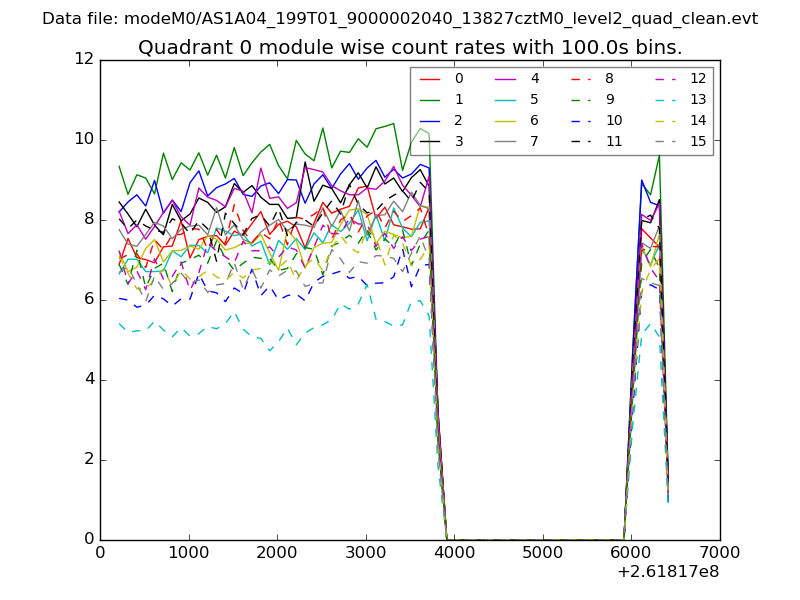 |
 |
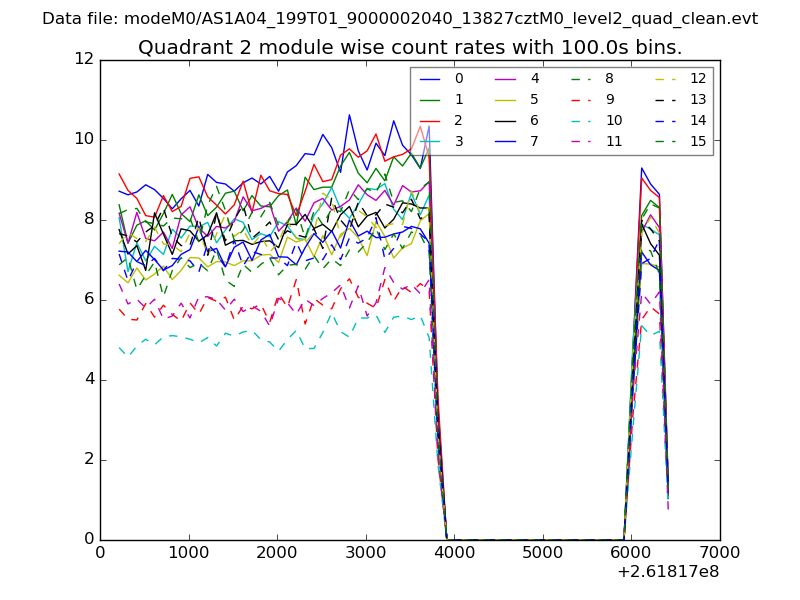
| Module-wise count rates for Quadrant B Data is divided into 100 sec bins |
 |
 |
| Module-wise count rates for Quadrant C Data is divided into 100 sec bins |
 |
 |
| Module-wise count rates for Quadrant D Data is divided into 100 sec bins |
 |
 |
| Parameter | Plot |
|---|---|
| CZT HV Monitor | 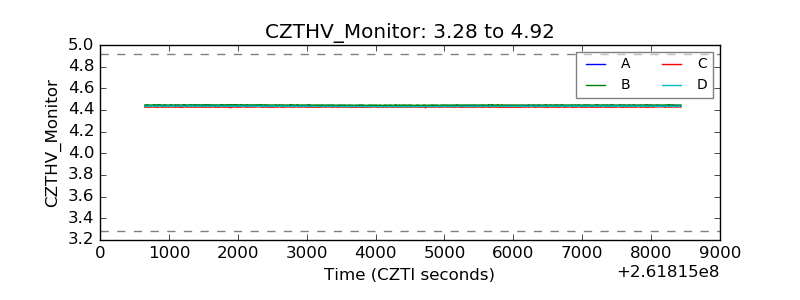 |
| D_VDD |  |
| Temperature 1 | 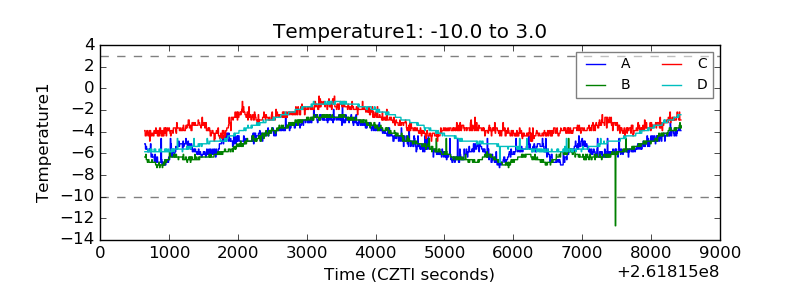 |
| Veto HV Monitor | 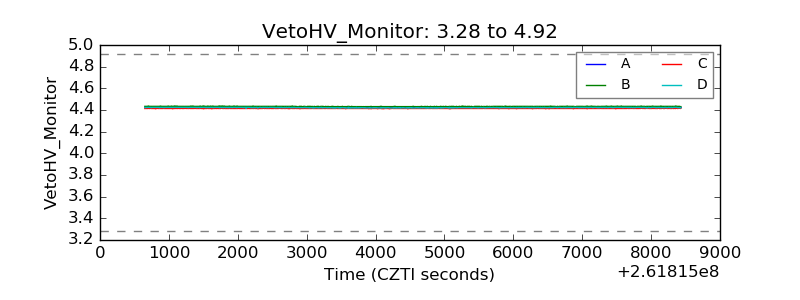 |
| Veto LLD | 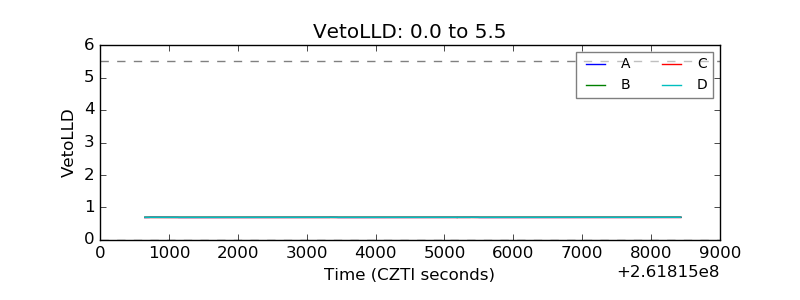 |
| Alpha Counter | 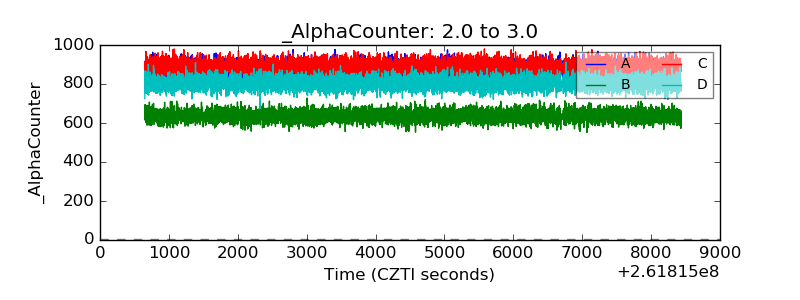 |
| _CPM_Rate | 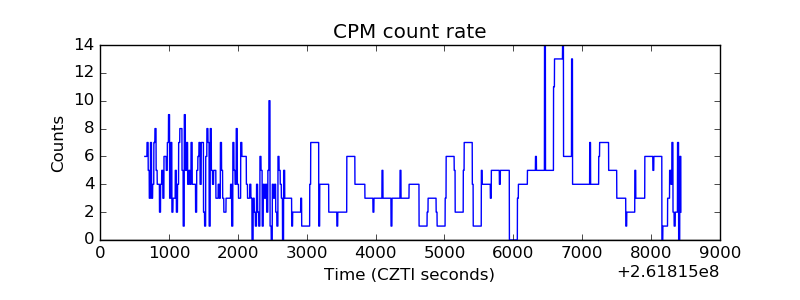 |
| CZT Counter | 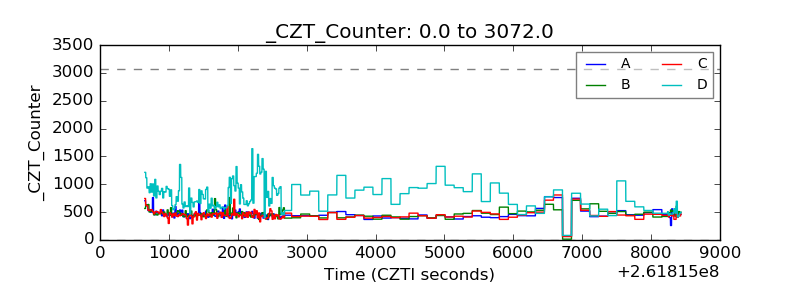 |
| +2.5 Volts monitor |  |
| +5 Volts monitor |  |
| _ROLL_ROT | 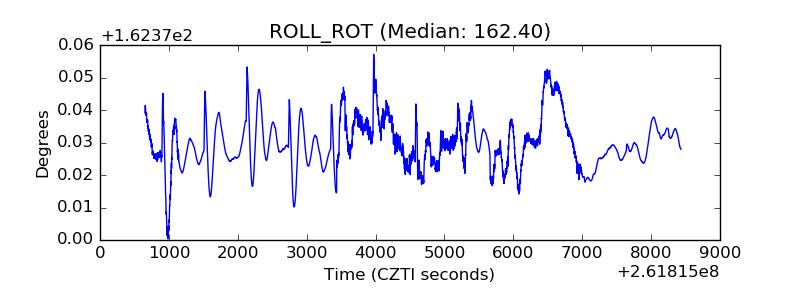 |
| _Roll_DEC | 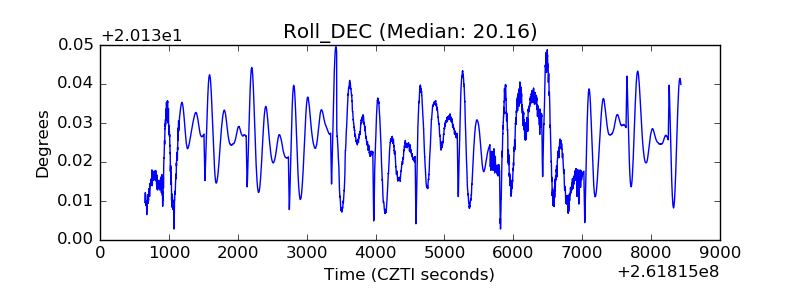 |
| _Roll_RA | 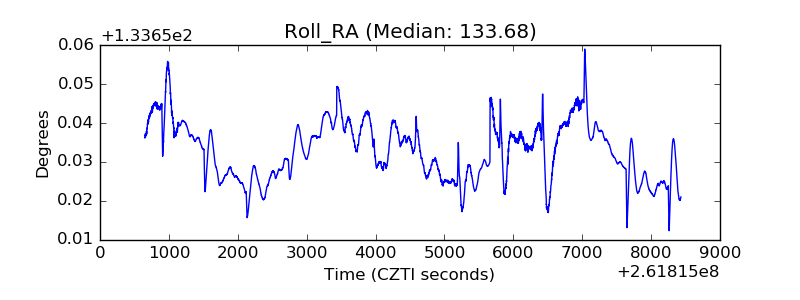 |
| Veto Counter | 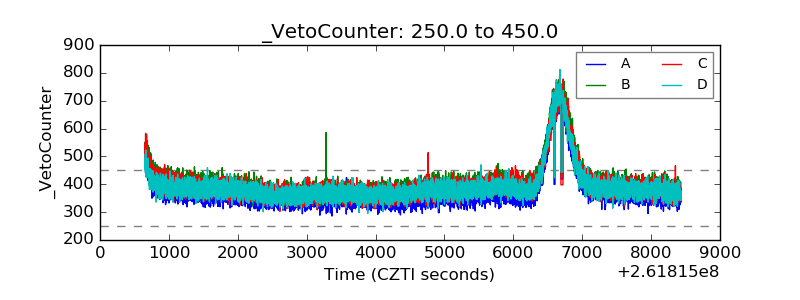 |