| Param | Original file | Final file |
|---|---|---|
| Filename | modeM0/AS1A04_199T01_9000002040_13828cztM0_level2.evt | modeM0/AS1A04_199T01_9000002040_13828cztM0_level2_quad_clean.evt |
| Size (bytes) | 547,891,200 | 86,454,720 |
| Size | 522.5 MB | 82.4 MB |
| Events in quadrant A | 3,674,271 | 526,031 |
| Events in quadrant B | 3,741,321 | 536,078 |
| Events in quadrant C | 3,625,086 | 525,121 |
| Events in quadrant D | 5,032,093 | 497,723 |
| Mode M9 | |||
|---|---|---|---|
| Quadrant | BADHDUFLAG | Total packets | Discarded packets |
| A | 0 | 3 | 0 |
| B | 0 | 3 | 0 |
| C | 0 | 3 | 0 |
| D | 0 | 3 | 0 |
| Mode SS | |||
|---|---|---|---|
| Quadrant | BADHDUFLAG | Total packets | Discarded packets |
| A | 0 | 156 | 0 |
| B | 0 | 156 | 0 |
| C | 0 | 156 | 0 |
| D | 0 | 156 | 0 |
| Mode M0 | |||
|---|---|---|---|
| Quadrant | BADHDUFLAG | Total packets | Discarded packets |
| A | 0 | 15838 | 3 |
| B | 0 | 16044 | 2 |
| C | 0 | 15818 | 2 |
| D | 0 | 19823 | 2 |
| Quadrant | Total seconds | Saturated seconds | Saturation percentage |
|---|---|---|---|
| A | 7659 | 187 | 2.441572% |
| B | 7659 | 221 | 2.885494% |
| C | 7659 | 125 | 1.632067% |
| D | 7659 | 267 | 3.486095% |
Noise dominated data is calculated using 1-second bins in cleaned event files. If a bin has >2000 counts, and if more than 50% of those come from <1% of pixels, then it is considered to be noise-dominated and hence unusable.
| Quadrant | # 1 sec bins | Bins with >0 counts | Bins with >2000 counts | High rate bins dominated by noise | Noise dominated (total time) | Noise dominated (detector-on time) | Marked lightcurve |
|---|---|---|---|---|---|---|---|
| A | 7930 | 7660 | 0 | 0 | 0.00% | 0.00% | 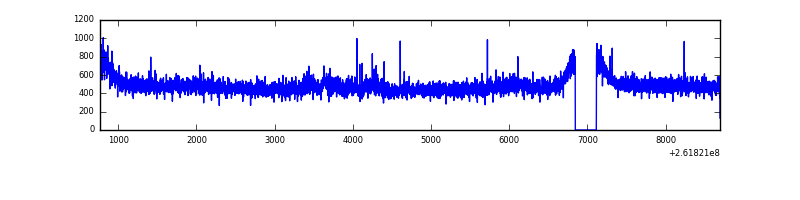 |
| B | 7930 | 7660 | 5 | 5 | 0.06% | 0.07% | 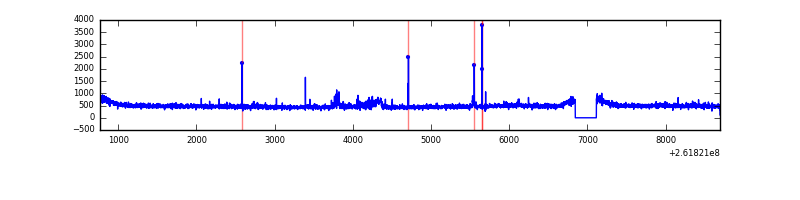 |
| C | 7930 | 7661 | 0 | 0 | 0.00% | 0.00% | 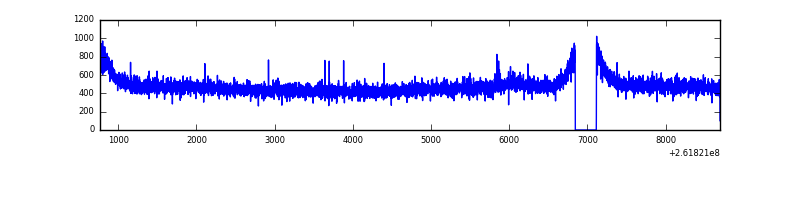 |
| D | 7930 | 7660 | 139 | 139 | 1.75% | 1.81% | 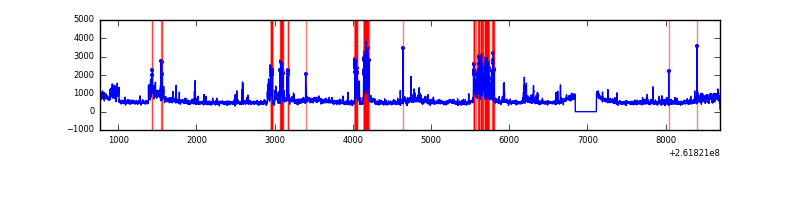 |
Top three noisy pixels from each quadrant. If the there are fewer than three noisy pixels in the level2.evt file, extra rows are filled as -1
| Pixel properties | Quadrant properties | ||||||
|---|---|---|---|---|---|---|---|
| Quadrant | DetID | PixID | Counts | Sigma | Mean | Median | Sigma |
| A | 0 | 23 | 67223 | 345.2 | 928 | 906 | 192.1 |
| A | 8 | 15 | 23183 | 115.96 | 928 | 906 | 192.1 |
| A | 0 | 226 | 12185 | 58.71 | 928 | 906 | 192.1 |
| B | 10 | 244 | 63297 | 348.59 | 926 | 901 | 179.0 |
| B | 0 | 214 | 22221 | 119.11 | 926 | 901 | 179.0 |
| B | 12 | 111 | 21658 | 115.96 | 926 | 901 | 179.0 |
| C | 3 | 233 | 101570 | 476.27 | 904 | 908 | 211.4 |
| C | 13 | 61 | 6541 | 26.65 | 904 | 908 | 211.4 |
| C | 14 | 220 | 2445 | 7.27 | 904 | 908 | 211.4 |
| D | 1 | 52 | 1042063 | 4379.61 | 891 | 869 | 237.7 |
| D | 8 | 195 | 302098 | 1267.07 | 891 | 869 | 237.7 |
| D | 10 | 157 | 182514 | 764.06 | 891 | 869 | 237.7 |
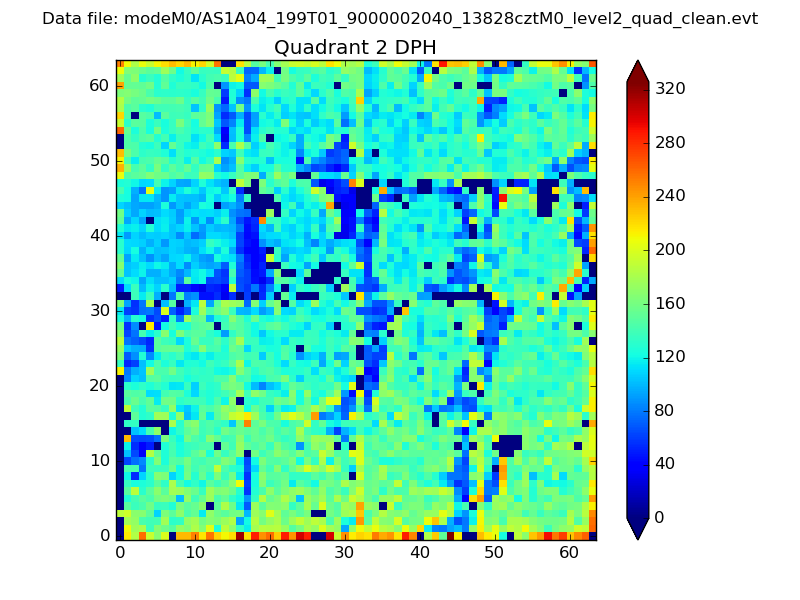
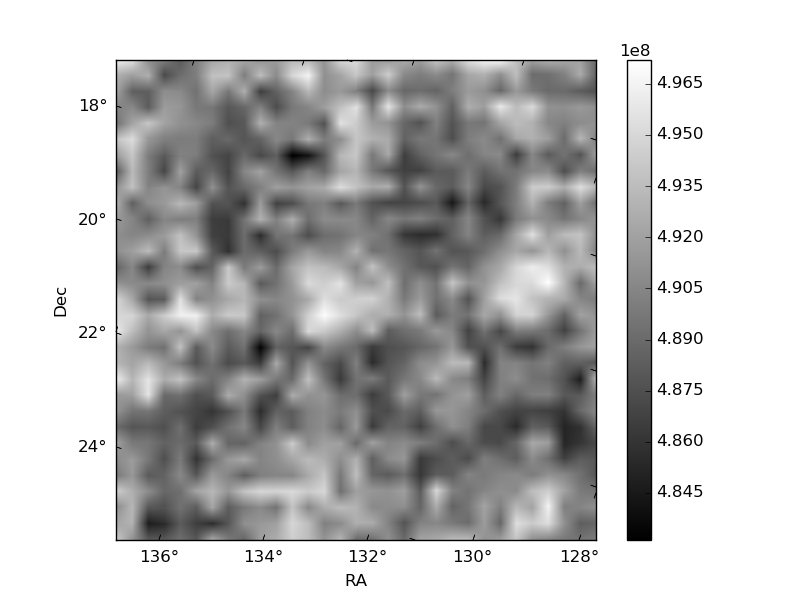
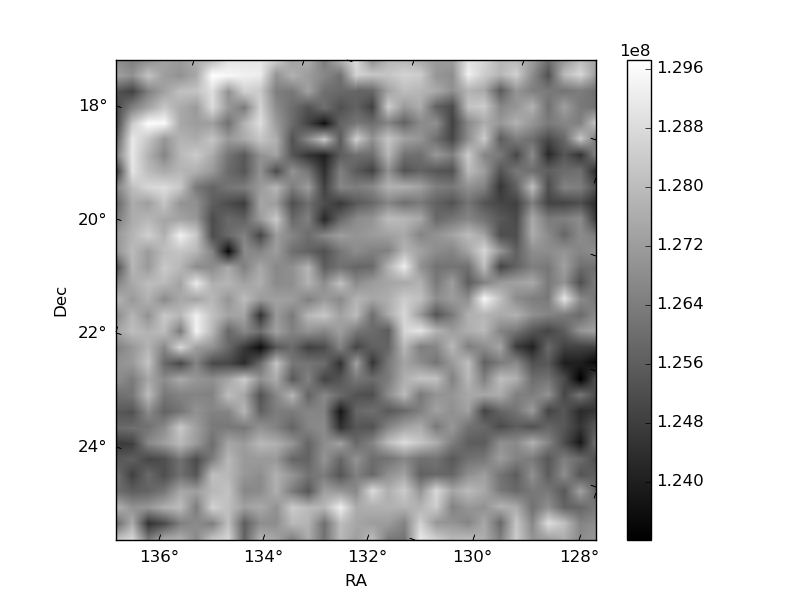
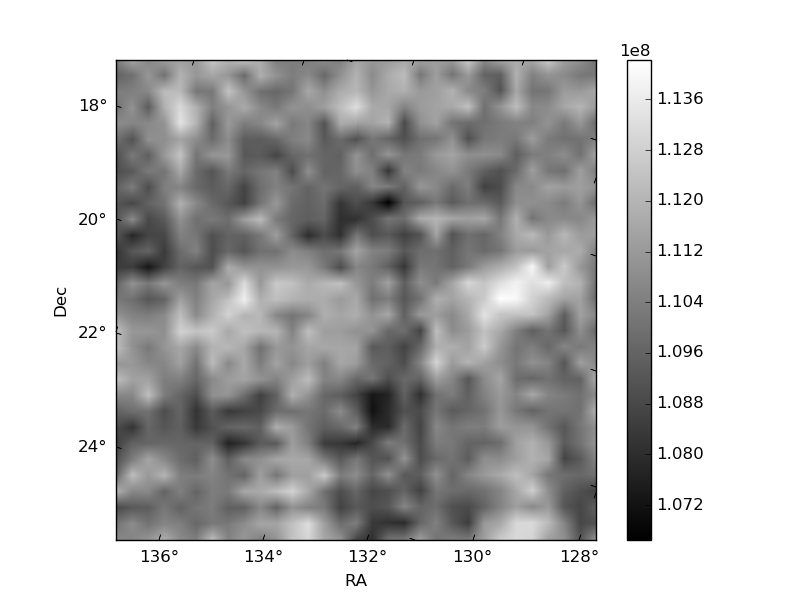
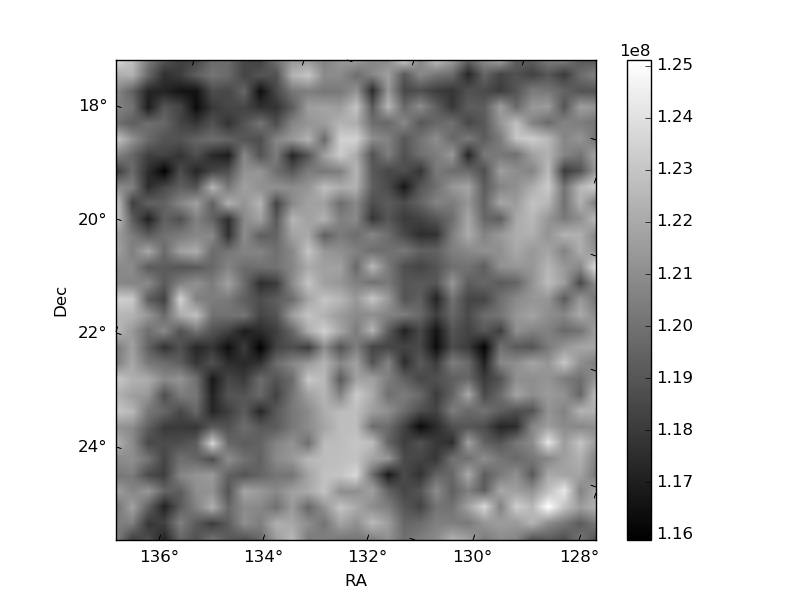
Histogram calculated using DETX and DETY for each event in the final _common_clean file
| Quadrant A | 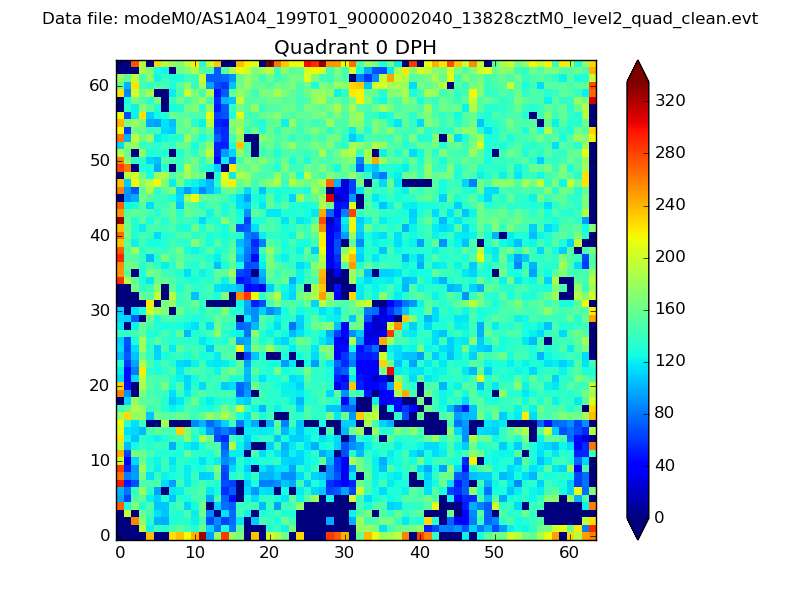 |
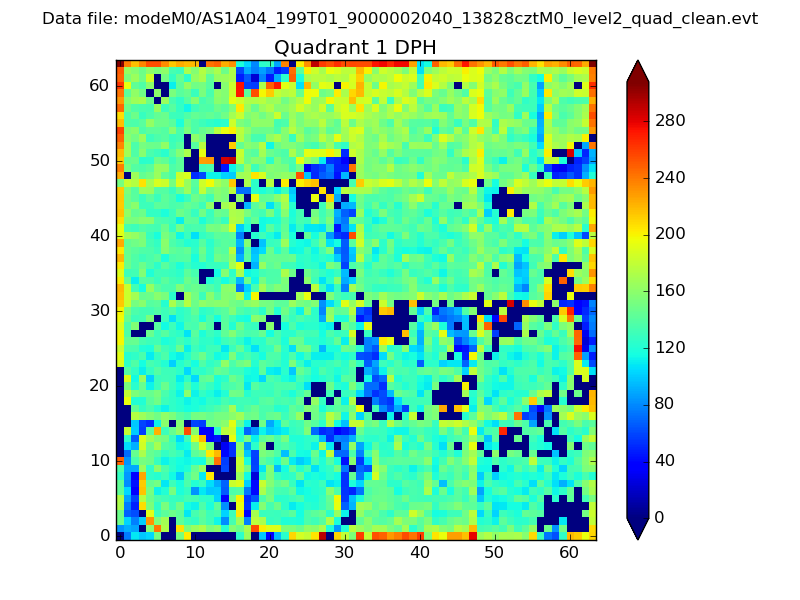 |
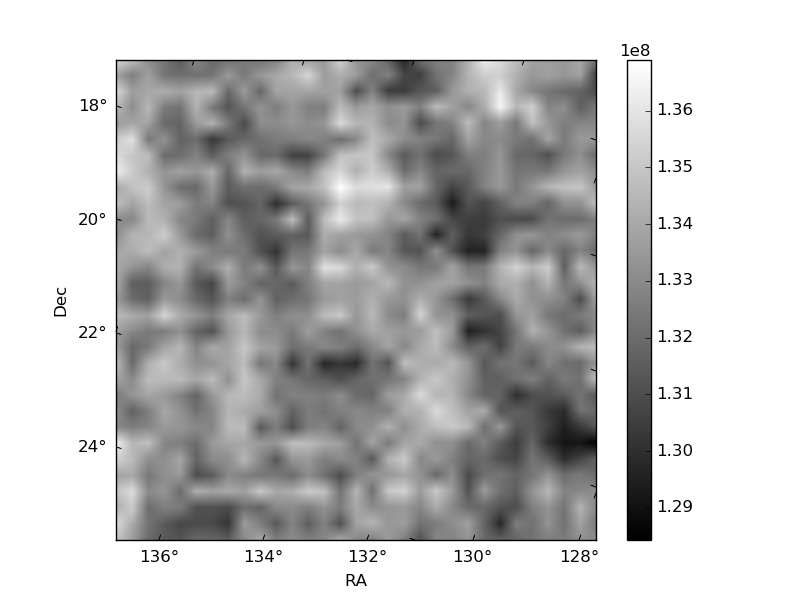
Quadrant B |
|---|---|---|---|
| Quadrant D | 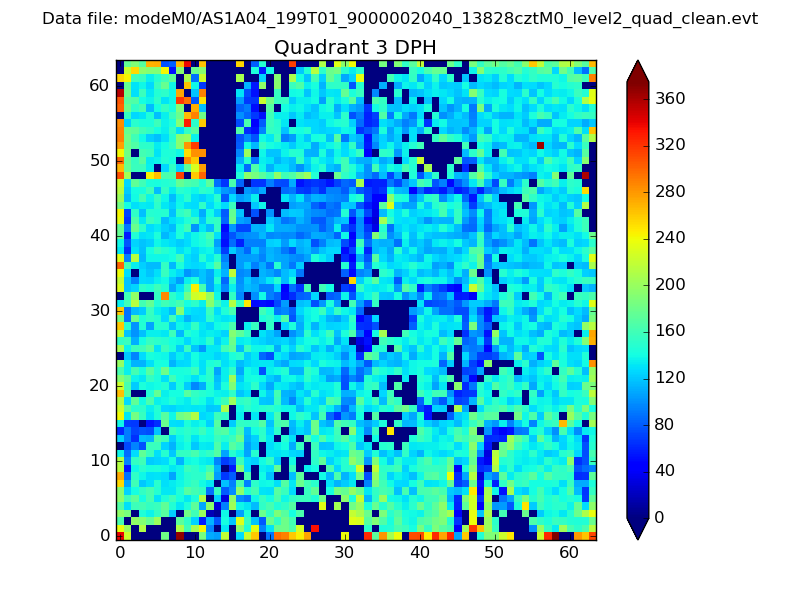 |
 |
Quadrant C |
| Plot type | Count rate plots | Images |
|---|---|---|
| Comparison with Poisson distribution Blue bars denote a histogram of data divided into 1 sec bins. Red curve is a Poisson curve with rate = median count rate of data. |
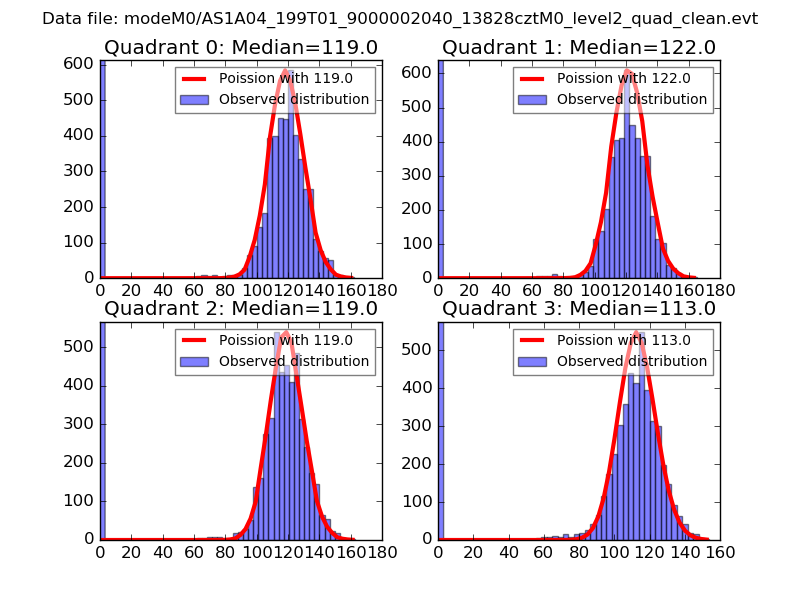 |
 |
| Quadrant-wise count rates Data is divided into 100 sec bins |
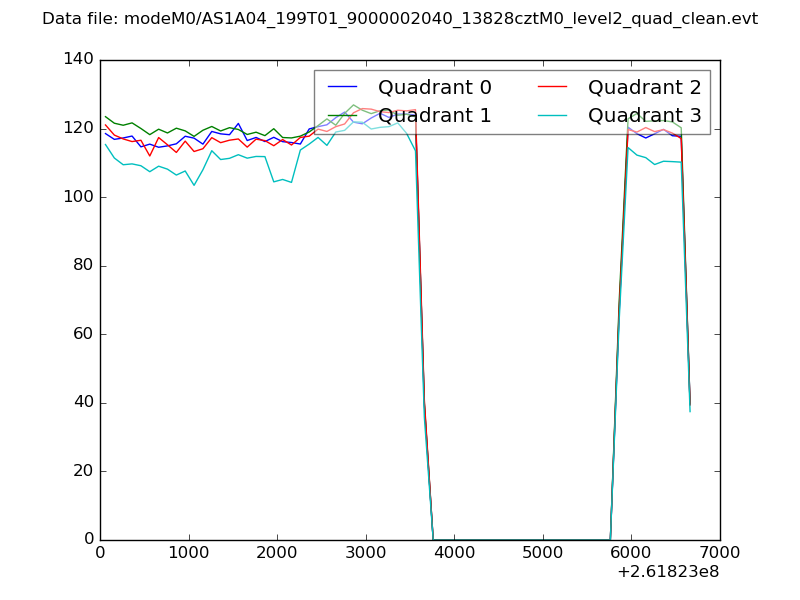 |
|
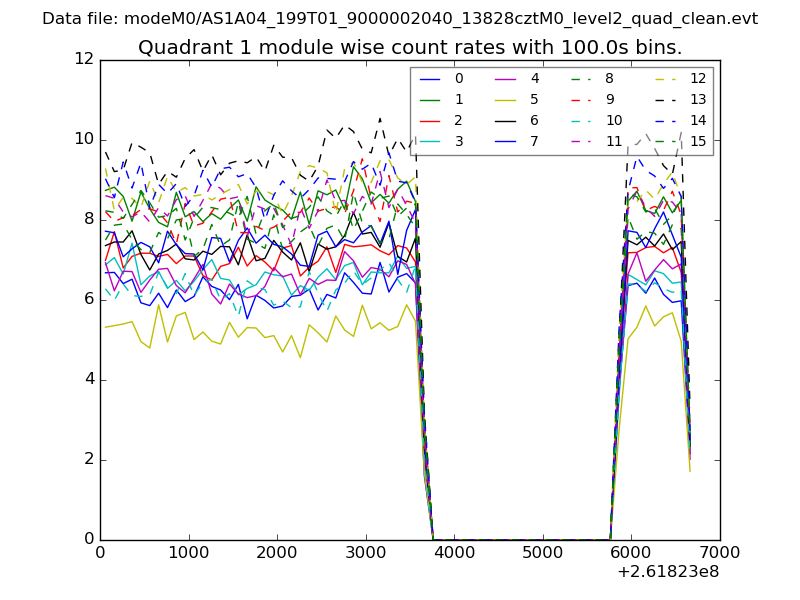
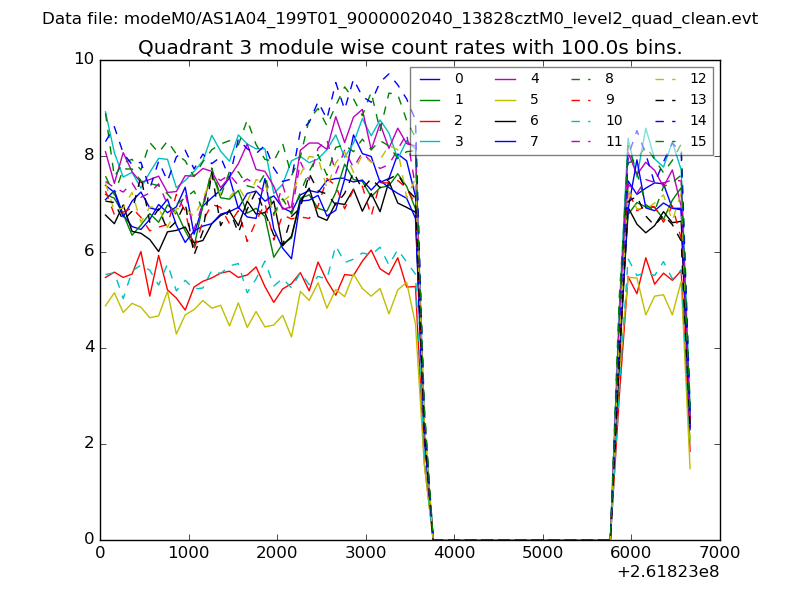
| Module-wise count rates for Quadrant A Data is divided into 100 sec bins |
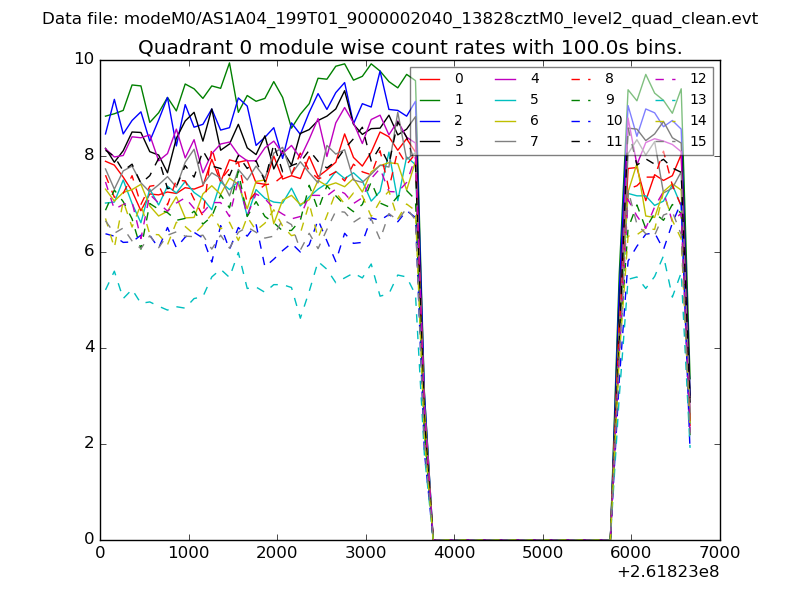 |
 |
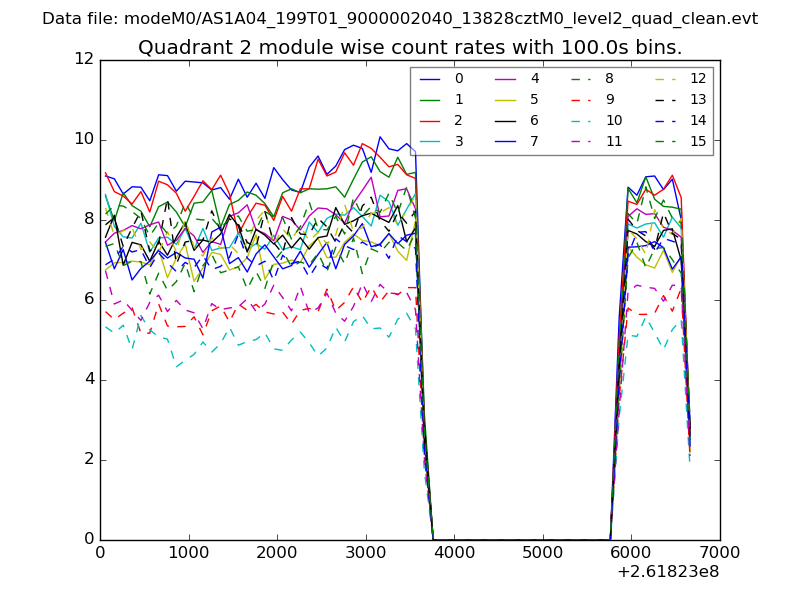
| Module-wise count rates for Quadrant B Data is divided into 100 sec bins |
 |
 |
| Module-wise count rates for Quadrant C Data is divided into 100 sec bins |
 |
 |
| Module-wise count rates for Quadrant D Data is divided into 100 sec bins |
 |
 |
| Parameter | Plot |
|---|---|
| CZT HV Monitor | 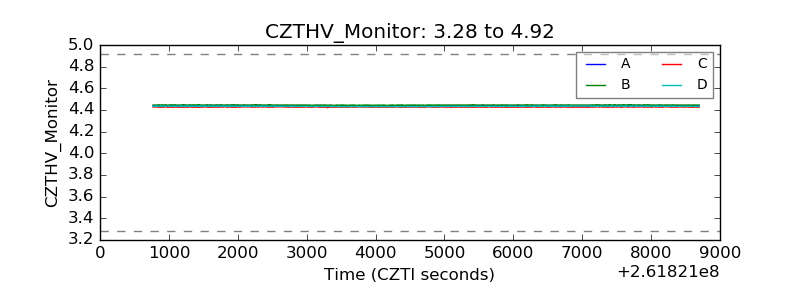 |
| D_VDD | 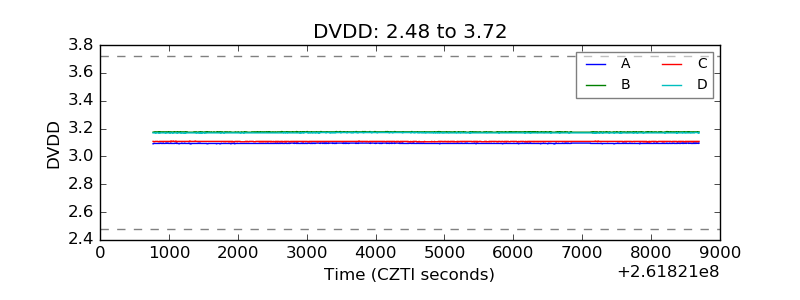 |
| Temperature 1 | 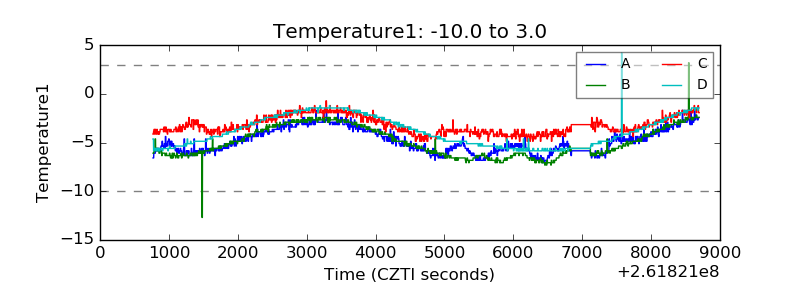 |
| Veto HV Monitor | 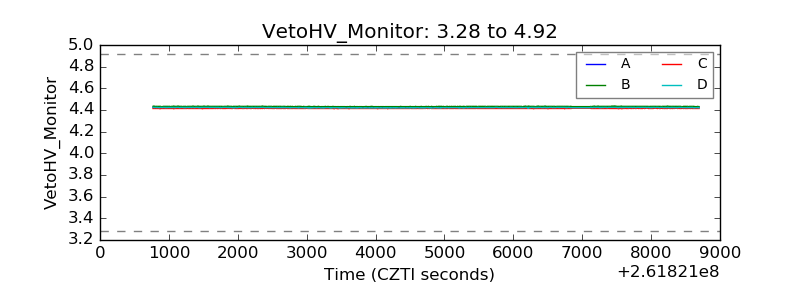 |
| Veto LLD | 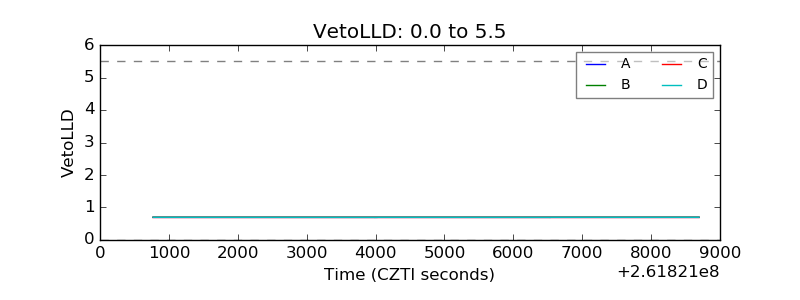 |
| Alpha Counter | 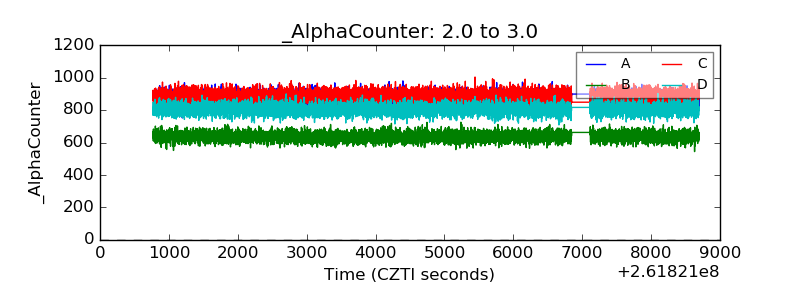 |
| _CPM_Rate | 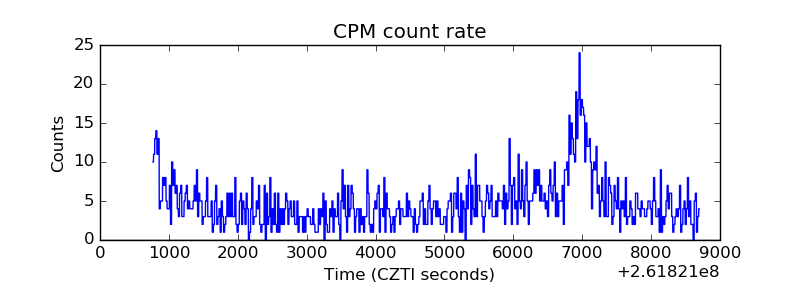 |
| CZT Counter | 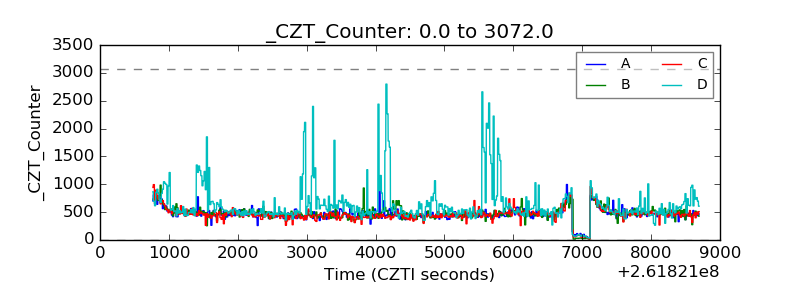 |
| +2.5 Volts monitor |  |
| +5 Volts monitor |  |
| _ROLL_ROT | 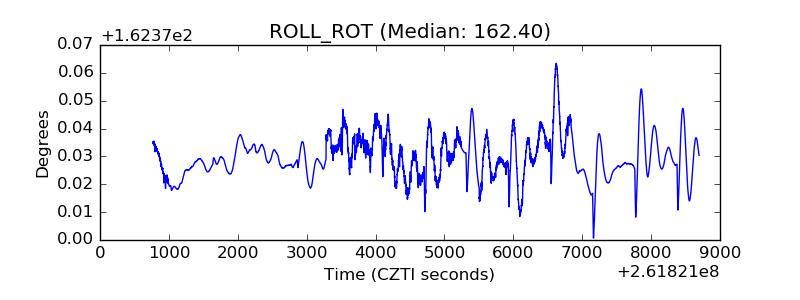 |
| _Roll_DEC | 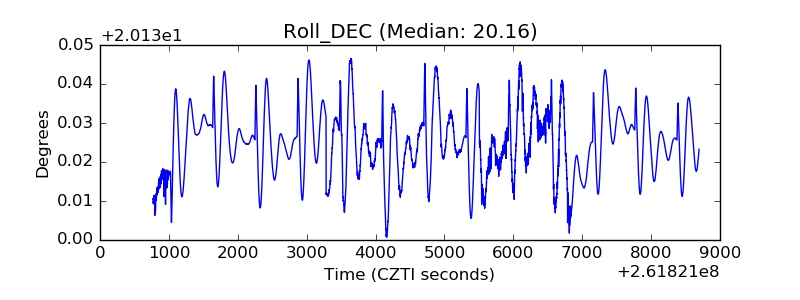 |
| _Roll_RA | 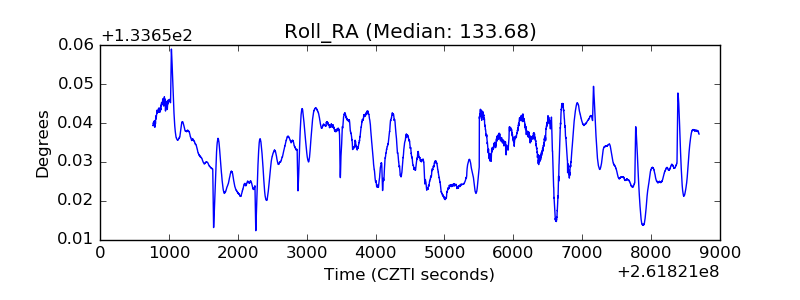 |
| Veto Counter | 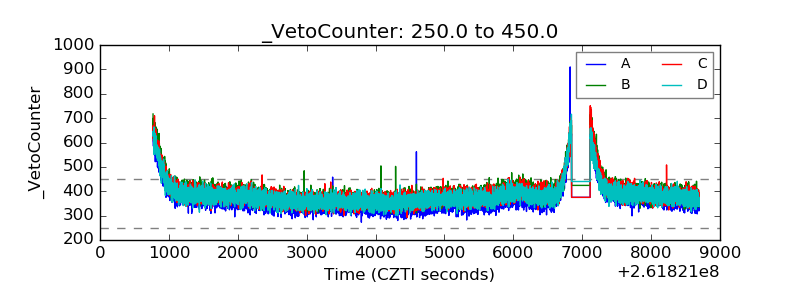 |