| Param | Original file | Final file |
|---|---|---|
| Filename | modeM0/AS1A04_199T01_9000002040_13831cztM0_level2.evt | modeM0/AS1A04_199T01_9000002040_13831cztM0_level2_quad_clean.evt |
| Size (bytes) | 1,326,980,160 | 230,192,640 |
| Size | 1.2 GB | 219.5 MB |
| Events in quadrant A | 8,446,570 | 1,461,102 |
| Events in quadrant B | 8,963,801 | 1,470,083 |
| Events in quadrant C | 8,480,064 | 1,452,061 |
| Events in quadrant D | 13,067,371 | 1,334,251 |
| Mode M9 | |||
|---|---|---|---|
| Quadrant | BADHDUFLAG | Total packets | Discarded packets |
| A | 0 | 18 | 0 |
| B | 0 | 18 | 0 |
| C | 0 | 18 | 0 |
| D | 0 | 18 | 0 |
| Mode SS | |||
|---|---|---|---|
| Quadrant | BADHDUFLAG | Total packets | Discarded packets |
| A | 0 | 370 | 0 |
| B | 0 | 370 | 0 |
| C | 0 | 370 | 0 |
| D | 0 | 370 | 0 |
| Mode M0 | |||
|---|---|---|---|
| Quadrant | BADHDUFLAG | Total packets | Discarded packets |
| A | 0 | 37338 | 4 |
| B | 0 | 38528 | 3 |
| C | 0 | 37204 | 3 |
| D | 0 | 50677 | 3 |
| Quadrant | Total seconds | Saturated seconds | Saturation percentage |
|---|---|---|---|
| A | 18200 | 201 | 1.104396% |
| B | 18200 | 324 | 1.780220% |
| C | 18200 | 119 | 0.653846% |
| D | 18200 | 988 | 5.428571% |
Noise dominated data is calculated using 1-second bins in cleaned event files. If a bin has >2000 counts, and if more than 50% of those come from <1% of pixels, then it is considered to be noise-dominated and hence unusable.
| Quadrant | # 1 sec bins | Bins with >0 counts | Bins with >2000 counts | High rate bins dominated by noise | Noise dominated (total time) | Noise dominated (detector-on time) | Marked lightcurve |
|---|---|---|---|---|---|---|---|
| A | 20021 | 18202 | 2 | 2 | 0.01% | 0.01% |  |
| B | 20021 | 18203 | 98 | 98 | 0.49% | 0.54% | 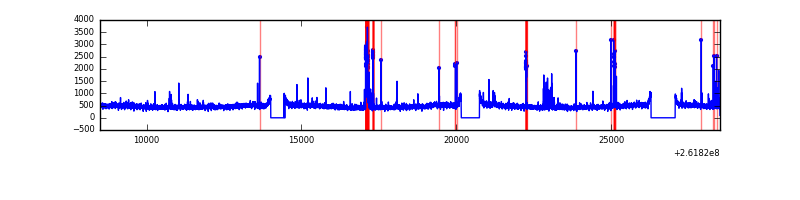 |
| C | 20021 | 18203 | 0 | 0 | 0.00% | 0.00% | 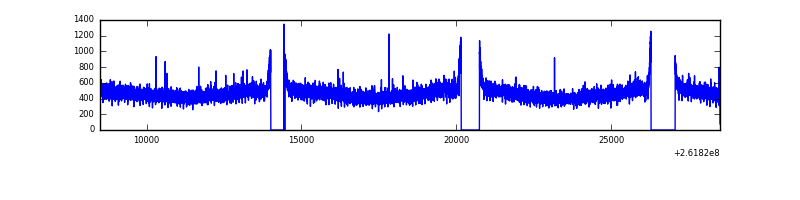 |
| D | 20021 | 18202 | 740 | 740 | 3.70% | 4.07% | 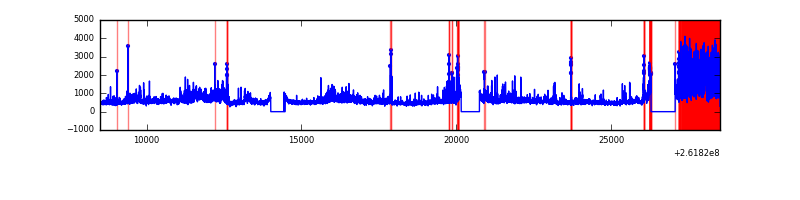 |
Top three noisy pixels from each quadrant. If the there are fewer than three noisy pixels in the level2.evt file, extra rows are filled as -1
| Pixel properties | Quadrant properties | ||||||
|---|---|---|---|---|---|---|---|
| Quadrant | DetID | PixID | Counts | Sigma | Mean | Median | Sigma |
| A | 0 | 23 | 60070 | 131.5 | 2156 | 2108 | 440.8 |
| A | 1 | 162 | 31102 | 65.78 | 2156 | 2108 | 440.8 |
| A | 9 | 143 | 29265 | 61.61 | 2156 | 2108 | 440.8 |
| B | 3 | 64 | 270706 | 655.37 | 2145 | 2089 | 409.9 |
| B | 4 | 80 | 73846 | 175.07 | 2145 | 2089 | 409.9 |
| B | 10 | 244 | 67318 | 159.14 | 2145 | 2089 | 409.9 |
| C | 3 | 233 | 299095 | 609.89 | 2097 | 2102 | 487.0 |
| C | 13 | 61 | 15040 | 26.57 | 2097 | 2102 | 487.0 |
| C | 14 | 234 | 7159 | 10.38 | 2097 | 2102 | 487.0 |
| D | 5 | 222 | 2147875 | 4333.79 | 2043 | 1981 | 495.2 |
| D | 1 | 52 | 874594 | 1762.3 | 2043 | 1981 | 495.2 |
| D | 8 | 195 | 826173 | 1664.51 | 2043 | 1981 | 495.2 |
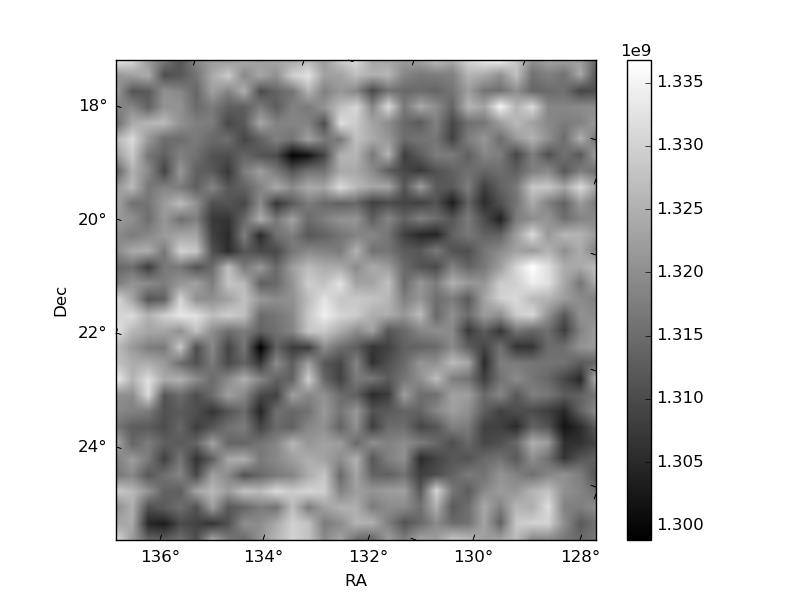
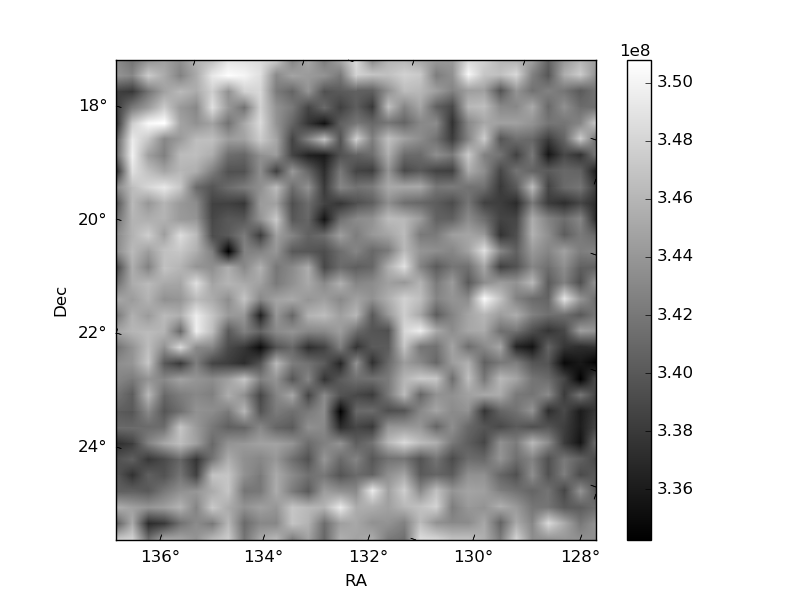
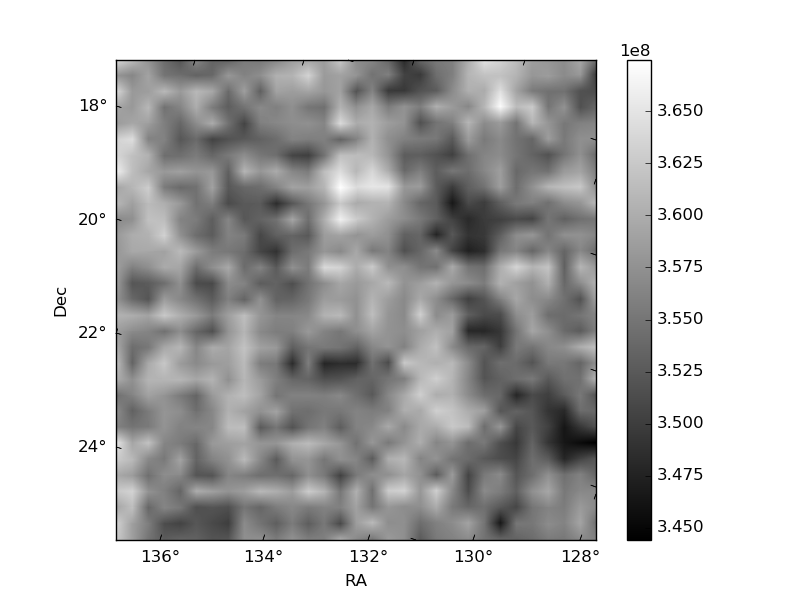
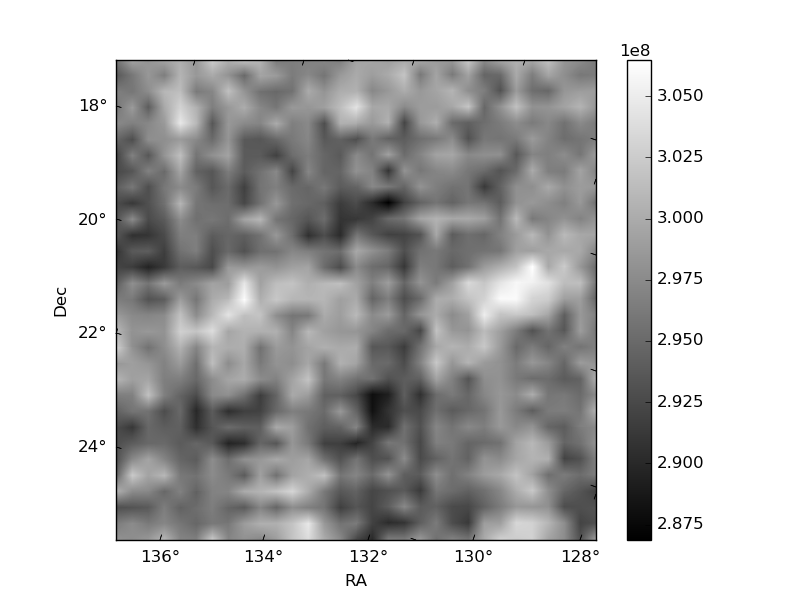
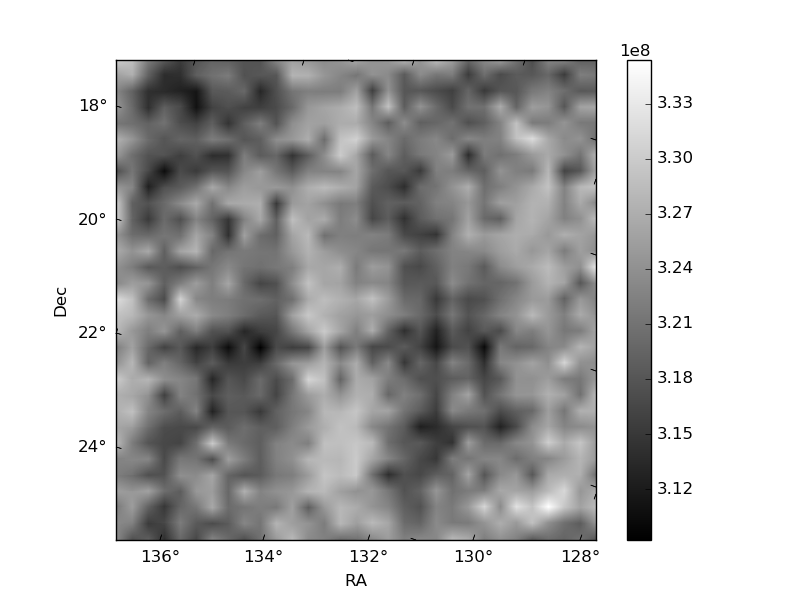
Histogram calculated using DETX and DETY for each event in the final _common_clean file
| Quadrant A | 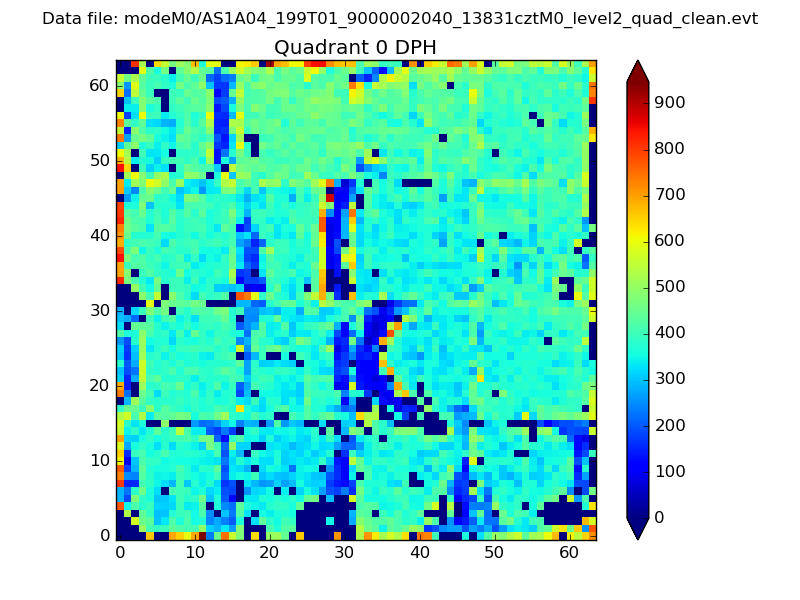 |
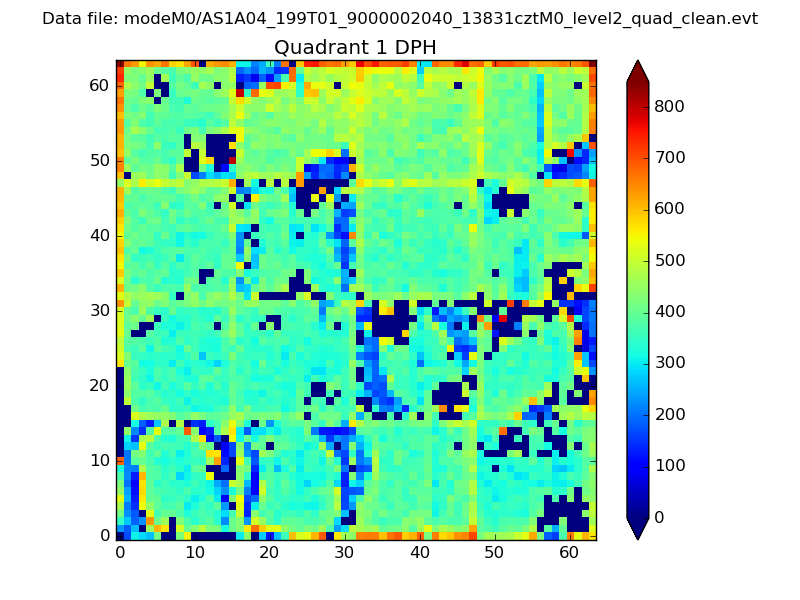 |
Quadrant B |
|---|---|---|---|
| Quadrant D | 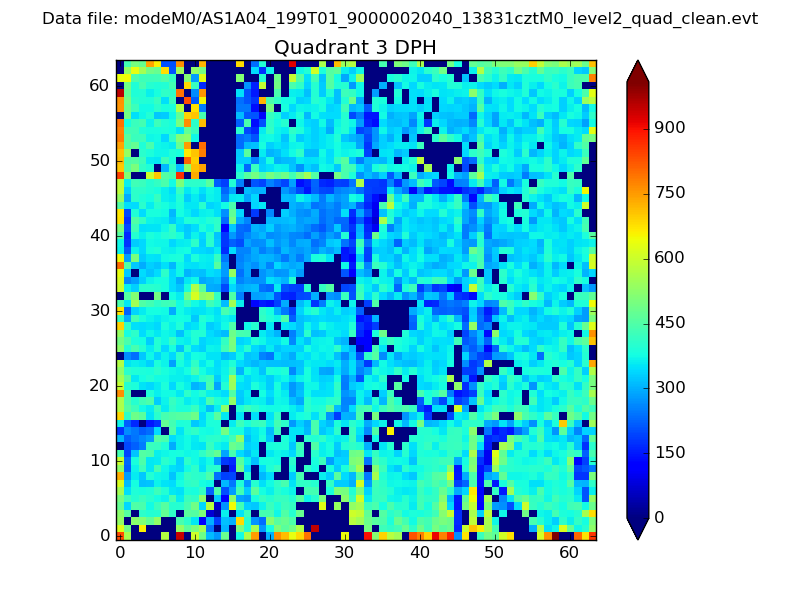 |
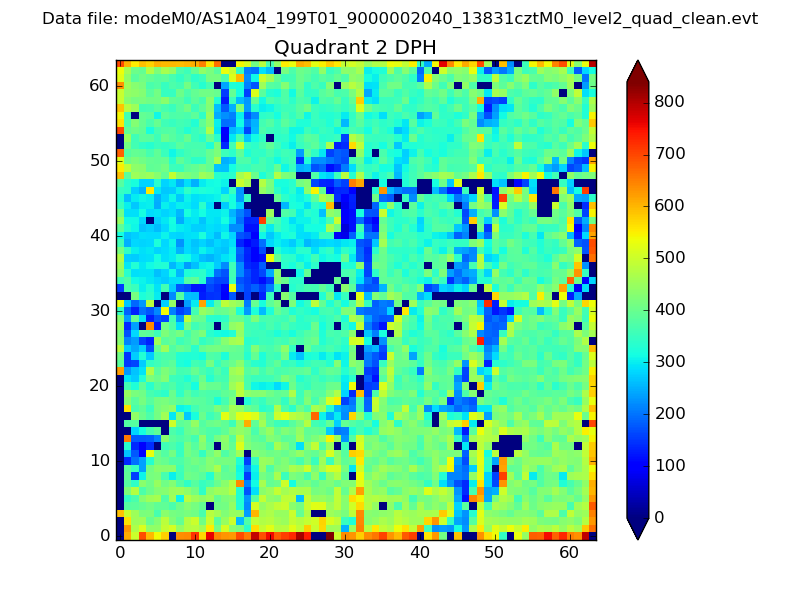 |
Quadrant C |
| Plot type | Count rate plots | Images |
|---|---|---|
| Comparison with Poisson distribution Blue bars denote a histogram of data divided into 1 sec bins. Red curve is a Poisson curve with rate = median count rate of data. |
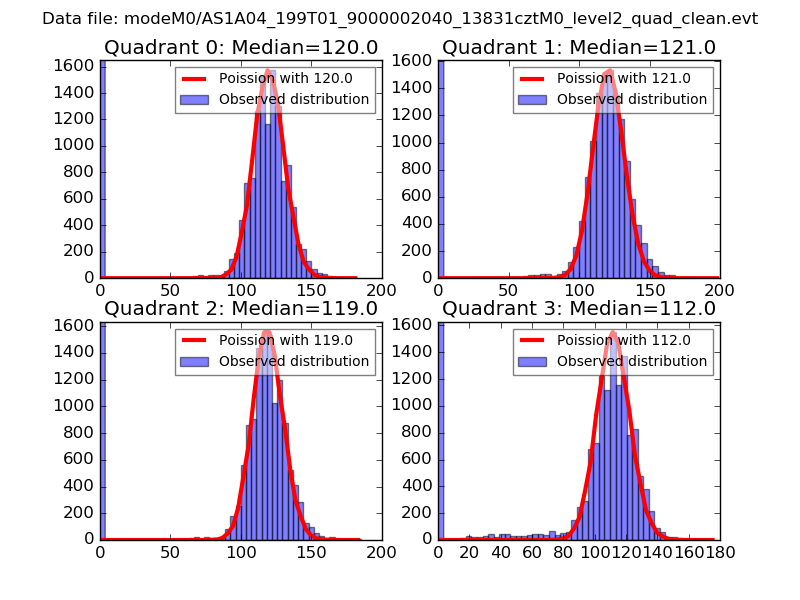 |
 |
| Quadrant-wise count rates Data is divided into 100 sec bins |
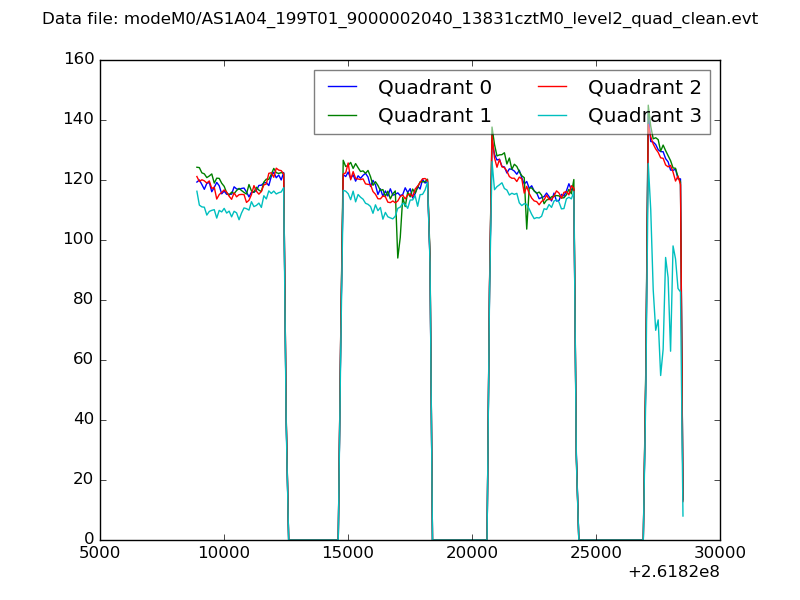 |
|
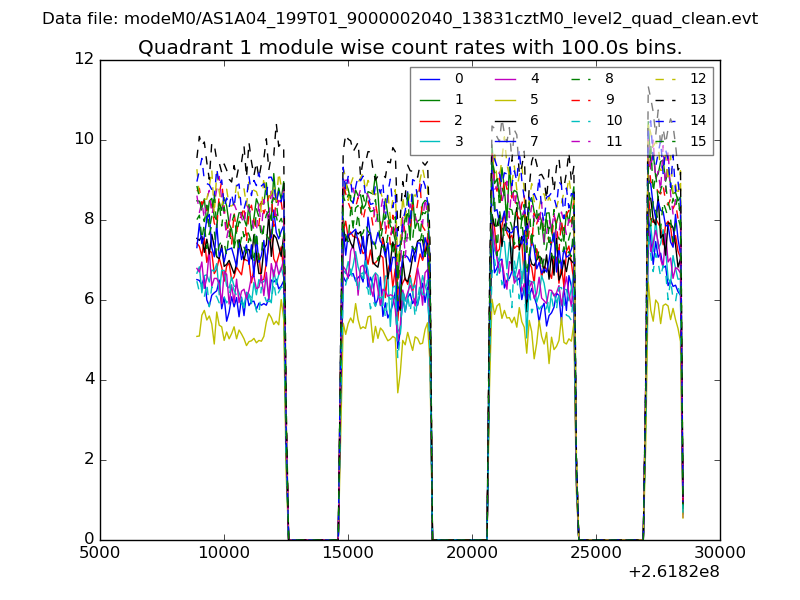
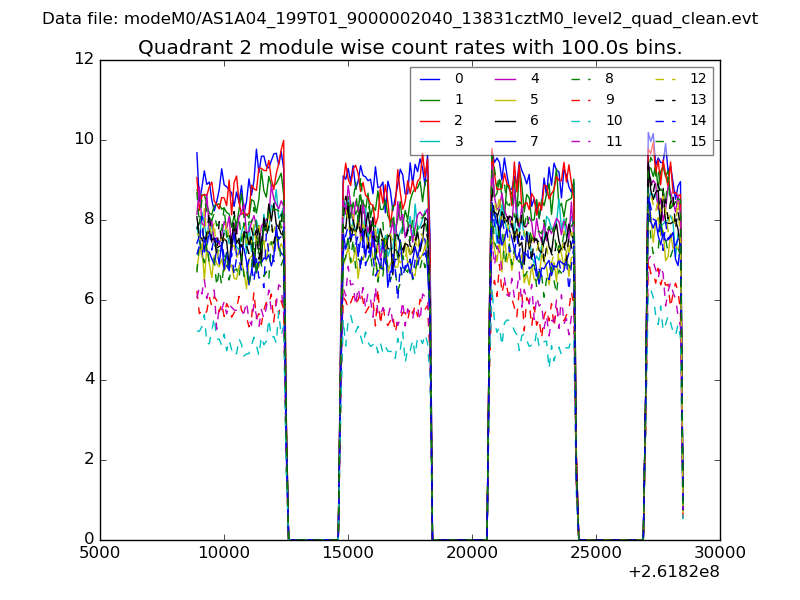
| Module-wise count rates for Quadrant A Data is divided into 100 sec bins |
 |
 |
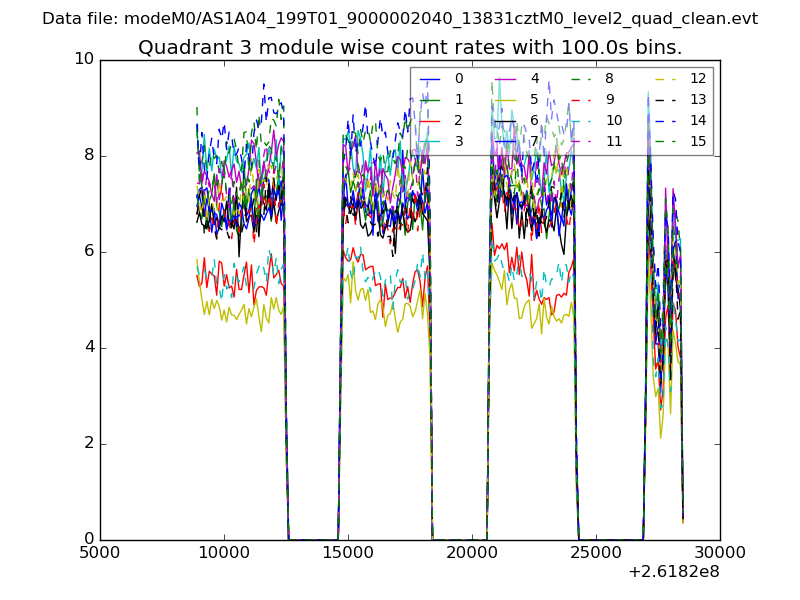
| Module-wise count rates for Quadrant B Data is divided into 100 sec bins |
 |
 |
| Module-wise count rates for Quadrant C Data is divided into 100 sec bins |
 |
 |
| Module-wise count rates for Quadrant D Data is divided into 100 sec bins |
 |
 |
| Parameter | Plot |
|---|---|
| CZT HV Monitor | 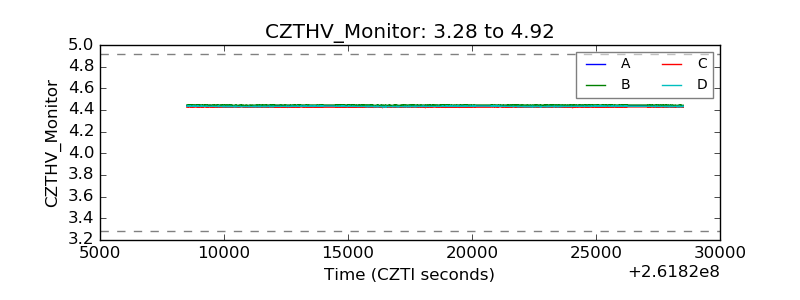 |
| D_VDD | 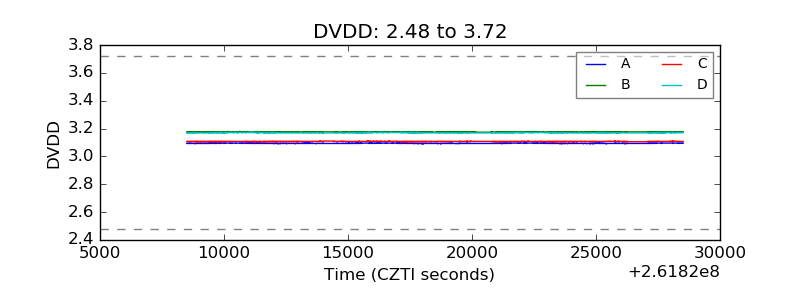 |
| Temperature 1 | 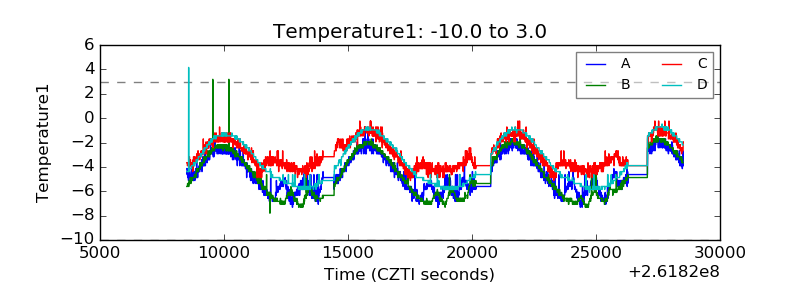 |
| Veto HV Monitor | 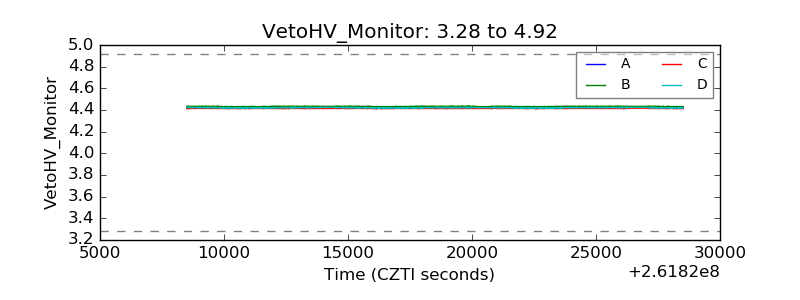 |
| Veto LLD | 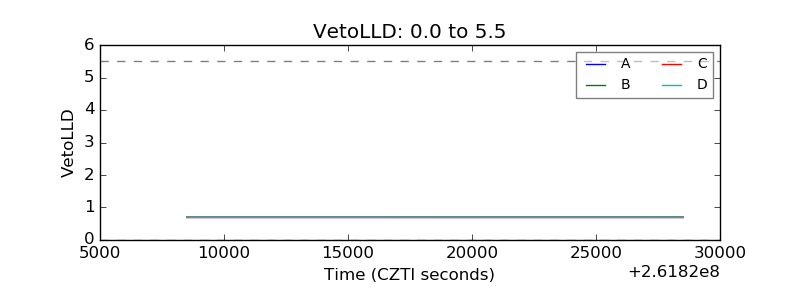 |
| Alpha Counter | 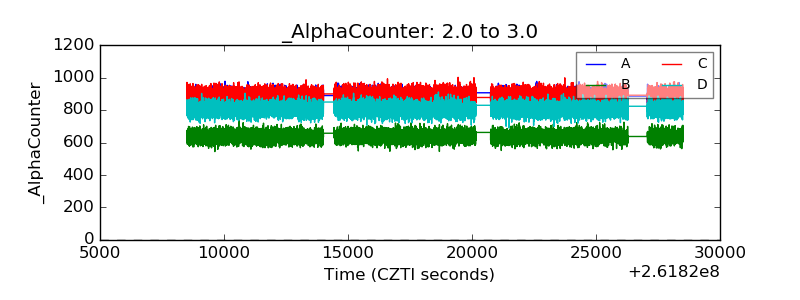 |
| _CPM_Rate | 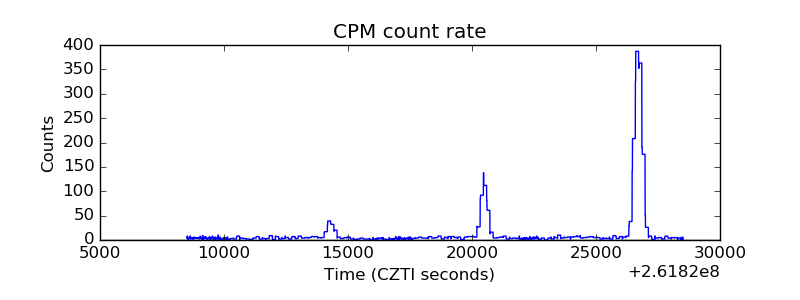 |
| CZT Counter | 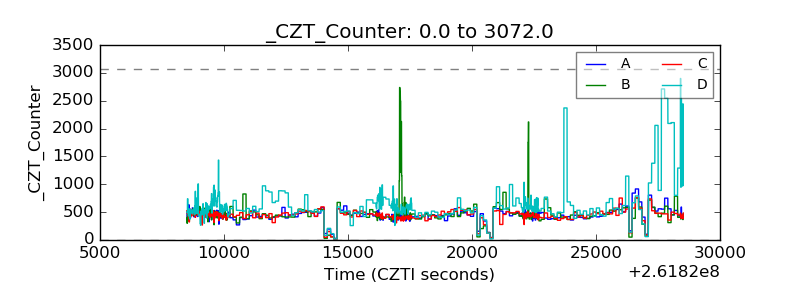 |
| +2.5 Volts monitor |  |
| +5 Volts monitor |  |
| _ROLL_ROT | 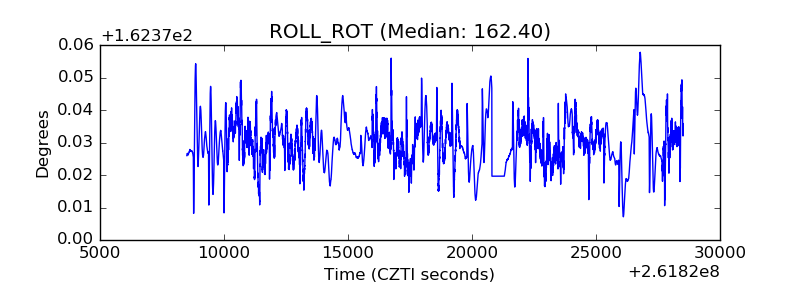 |
| _Roll_DEC | 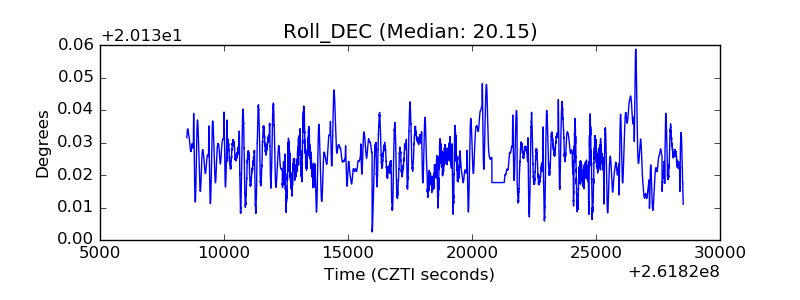 |
| _Roll_RA | 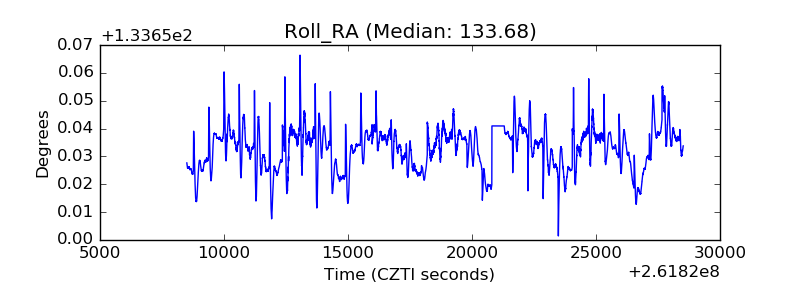 |
| Veto Counter | 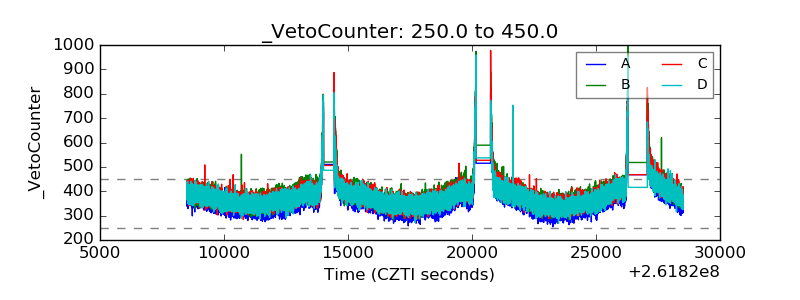 |