| Param | Original file | Final file |
|---|---|---|
| Filename | modeM0/AS1A04_199T01_9000002040_13834cztM0_level2.evt | modeM0/AS1A04_199T01_9000002040_13834cztM0_level2_quad_clean.evt |
| Size (bytes) | 500,224,320 | 87,264,000 |
| Size | 477.1 MB | 83.2 MB |
| Events in quadrant A | 3,142,472 | 557,961 |
| Events in quadrant B | 3,279,559 | 565,853 |
| Events in quadrant C | 3,039,031 | 556,576 |
| Events in quadrant D | 5,250,321 | 512,007 |
| Mode M9 | |||
|---|---|---|---|
| Quadrant | BADHDUFLAG | Total packets | Discarded packets |
| A | 0 | 16 | 0 |
| B | 0 | 16 | 0 |
| C | 0 | 16 | 0 |
| D | 0 | 17 | 0 |
| Mode SS | |||
|---|---|---|---|
| Quadrant | BADHDUFLAG | Total packets | Discarded packets |
| A | 0 | 132 | 0 |
| B | 0 | 132 | 0 |
| C | 0 | 132 | 0 |
| D | 0 | 132 | 0 |
| Mode M0 | |||
|---|---|---|---|
| Quadrant | BADHDUFLAG | Total packets | Discarded packets |
| A | 0 | 13555 | 3 |
| B | 0 | 13928 | 2 |
| C | 0 | 13249 | 2 |
| D | 0 | 19909 | 2 |
| Quadrant | Total seconds | Saturated seconds | Saturation percentage |
|---|---|---|---|
| A | 6448 | 66 | 1.023573% |
| B | 6448 | 88 | 1.364764% |
| C | 6448 | 28 | 0.434243% |
| D | 6448 | 504 | 7.816377% |
Noise dominated data is calculated using 1-second bins in cleaned event files. If a bin has >2000 counts, and if more than 50% of those come from <1% of pixels, then it is considered to be noise-dominated and hence unusable.
| Quadrant | # 1 sec bins | Bins with >0 counts | Bins with >2000 counts | High rate bins dominated by noise | Noise dominated (total time) | Noise dominated (detector-on time) | Marked lightcurve |
|---|---|---|---|---|---|---|---|
| A | 7539 | 6449 | 18 | 18 | 0.24% | 0.28% | 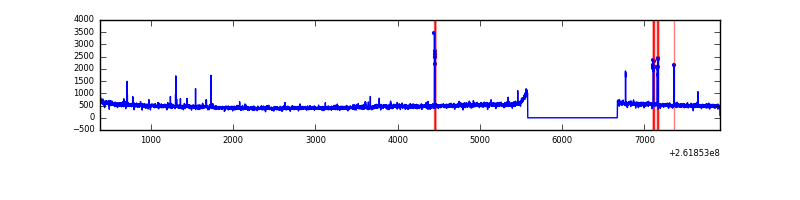 |
| B | 7539 | 6449 | 28 | 28 | 0.37% | 0.43% | 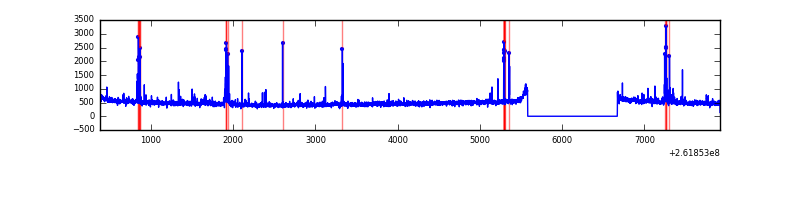 |
| C | 7539 | 6449 | 0 | 0 | 0.00% | 0.00% | 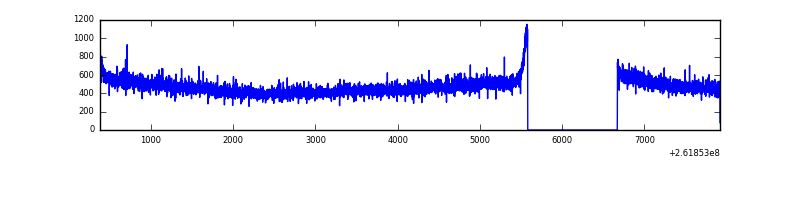 |
| D | 7539 | 6449 | 428 | 428 | 5.68% | 6.64% | 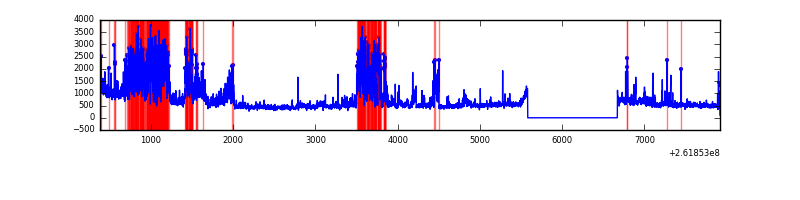 |
Top three noisy pixels from each quadrant. If the there are fewer than three noisy pixels in the level2.evt file, extra rows are filled as -1
| Pixel properties | Quadrant properties | ||||||
|---|---|---|---|---|---|---|---|
| Quadrant | DetID | PixID | Counts | Sigma | Mean | Median | Sigma |
| A | 0 | 23 | 116802 | 728.95 | 777 | 760 | 159.2 |
| A | 9 | 143 | 21463 | 130.05 | 777 | 760 | 159.2 |
| A | 0 | 226 | 14625 | 87.1 | 777 | 760 | 159.2 |
| B | 3 | 64 | 101927 | 683.02 | 778 | 761 | 148.1 |
| B | 10 | 245 | 43027 | 285.36 | 778 | 761 | 148.1 |
| B | 4 | 80 | 40200 | 266.27 | 778 | 761 | 148.1 |
| C | 3 | 233 | 78232 | 437.37 | 759 | 763 | 177.1 |
| C | 13 | 61 | 5440 | 26.41 | 759 | 763 | 177.1 |
| C | 3 | 202 | 1812 | 5.92 | 759 | 763 | 177.1 |
| D | 5 | 222 | 1332614 | 7451.86 | 738 | 716 | 178.7 |
| D | 1 | 52 | 528292 | 2951.74 | 738 | 716 | 178.7 |
| D | 13 | 122 | 491117 | 2743.75 | 738 | 716 | 178.7 |
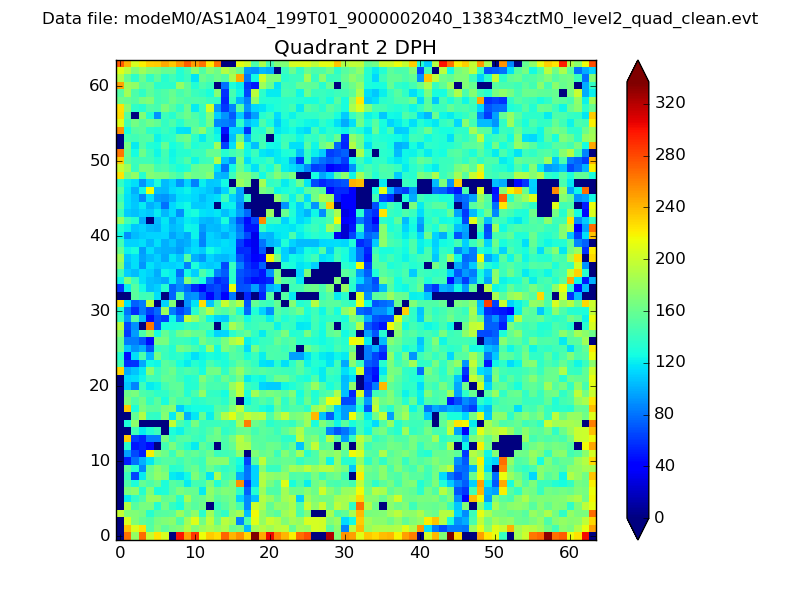
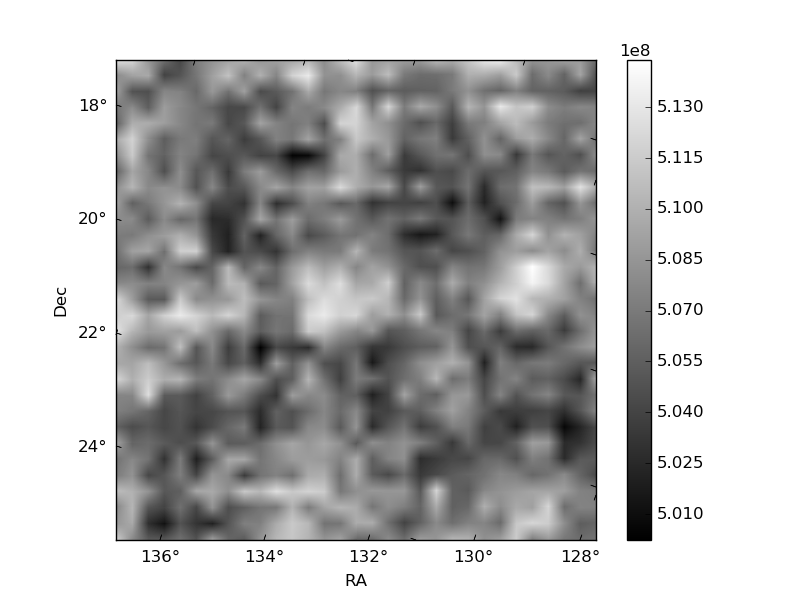
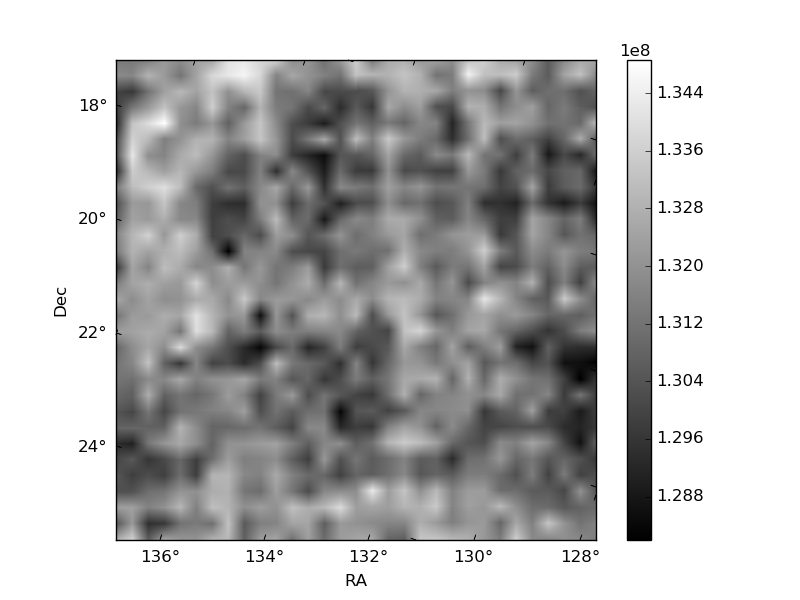
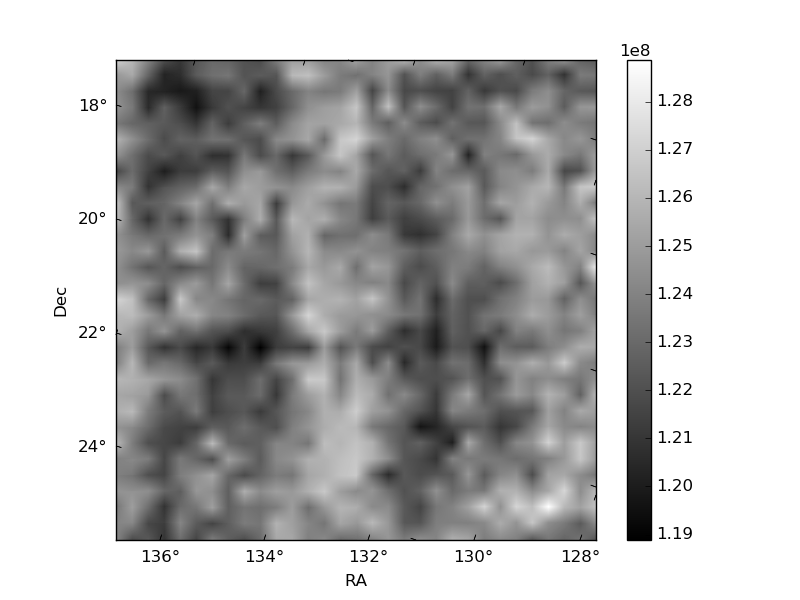
Histogram calculated using DETX and DETY for each event in the final _common_clean file
| Quadrant A | 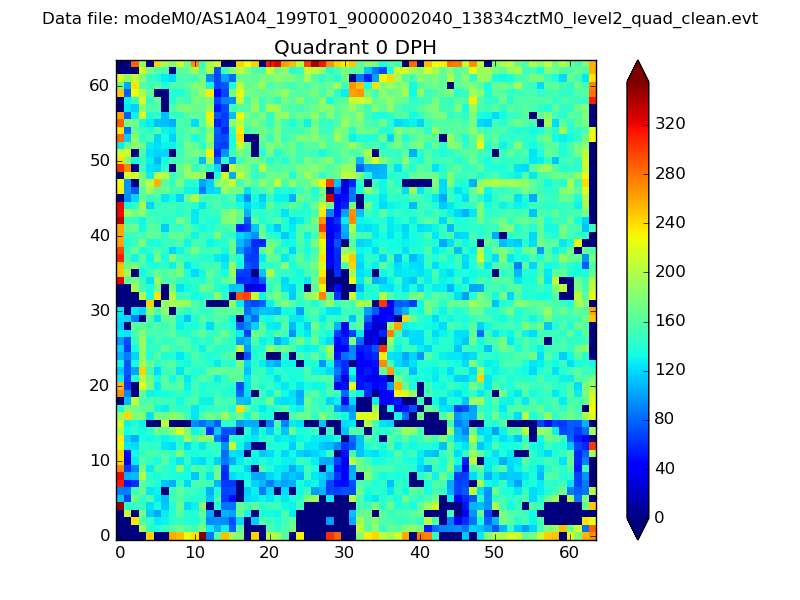 |
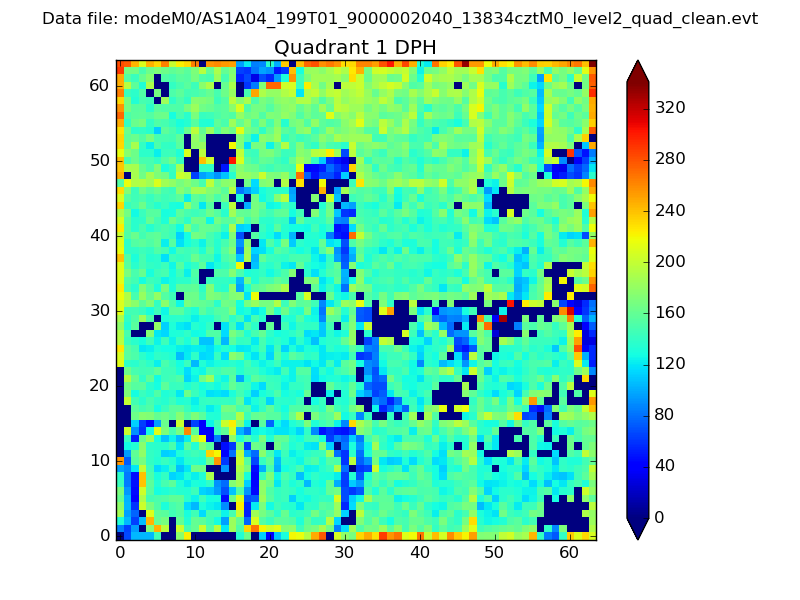 |
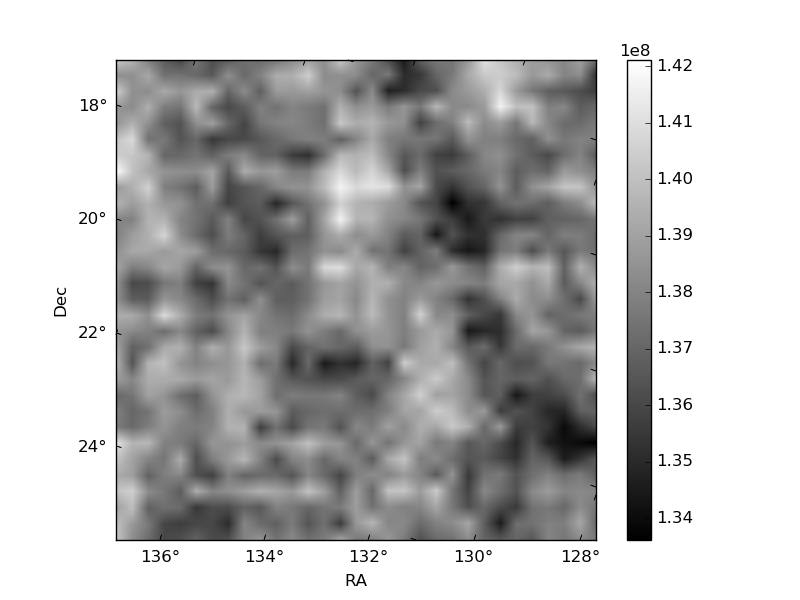
Quadrant B |
|---|---|---|---|
| Quadrant D | 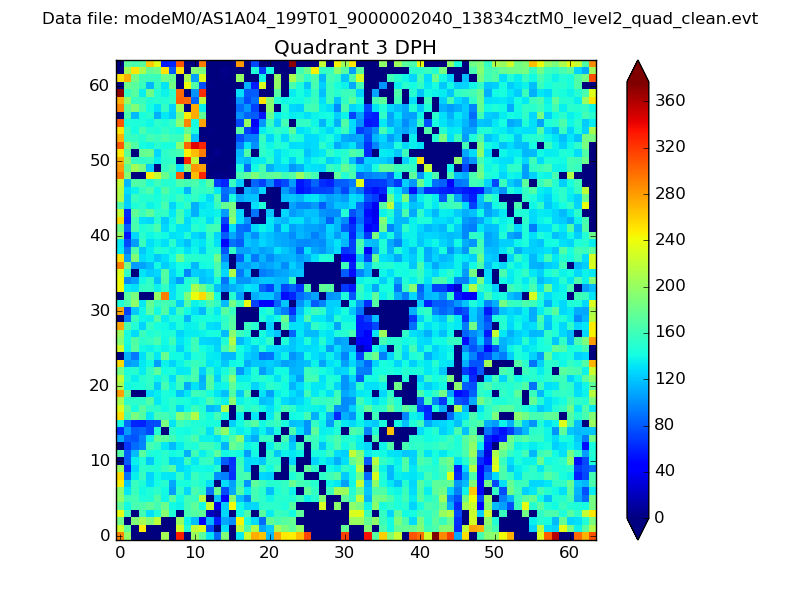 |
 |
Quadrant C |
| Plot type | Count rate plots | Images |
|---|---|---|
| Comparison with Poisson distribution Blue bars denote a histogram of data divided into 1 sec bins. Red curve is a Poisson curve with rate = median count rate of data. |
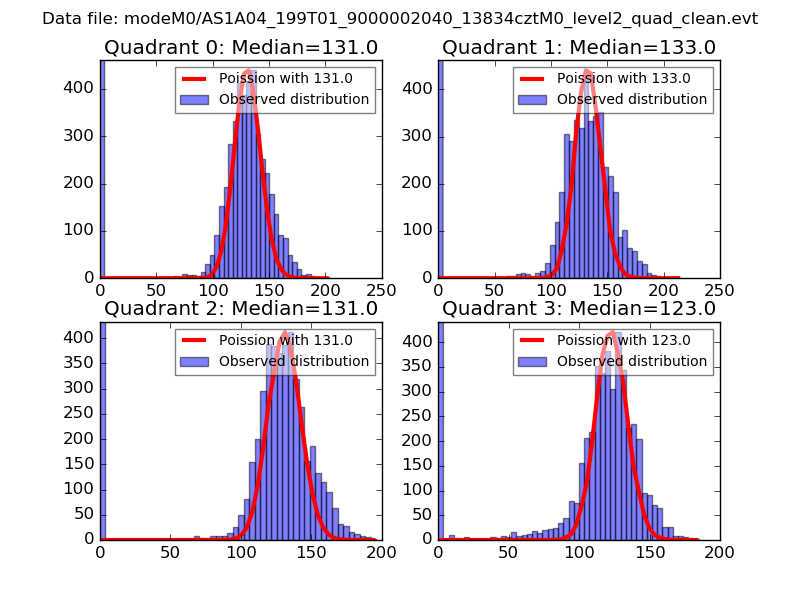 |
 |
| Quadrant-wise count rates Data is divided into 100 sec bins |
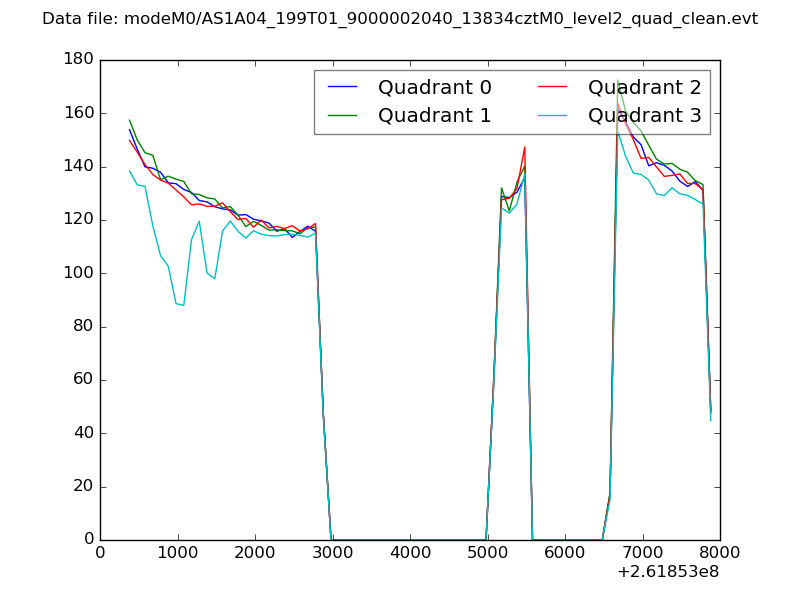 |
|
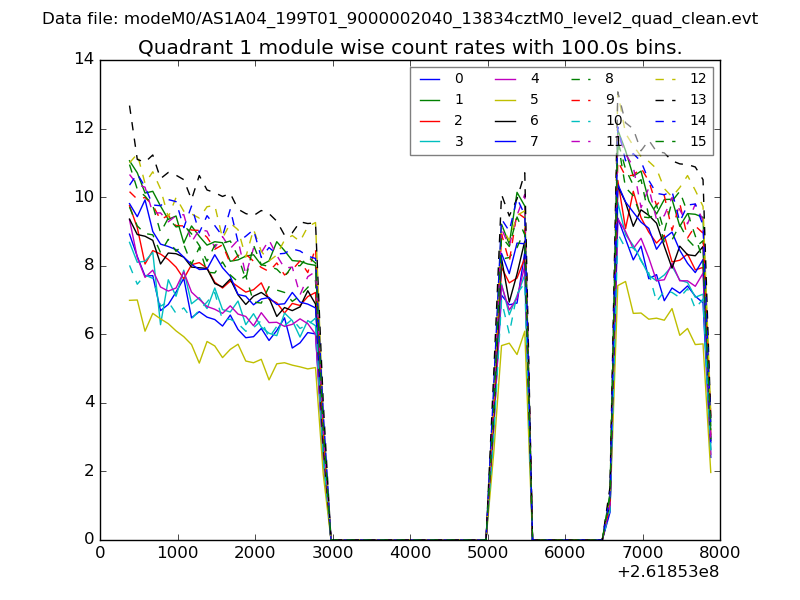
| Module-wise count rates for Quadrant A Data is divided into 100 sec bins |
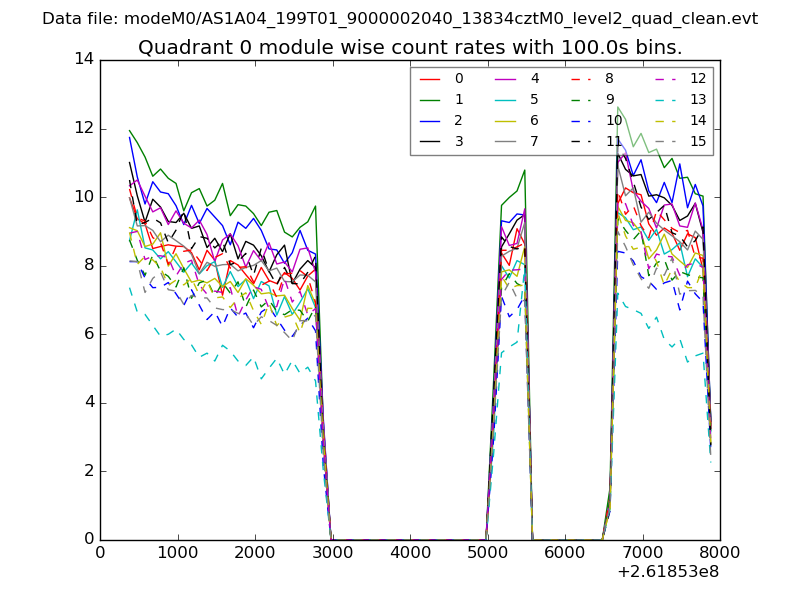 |
 |
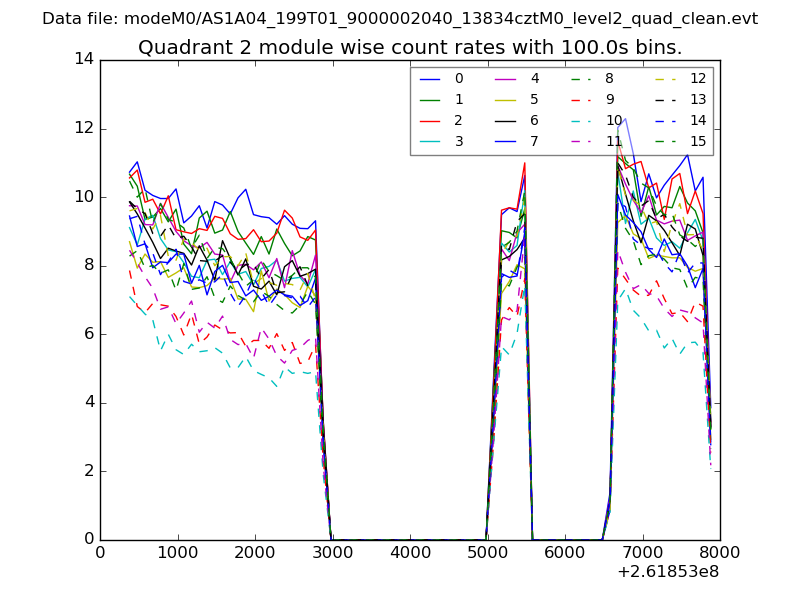
| Module-wise count rates for Quadrant B Data is divided into 100 sec bins |
 |
 |
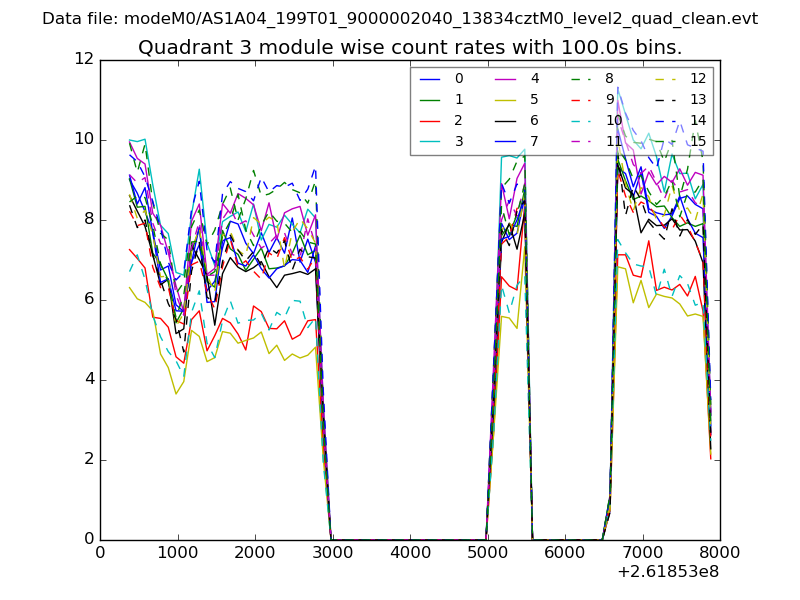
| Module-wise count rates for Quadrant C Data is divided into 100 sec bins |
 |
 |
| Module-wise count rates for Quadrant D Data is divided into 100 sec bins |
 |
 |
| Parameter | Plot |
|---|---|
| CZT HV Monitor | 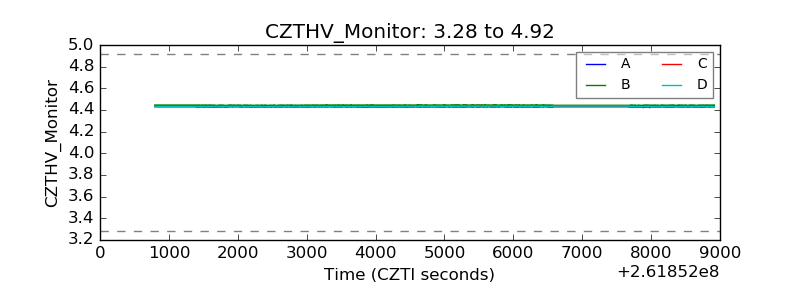 |
| D_VDD | 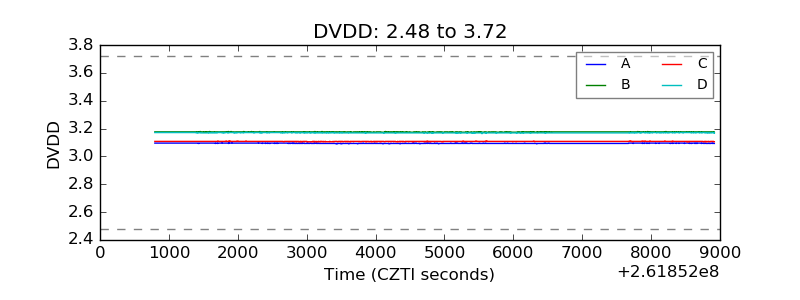 |
| Temperature 1 |  |
| Veto HV Monitor | 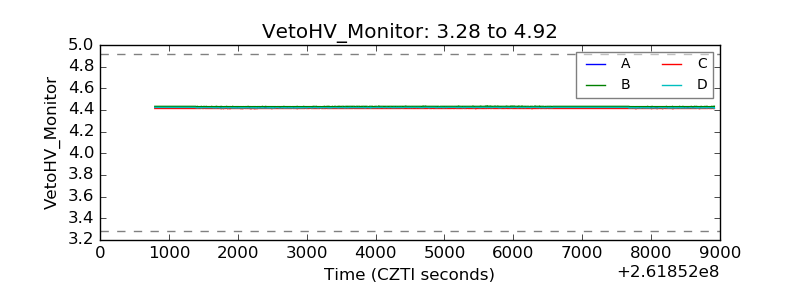 |
| Veto LLD | 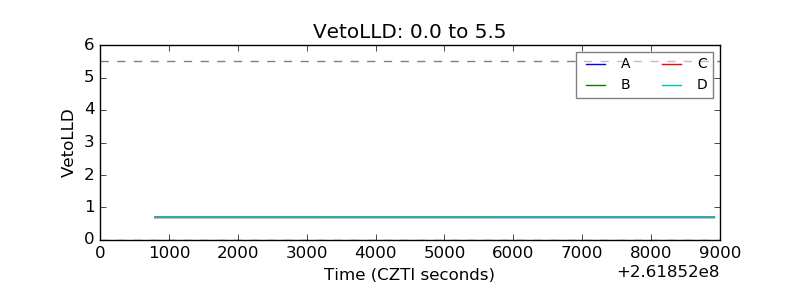 |
| Alpha Counter | 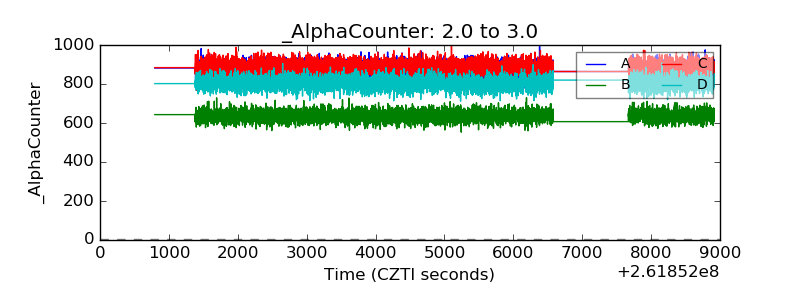 |
| _CPM_Rate | 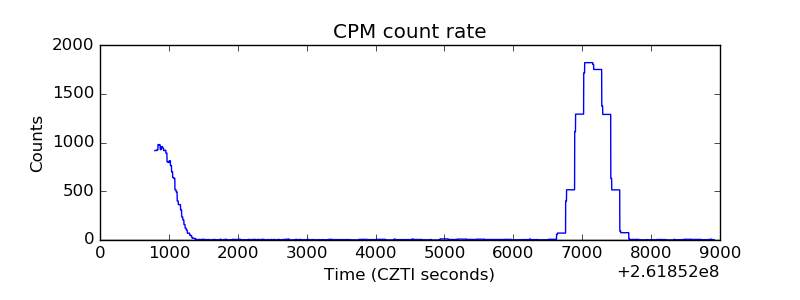 |
| CZT Counter | 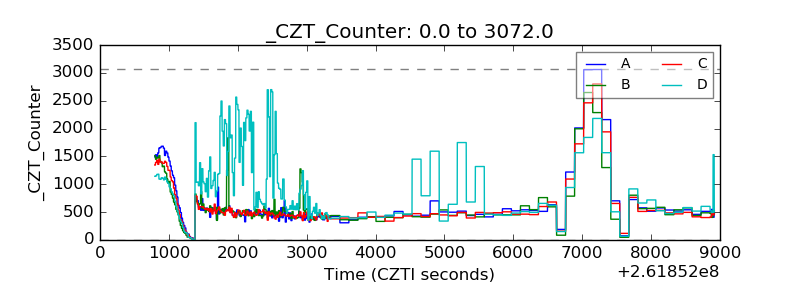 |
| +2.5 Volts monitor | 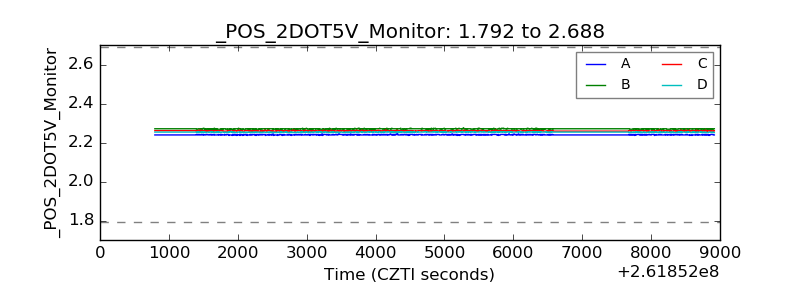 |
| +5 Volts monitor |  |
| _ROLL_ROT | 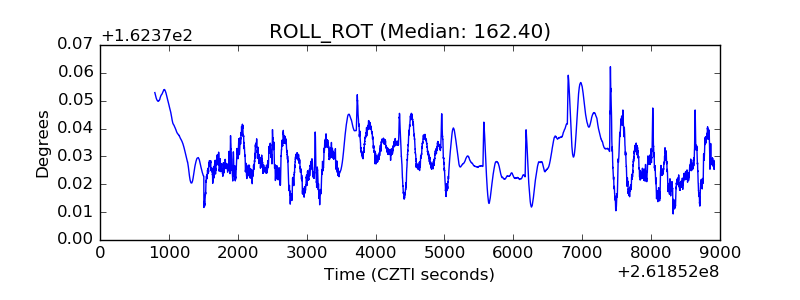 |
| _Roll_DEC | 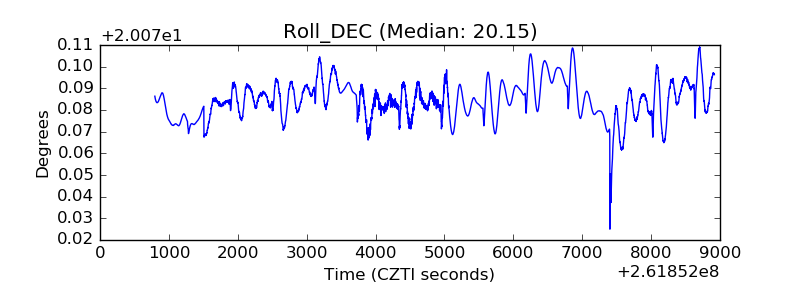 |
| _Roll_RA | 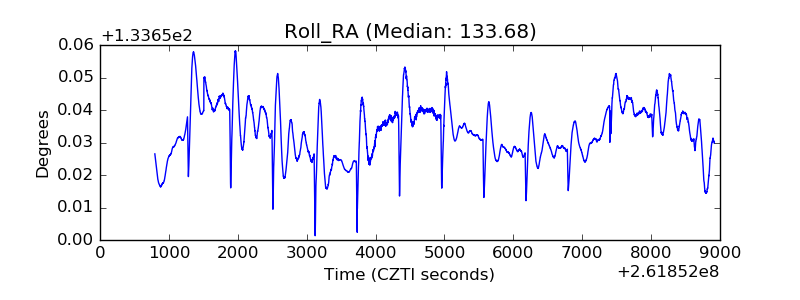 |
| Veto Counter | 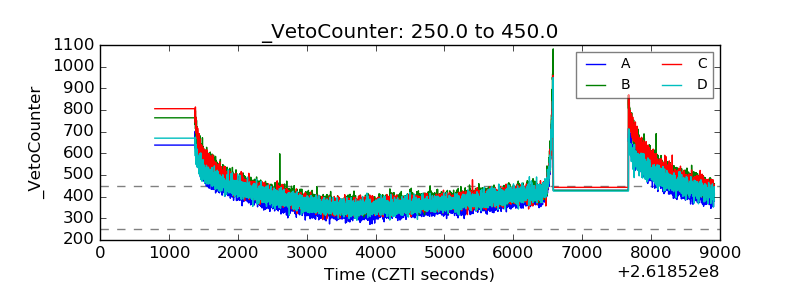 |