| Param | Original file | Final file |
|---|---|---|
| Filename | modeM0/AS1A04_199T01_9000002040_13835cztM0_level2.evt | modeM0/AS1A04_199T01_9000002040_13835cztM0_level2_quad_clean.evt |
| Size (bytes) | 437,189,760 | 89,665,920 |
| Size | 416.9 MB | 85.5 MB |
| Events in quadrant A | 3,197,691 | 572,527 |
| Events in quadrant B | 3,202,802 | 588,150 |
| Events in quadrant C | 3,037,055 | 571,154 |
| Events in quadrant D | 3,372,335 | 541,541 |
| Mode M9 | |||
|---|---|---|---|
| Quadrant | BADHDUFLAG | Total packets | Discarded packets |
| A | 0 | 16 | 0 |
| B | 0 | 16 | 0 |
| C | 0 | 16 | 0 |
| D | 0 | 17 | 0 |
| Mode SS | |||
|---|---|---|---|
| Quadrant | BADHDUFLAG | Total packets | Discarded packets |
| A | 0 | 130 | 0 |
| B | 0 | 130 | 0 |
| C | 0 | 130 | 0 |
| D | 0 | 130 | 0 |
| Mode M0 | |||
|---|---|---|---|
| Quadrant | BADHDUFLAG | Total packets | Discarded packets |
| A | 0 | 13533 | 3 |
| B | 0 | 13556 | 2 |
| C | 0 | 13056 | 2 |
| D | 0 | 14267 | 2 |
| Quadrant | Total seconds | Saturated seconds | Saturation percentage |
|---|---|---|---|
| A | 6328 | 64 | 1.011378% |
| B | 6328 | 49 | 0.774336% |
| C | 6328 | 19 | 0.300253% |
| D | 6328 | 36 | 0.568900% |
Noise dominated data is calculated using 1-second bins in cleaned event files. If a bin has >2000 counts, and if more than 50% of those come from <1% of pixels, then it is considered to be noise-dominated and hence unusable.
| Quadrant | # 1 sec bins | Bins with >0 counts | Bins with >2000 counts | High rate bins dominated by noise | Noise dominated (total time) | Noise dominated (detector-on time) | Marked lightcurve |
|---|---|---|---|---|---|---|---|
| A | 7534 | 6330 | 24 | 24 | 0.32% | 0.38% | 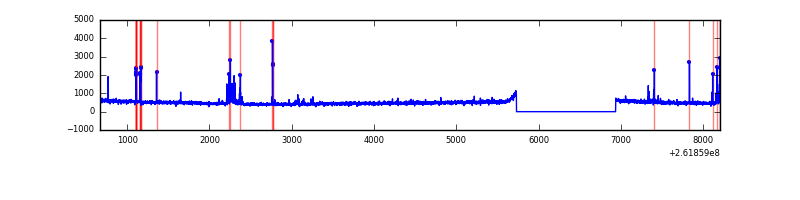 |
| B | 7534 | 6329 | 11 | 11 | 0.15% | 0.17% | 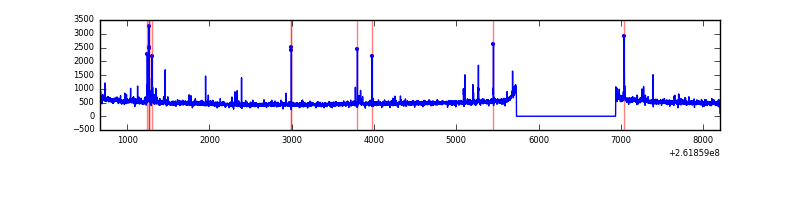 |
| C | 7534 | 6330 | 0 | 0 | 0.00% | 0.00% | 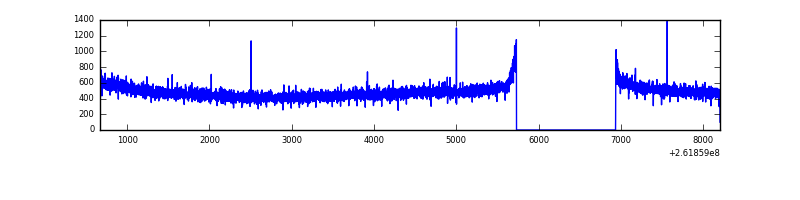 |
| D | 7534 | 6330 | 12 | 12 | 0.16% | 0.19% | 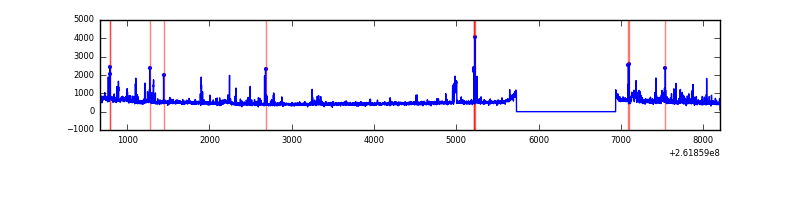 |
Top three noisy pixels from each quadrant. If the there are fewer than three noisy pixels in the level2.evt file, extra rows are filled as -1
| Pixel properties | Quadrant properties | ||||||
|---|---|---|---|---|---|---|---|
| Quadrant | DetID | PixID | Counts | Sigma | Mean | Median | Sigma |
| A | 9 | 143 | 92619 | 577.16 | 775 | 759 | 159.2 |
| A | 0 | 23 | 90190 | 561.9 | 775 | 759 | 159.2 |
| A | 15 | 69 | 17499 | 105.18 | 775 | 759 | 159.2 |
| B | 10 | 245 | 56855 | 380.38 | 781 | 764 | 147.5 |
| B | 4 | 80 | 21876 | 143.17 | 781 | 764 | 147.5 |
| B | 0 | 219 | 21526 | 140.8 | 781 | 764 | 147.5 |
| C | 3 | 233 | 81785 | 460.07 | 758 | 763 | 176.1 |
| C | 13 | 61 | 5349 | 26.04 | 758 | 763 | 176.1 |
| C | 14 | 234 | 1882 | 6.35 | 758 | 763 | 176.1 |
| D | 1 | 52 | 184014 | 1004.53 | 750 | 729 | 182.5 |
| D | 5 | 222 | 107546 | 585.43 | 750 | 729 | 182.5 |
| D | 10 | 157 | 99331 | 540.41 | 750 | 729 | 182.5 |
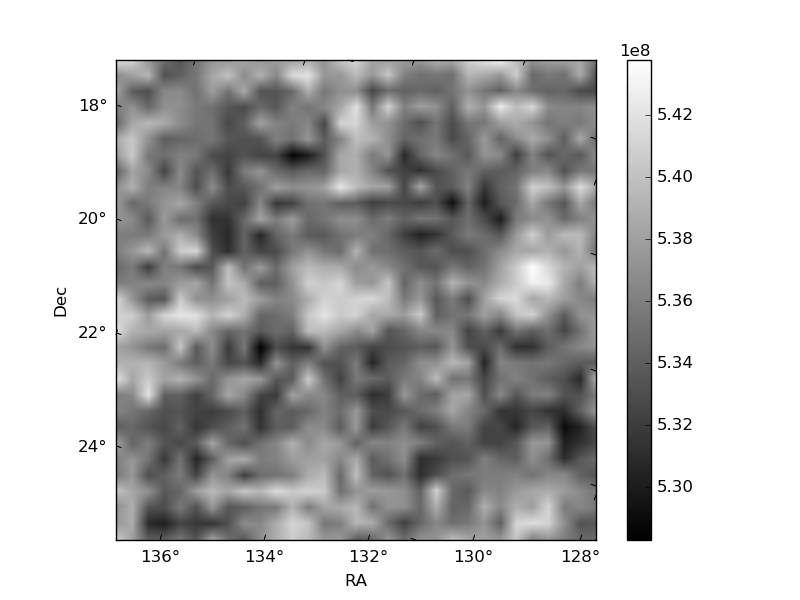
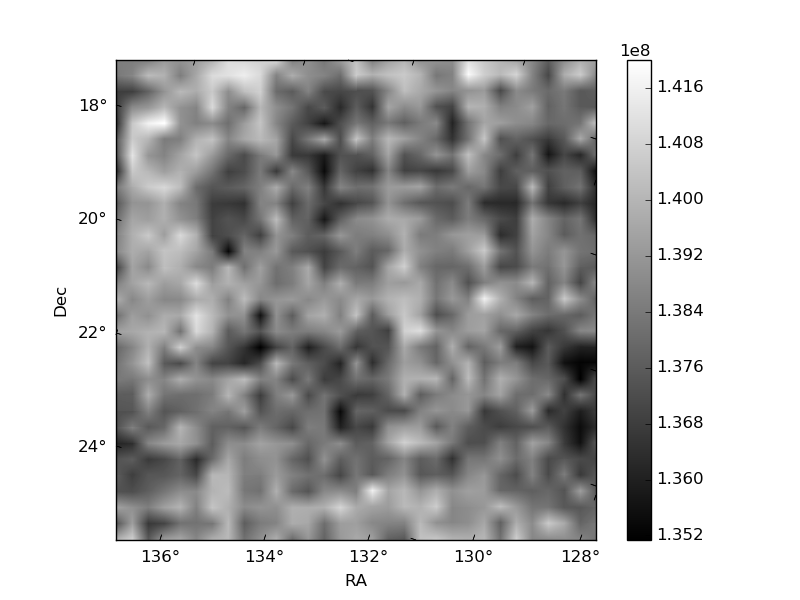
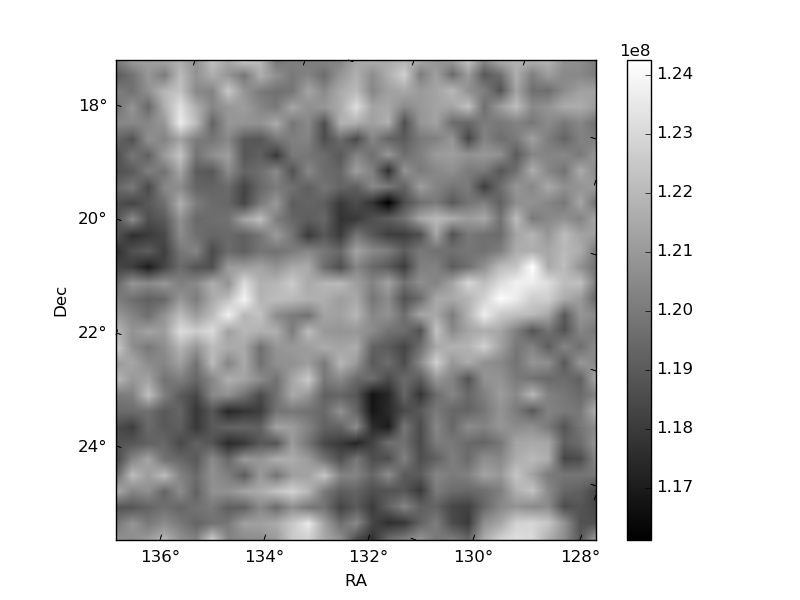
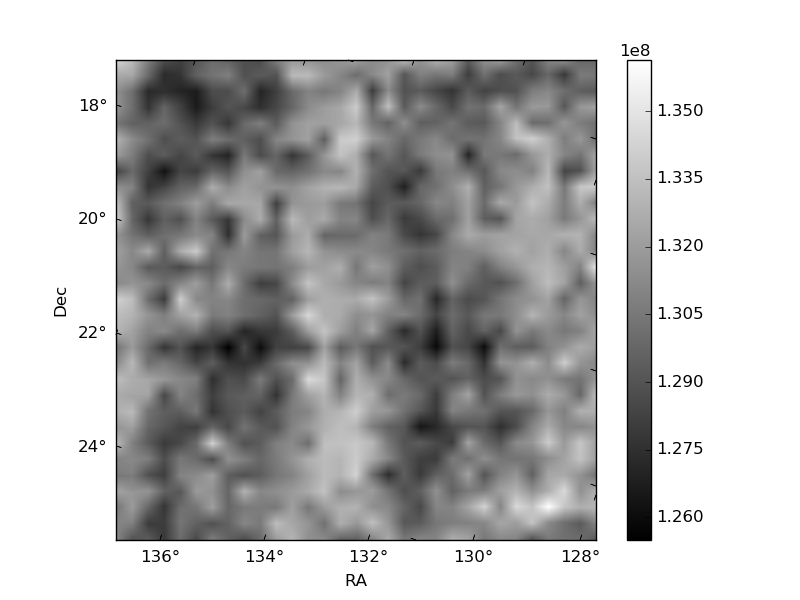
Histogram calculated using DETX and DETY for each event in the final _common_clean file
| Quadrant A | 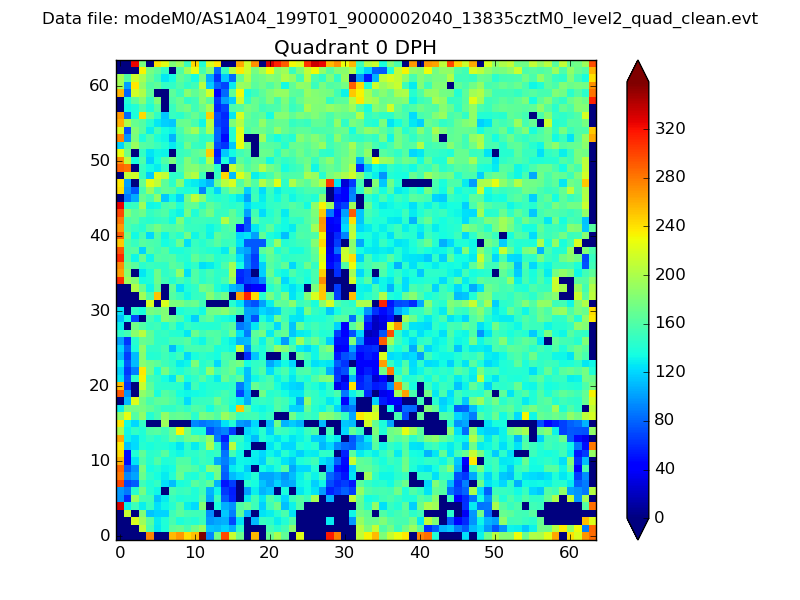 |
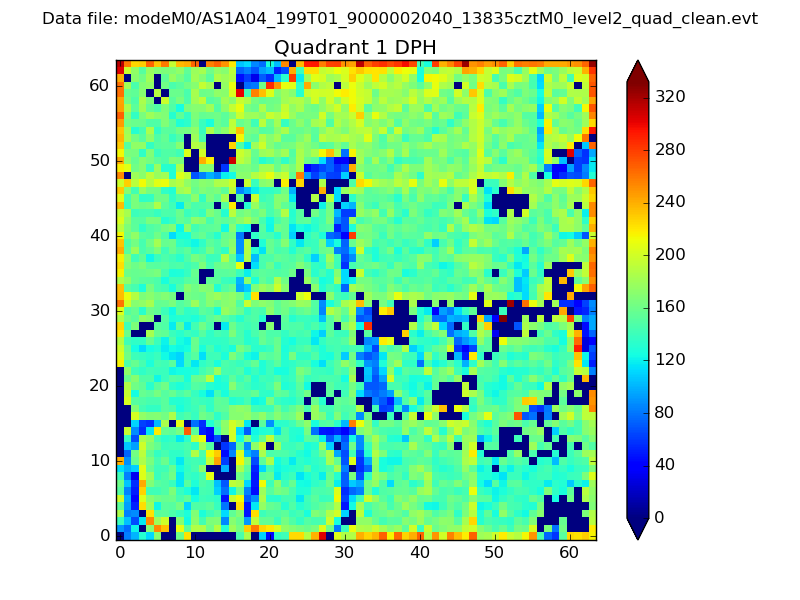 |
Quadrant B |
|---|---|---|---|
| Quadrant D | 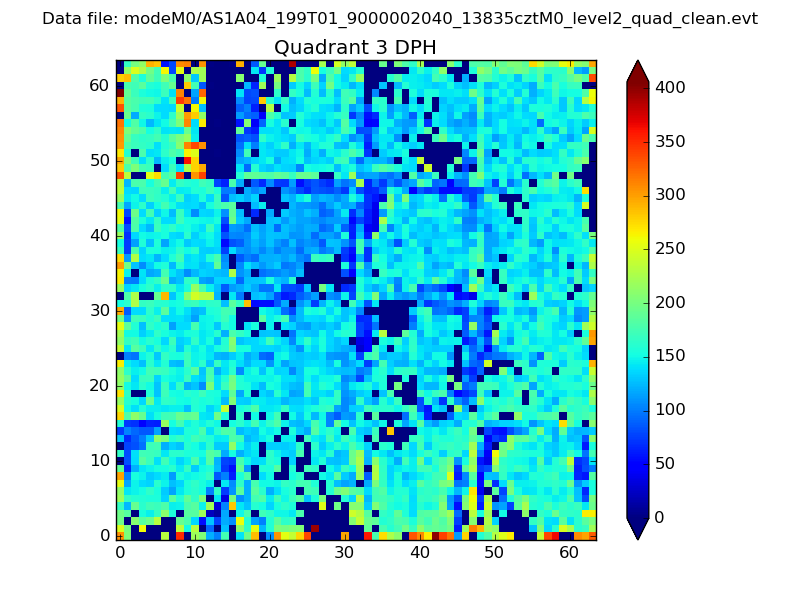 |
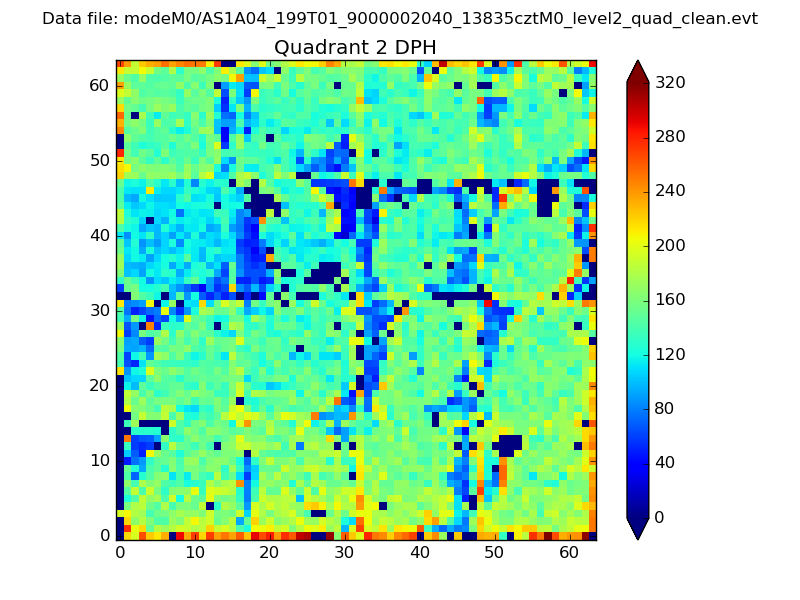 |
Quadrant C |
| Plot type | Count rate plots | Images |
|---|---|---|
| Comparison with Poisson distribution Blue bars denote a histogram of data divided into 1 sec bins. Red curve is a Poisson curve with rate = median count rate of data. |
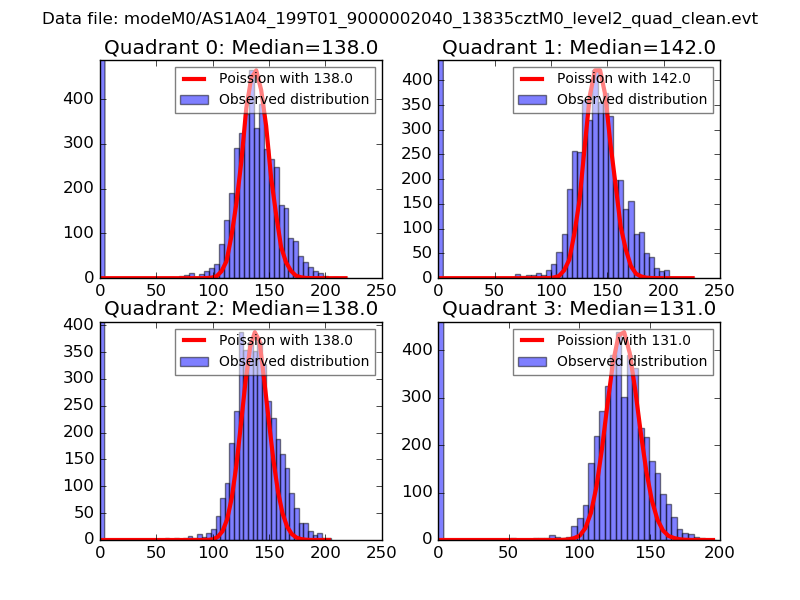 |
 |
| Quadrant-wise count rates Data is divided into 100 sec bins |
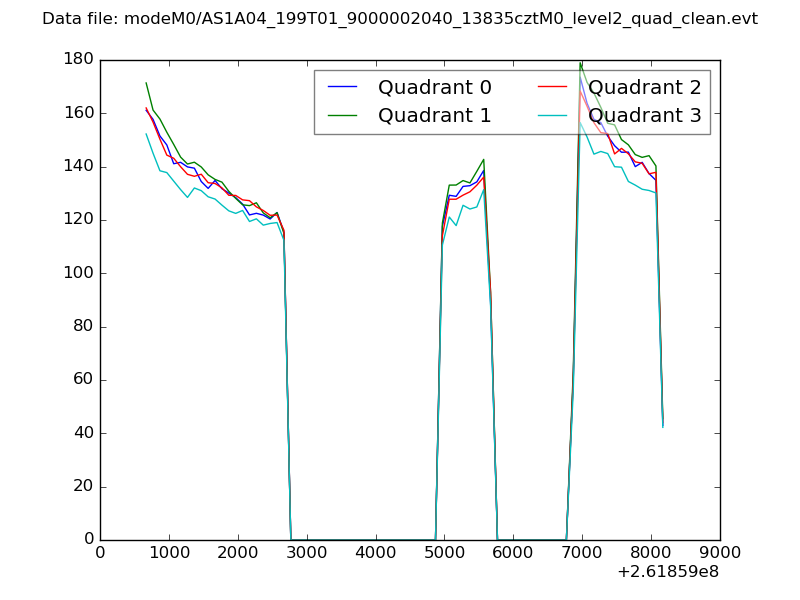 |
|
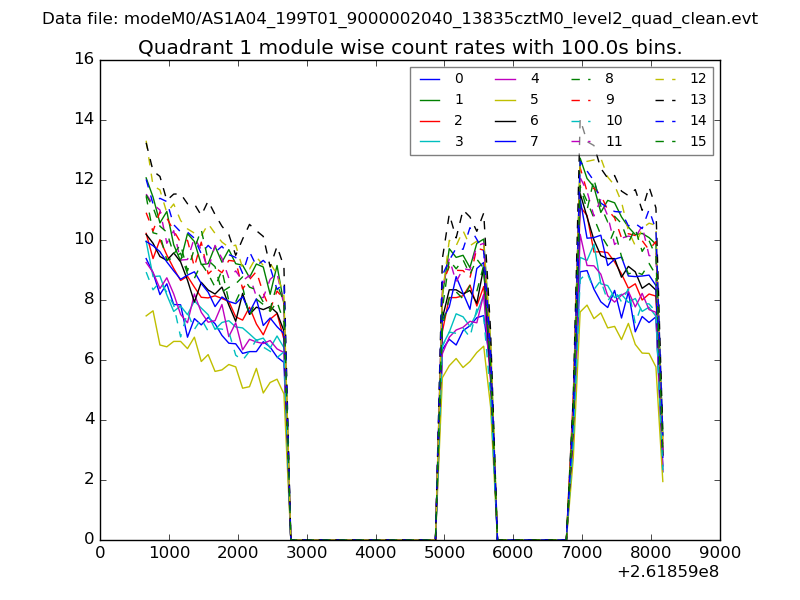
| Module-wise count rates for Quadrant A Data is divided into 100 sec bins |
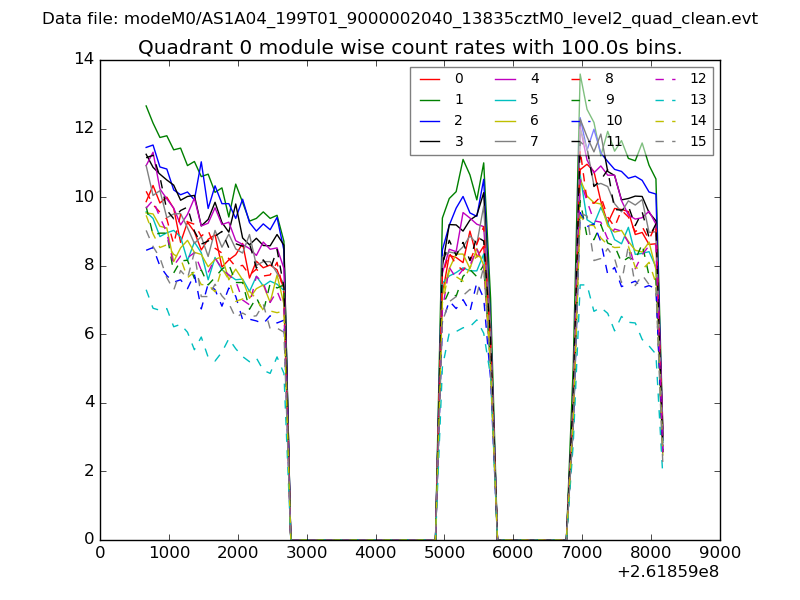 |
 |
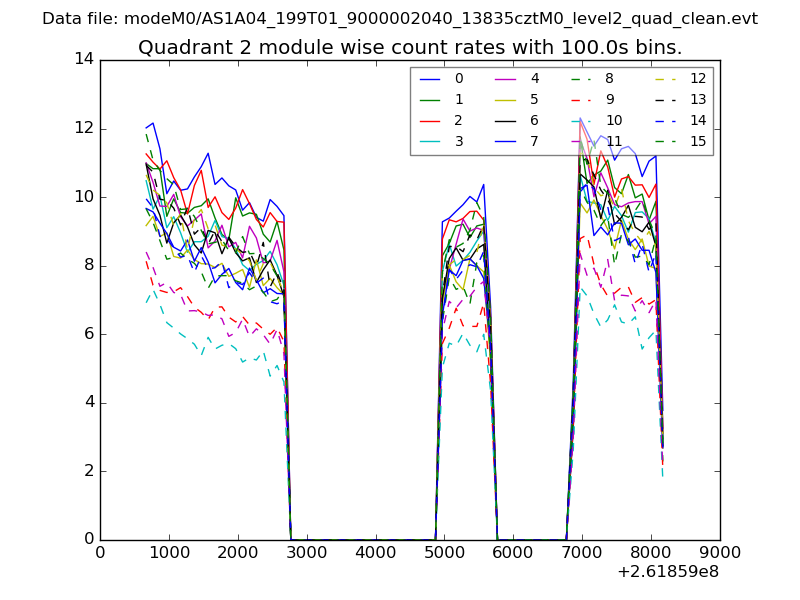
| Module-wise count rates for Quadrant B Data is divided into 100 sec bins |
 |
 |
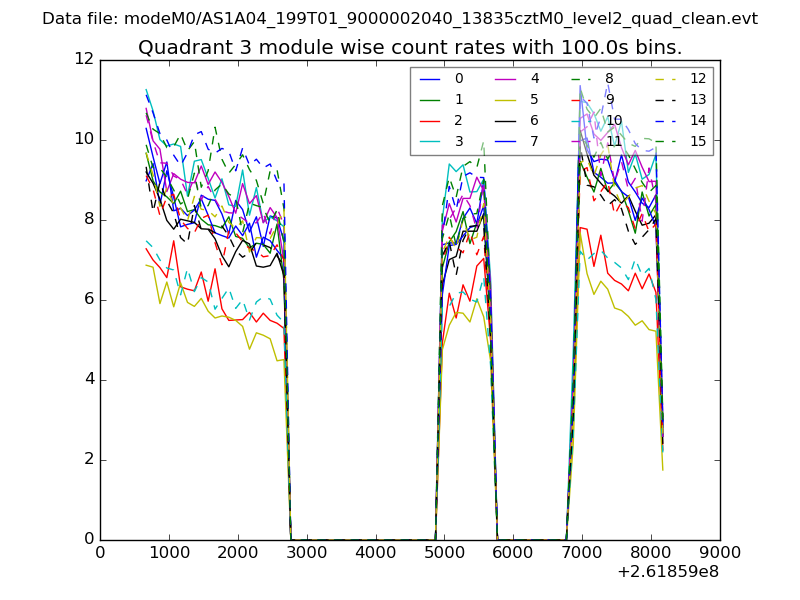
| Module-wise count rates for Quadrant C Data is divided into 100 sec bins |
 |
 |
| Module-wise count rates for Quadrant D Data is divided into 100 sec bins |
 |
 |
| Parameter | Plot |
|---|---|
| CZT HV Monitor | 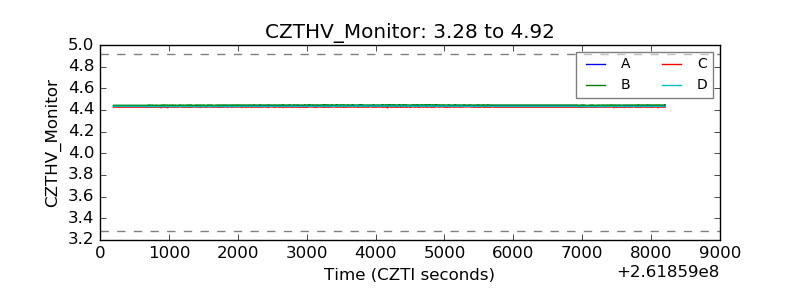 |
| D_VDD |  |
| Temperature 1 |  |
| Veto HV Monitor | 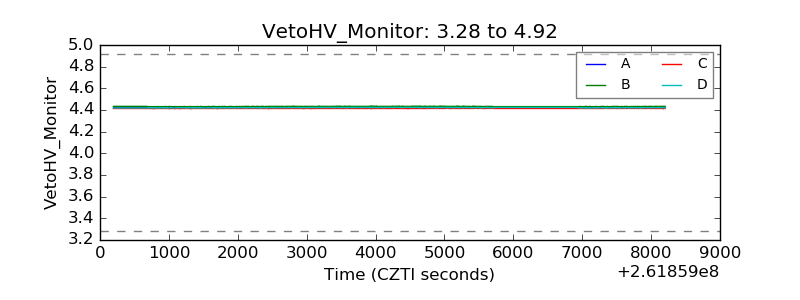 |
| Veto LLD | 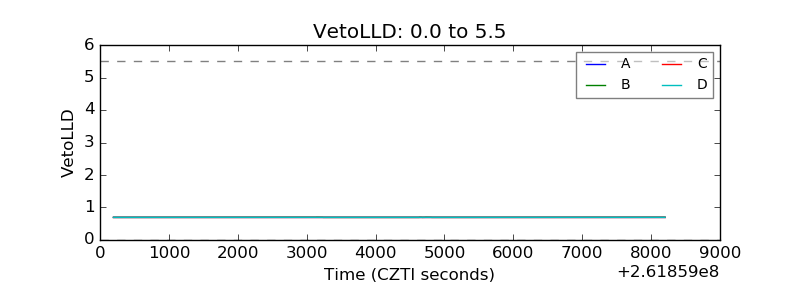 |
| Alpha Counter | 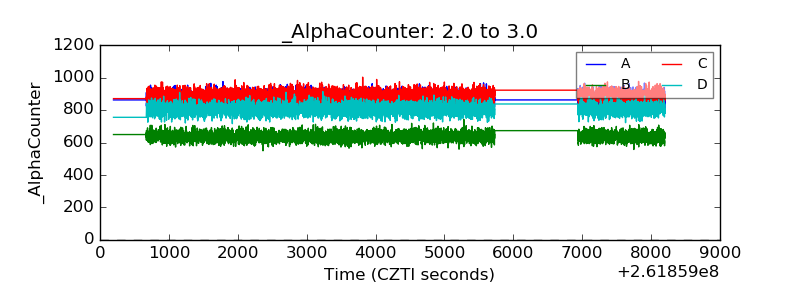 |
| _CPM_Rate | 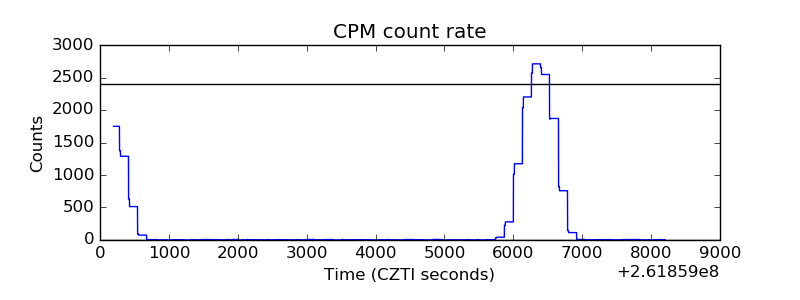 |
| CZT Counter | 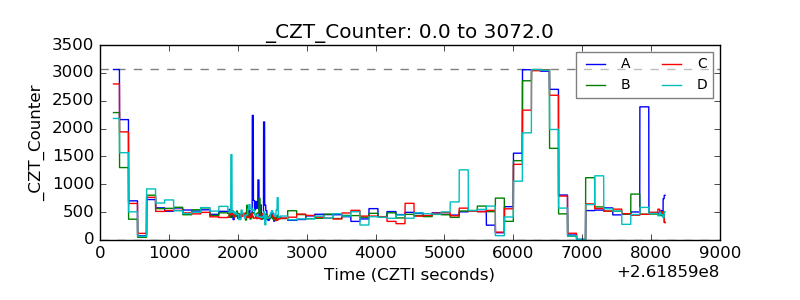 |
| +2.5 Volts monitor |  |
| +5 Volts monitor |  |
| _ROLL_ROT | 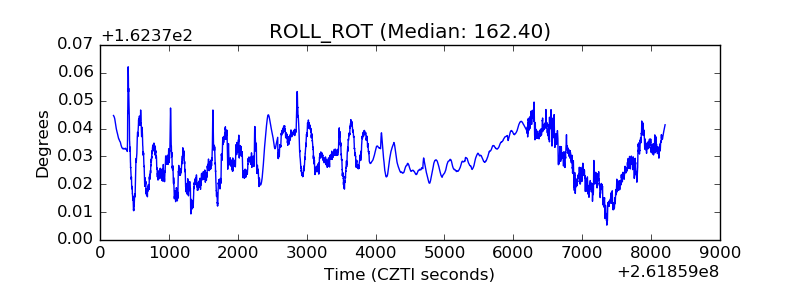 |
| _Roll_DEC | 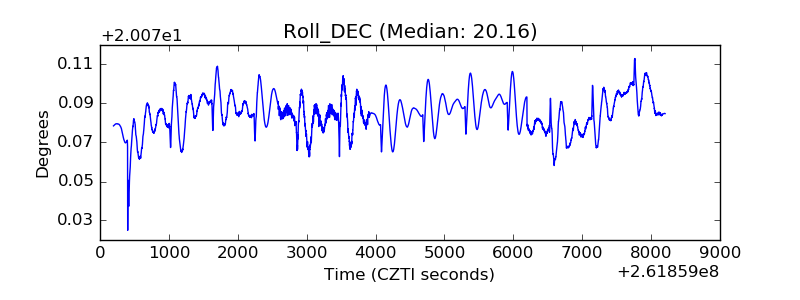 |
| _Roll_RA | 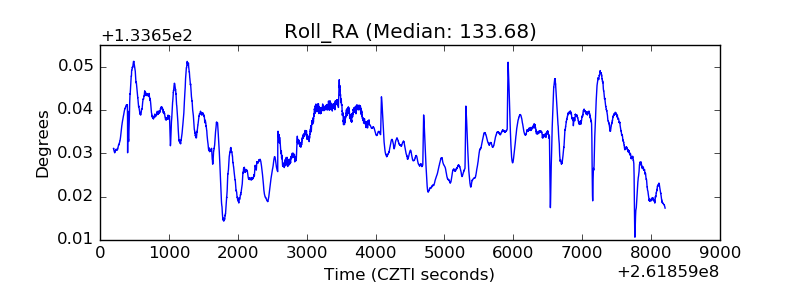 |
| Veto Counter | 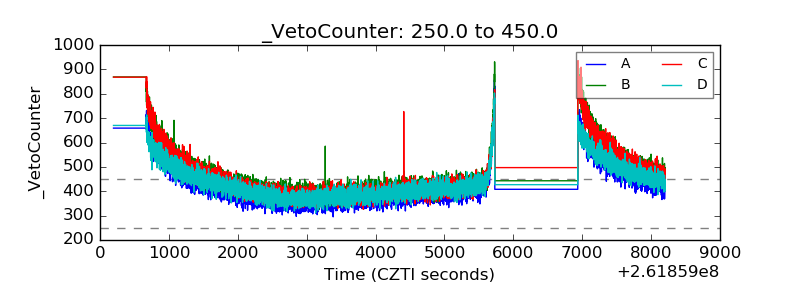 |