| Param | Original file | Final file |
|---|---|---|
| Filename | modeM0/AS1A04_199T01_9000002040_13836cztM0_level2.evt | modeM0/AS1A04_199T01_9000002040_13836cztM0_level2_quad_clean.evt |
| Size (bytes) | 453,075,840 | 89,418,240 |
| Size | 432.1 MB | 85.3 MB |
| Events in quadrant A | 3,182,345 | 574,061 |
| Events in quadrant B | 3,173,640 | 594,773 |
| Events in quadrant C | 3,051,753 | 574,481 |
| Events in quadrant D | 3,894,929 | 534,158 |
| Mode M9 | |||
|---|---|---|---|
| Quadrant | BADHDUFLAG | Total packets | Discarded packets |
| A | 0 | 25 | 0 |
| B | 0 | 25 | 0 |
| C | 0 | 25 | 0 |
| D | 0 | 25 | 0 |
| Mode SS | |||
|---|---|---|---|
| Quadrant | BADHDUFLAG | Total packets | Discarded packets |
| A | 0 | 128 | 0 |
| B | 0 | 128 | 0 |
| C | 0 | 128 | 0 |
| D | 0 | 128 | 0 |
| Mode M0 | |||
|---|---|---|---|
| Quadrant | BADHDUFLAG | Total packets | Discarded packets |
| A | 0 | 13281 | 3 |
| B | 0 | 13245 | 2 |
| C | 0 | 12809 | 2 |
| D | 0 | 15812 | 2 |
| Quadrant | Total seconds | Saturated seconds | Saturation percentage |
|---|---|---|---|
| A | 6163 | 89 | 1.444102% |
| B | 6163 | 67 | 1.087133% |
| C | 6163 | 22 | 0.356969% |
| D | 6163 | 68 | 1.103359% |
Noise dominated data is calculated using 1-second bins in cleaned event files. If a bin has >2000 counts, and if more than 50% of those come from <1% of pixels, then it is considered to be noise-dominated and hence unusable.
| Quadrant | # 1 sec bins | Bins with >0 counts | Bins with >2000 counts | High rate bins dominated by noise | Noise dominated (total time) | Noise dominated (detector-on time) | Marked lightcurve |
|---|---|---|---|---|---|---|---|
| A | 8654 | 6166 | 26 | 26 | 0.30% | 0.42% | 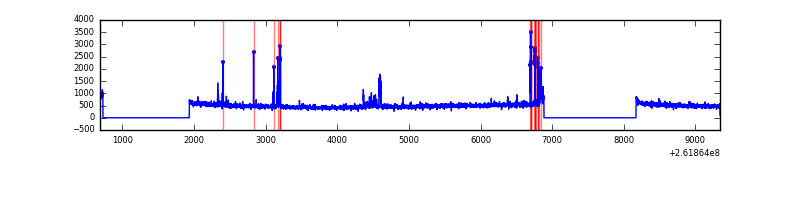 |
| B | 8654 | 6165 | 6 | 6 | 0.07% | 0.10% | 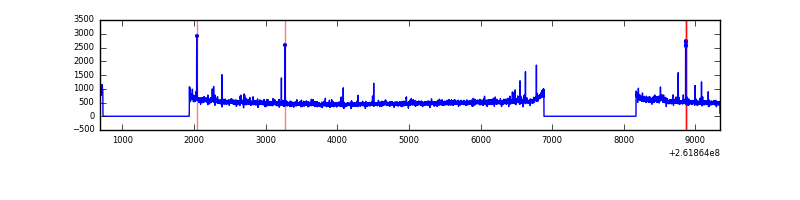 |
| C | 8654 | 6166 | 0 | 0 | 0.00% | 0.00% | 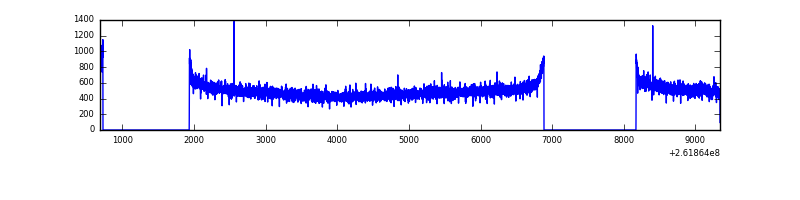 |
| D | 8654 | 6166 | 59 | 59 | 0.68% | 0.96% | 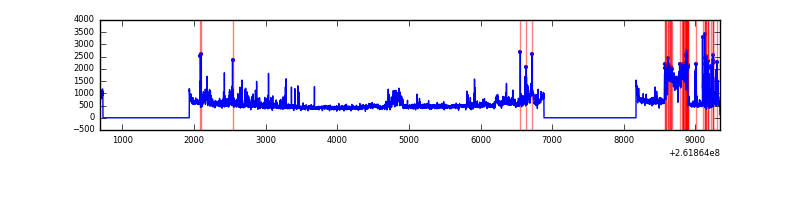 |
Top three noisy pixels from each quadrant. If the there are fewer than three noisy pixels in the level2.evt file, extra rows are filled as -1
| Pixel properties | Quadrant properties | ||||||
|---|---|---|---|---|---|---|---|
| Quadrant | DetID | PixID | Counts | Sigma | Mean | Median | Sigma |
| A | 9 | 143 | 103439 | 651.89 | 776 | 761 | 157.5 |
| A | 11 | 29 | 54614 | 341.91 | 776 | 761 | 157.5 |
| A | 15 | 69 | 17571 | 106.73 | 776 | 761 | 157.5 |
| B | 3 | 64 | 25848 | 169.82 | 786 | 768 | 147.7 |
| B | 0 | 219 | 23198 | 151.88 | 786 | 768 | 147.7 |
| B | 12 | 111 | 16796 | 108.53 | 786 | 768 | 147.7 |
| C | 3 | 233 | 88657 | 496.42 | 760 | 763 | 177.1 |
| C | 13 | 61 | 5451 | 26.48 | 760 | 763 | 177.1 |
| C | 4 | 175 | 2127 | 7.7 | 760 | 763 | 177.1 |
| D | 10 | 157 | 534197 | 2935.06 | 747 | 726 | 181.8 |
| D | 1 | 52 | 316623 | 1738.01 | 747 | 726 | 181.8 |
| D | 5 | 222 | 120201 | 657.33 | 747 | 726 | 181.8 |
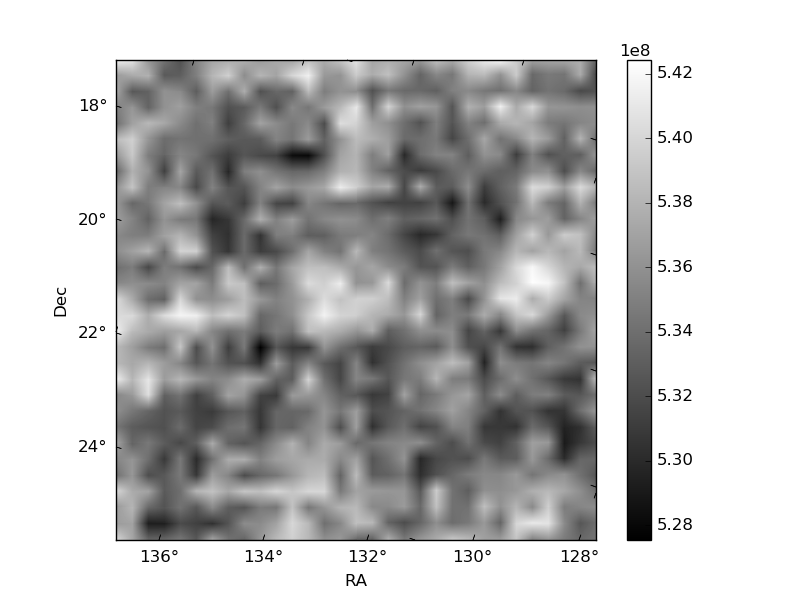
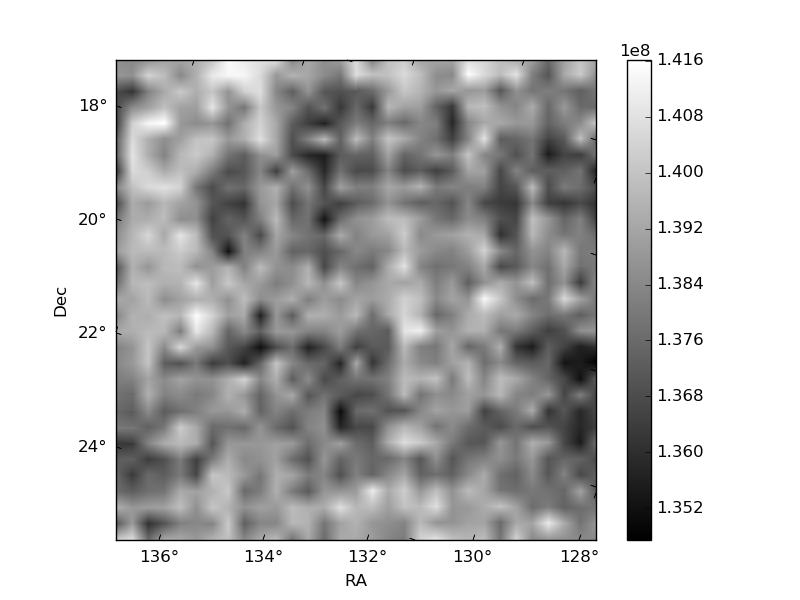
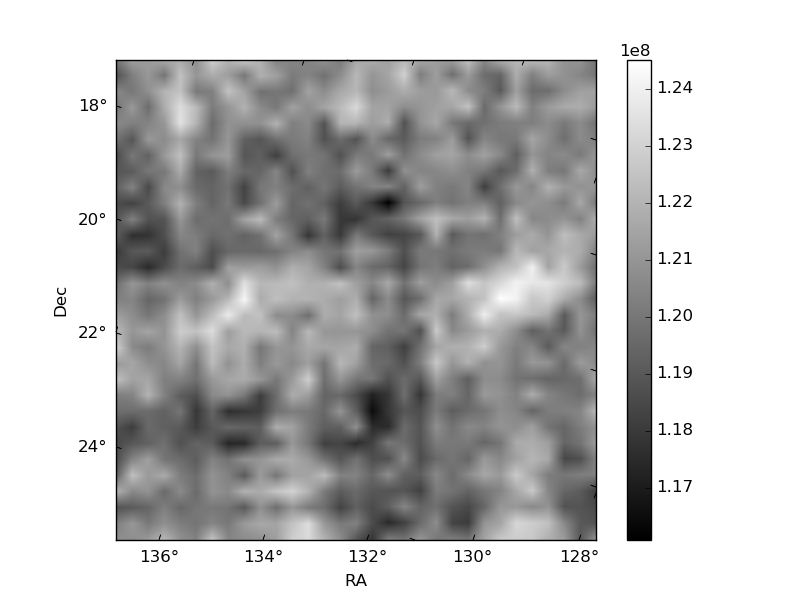
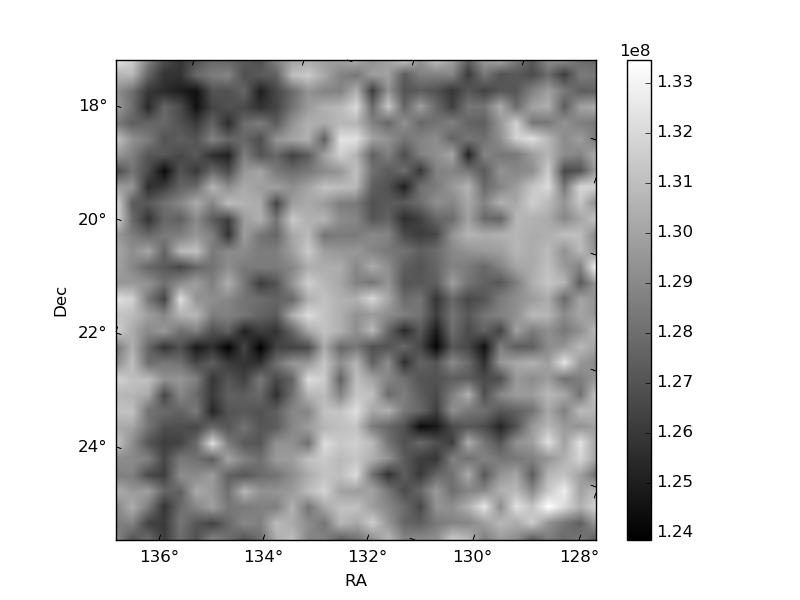
Histogram calculated using DETX and DETY for each event in the final _common_clean file
| Quadrant A | 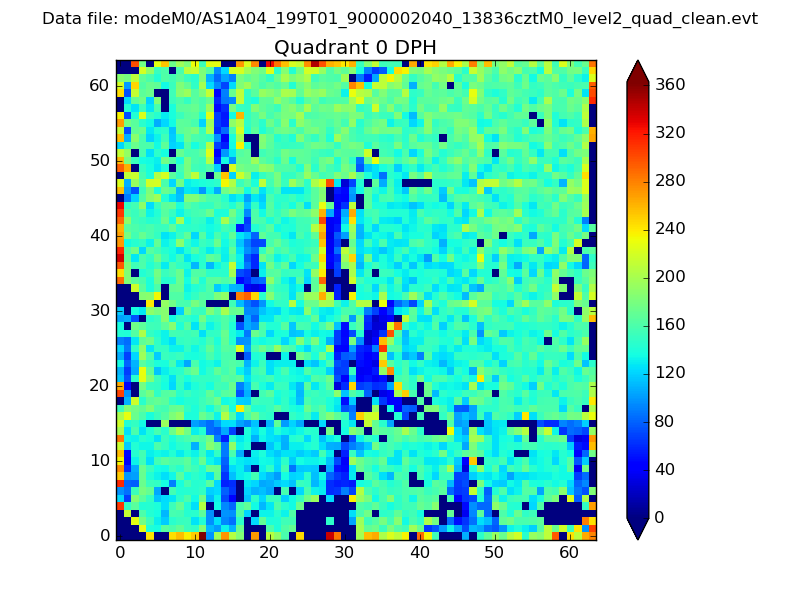 |
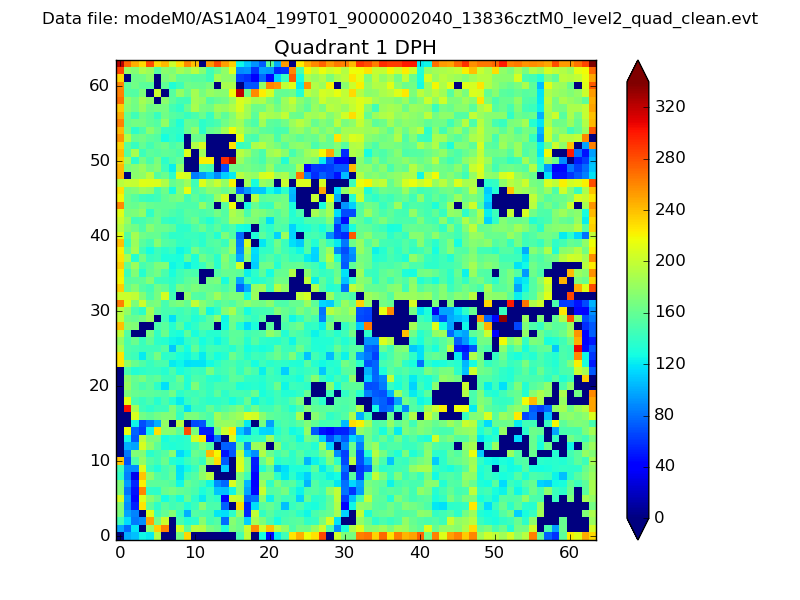 |
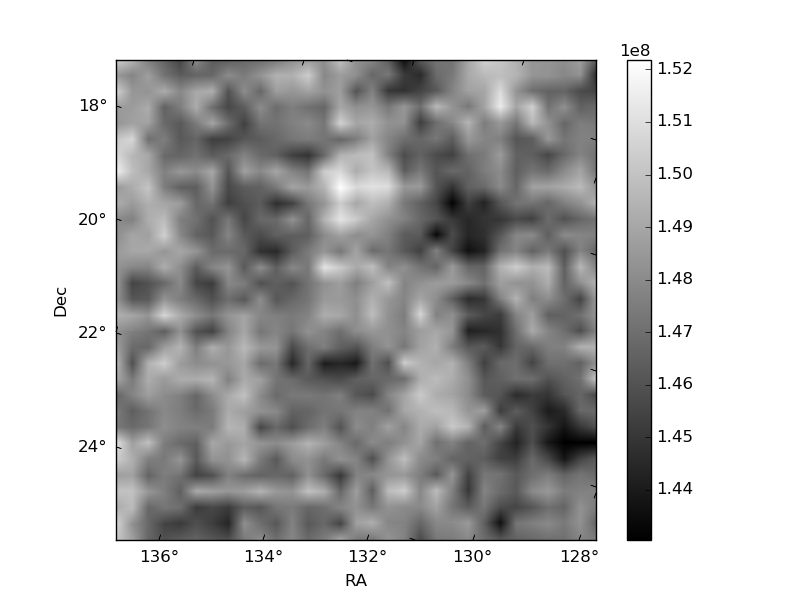
Quadrant B |
|---|---|---|---|
| Quadrant D | 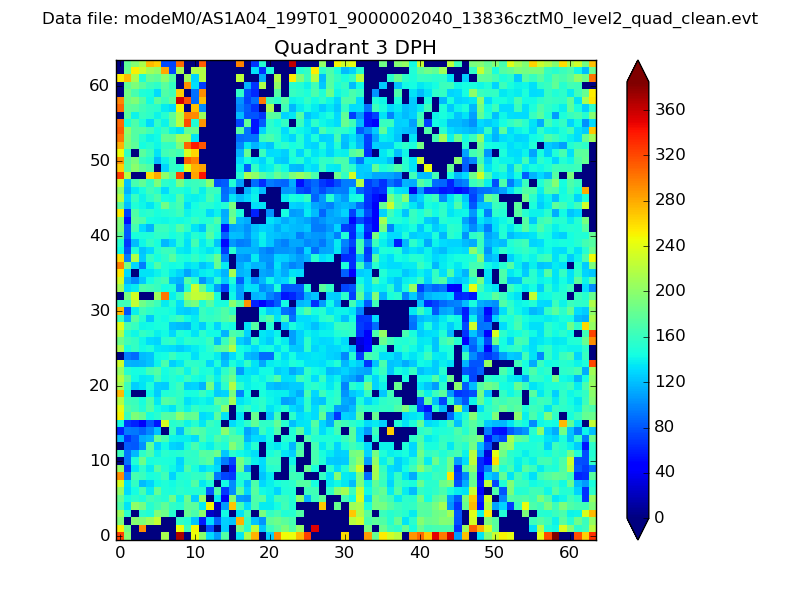 |
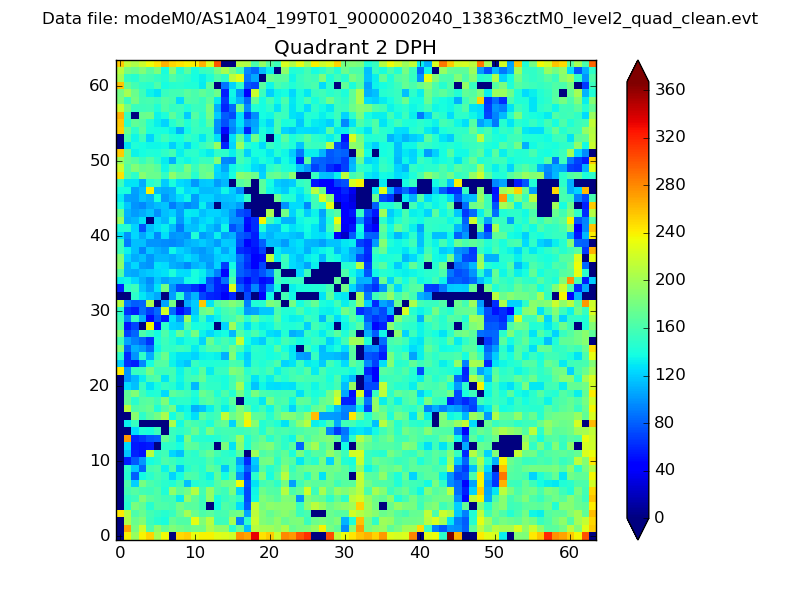 |
Quadrant C |
| Plot type | Count rate plots | Images |
|---|---|---|
| Comparison with Poisson distribution Blue bars denote a histogram of data divided into 1 sec bins. Red curve is a Poisson curve with rate = median count rate of data. |
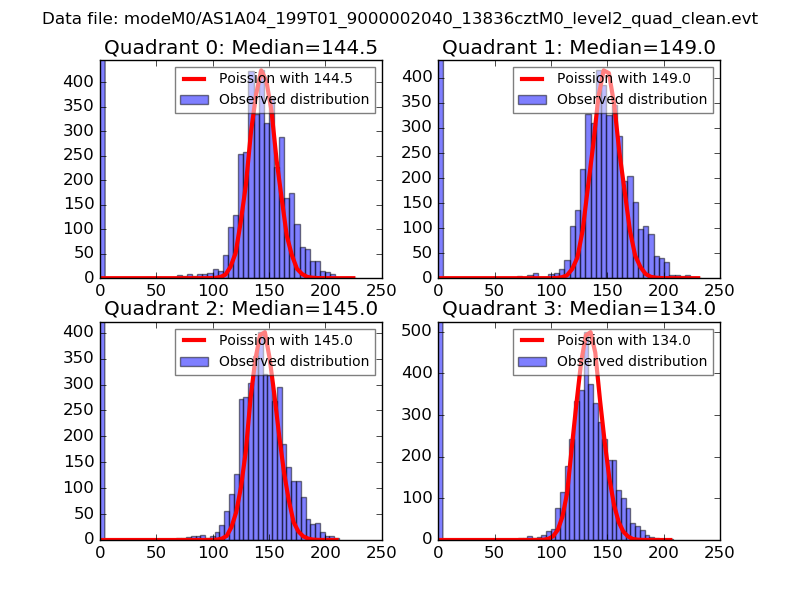 |
 |
| Quadrant-wise count rates Data is divided into 100 sec bins |
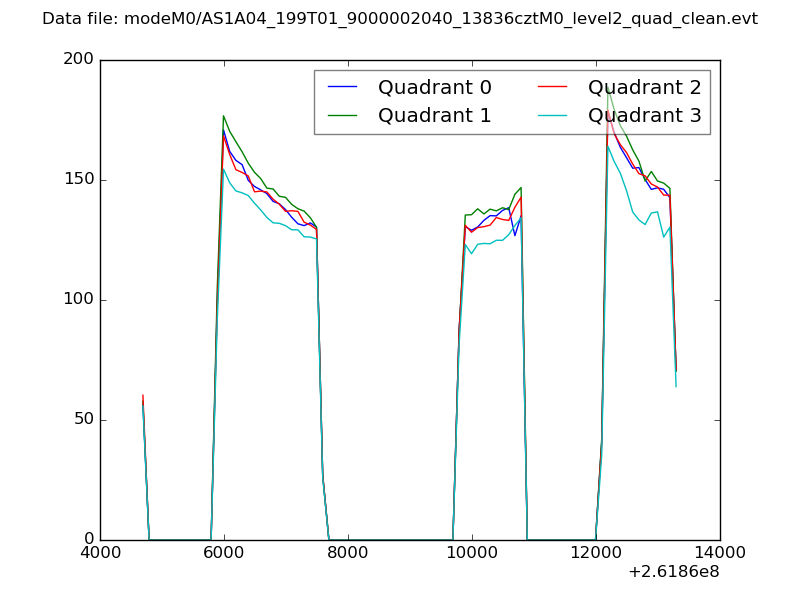 |
|
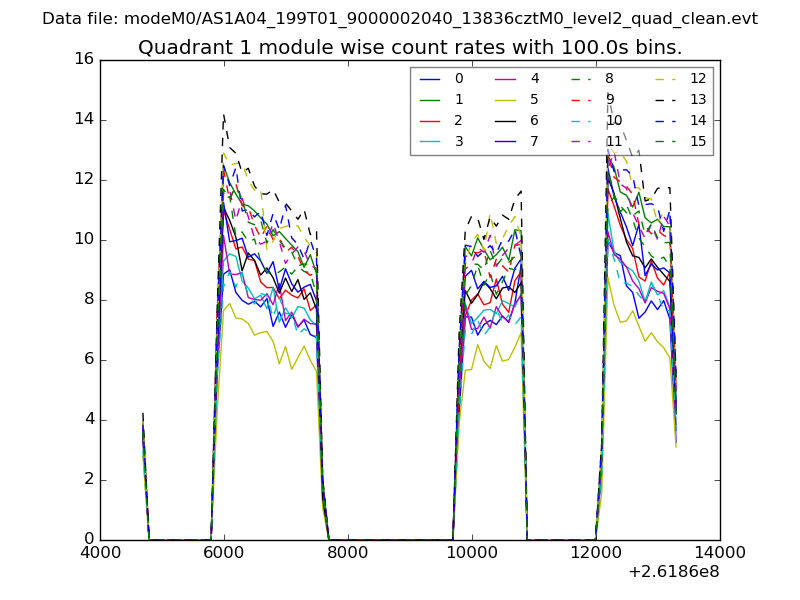
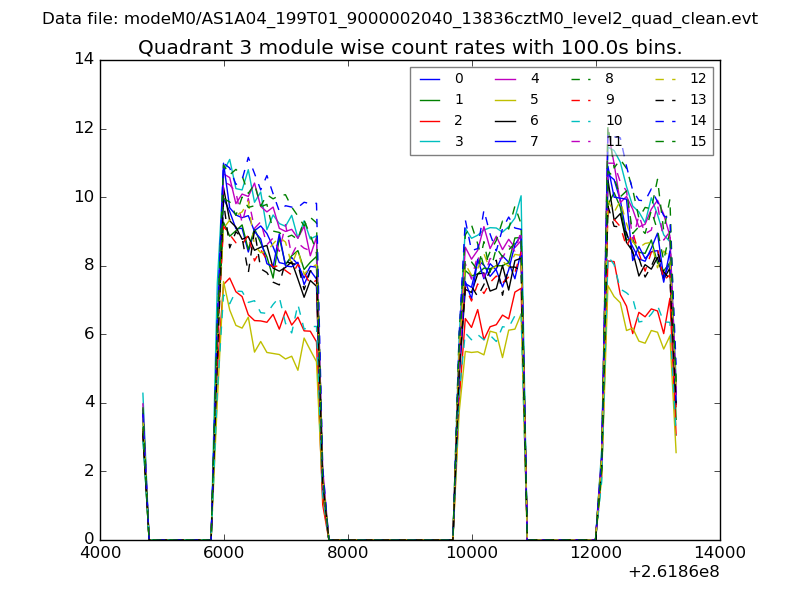
| Module-wise count rates for Quadrant A Data is divided into 100 sec bins |
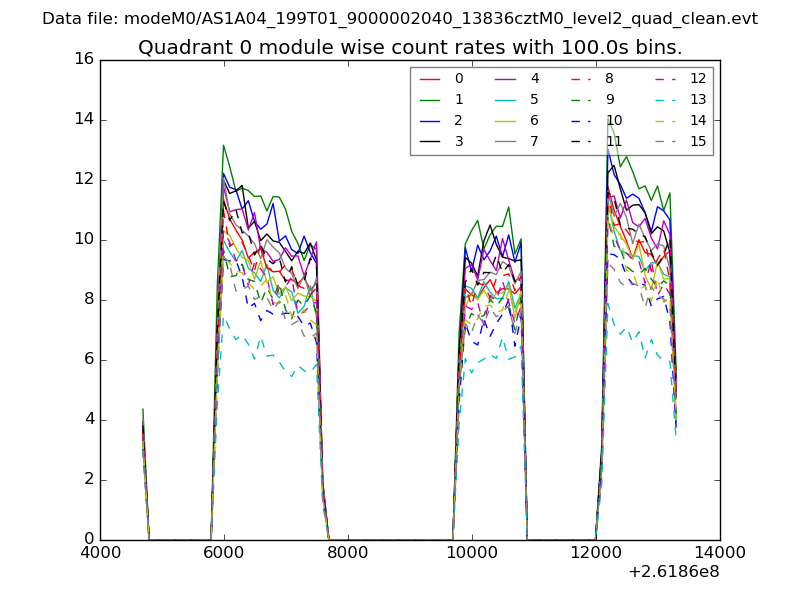 |
 |
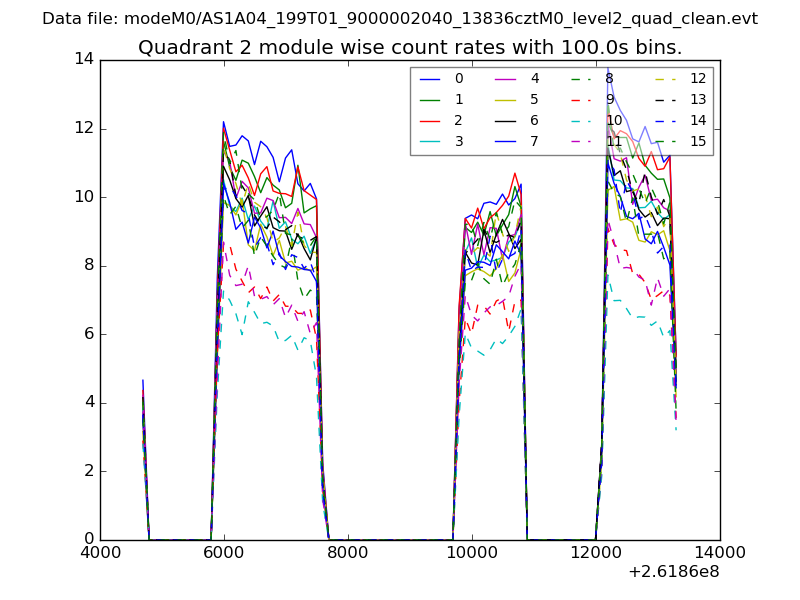
| Module-wise count rates for Quadrant B Data is divided into 100 sec bins |
 |
 |
| Module-wise count rates for Quadrant C Data is divided into 100 sec bins |
 |
 |
| Module-wise count rates for Quadrant D Data is divided into 100 sec bins |
 |
 |
| Parameter | Plot |
|---|---|
| CZT HV Monitor | 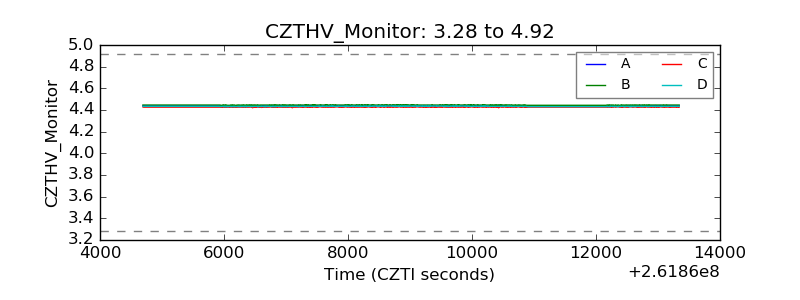 |
| D_VDD | 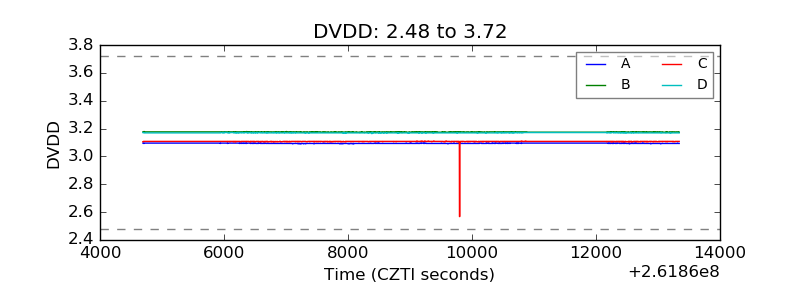 |
| Temperature 1 | 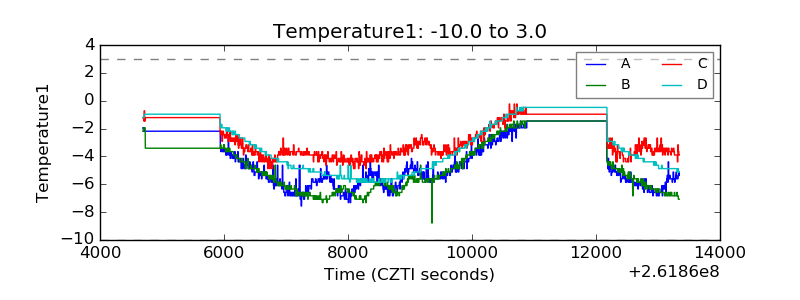 |
| Veto HV Monitor | 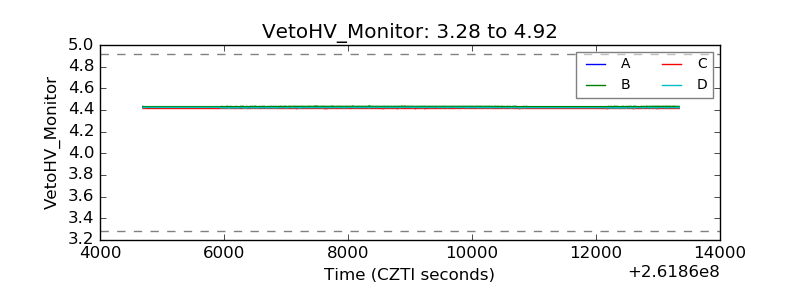 |
| Veto LLD | 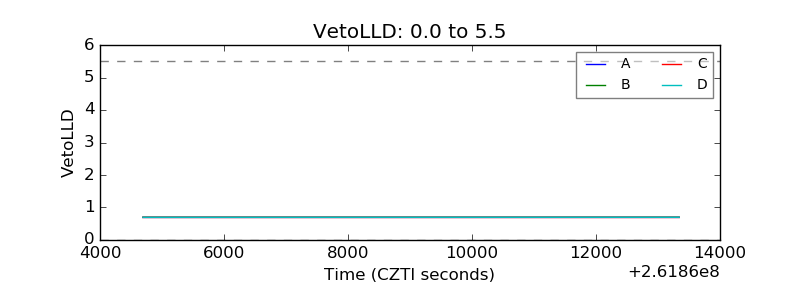 |
| Alpha Counter | 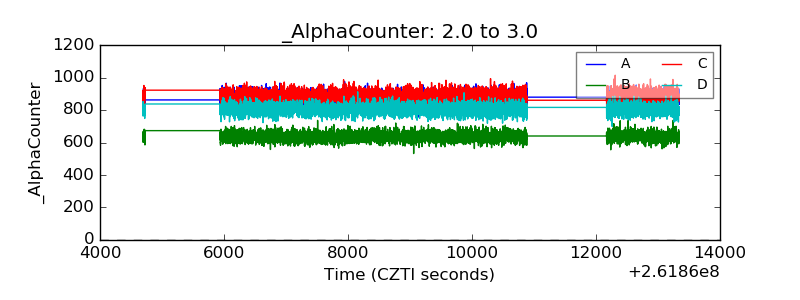 |
| _CPM_Rate |  |
| CZT Counter | 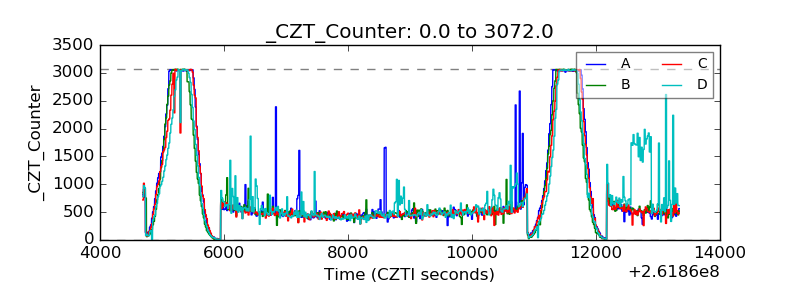 |
| +2.5 Volts monitor |  |
| +5 Volts monitor | 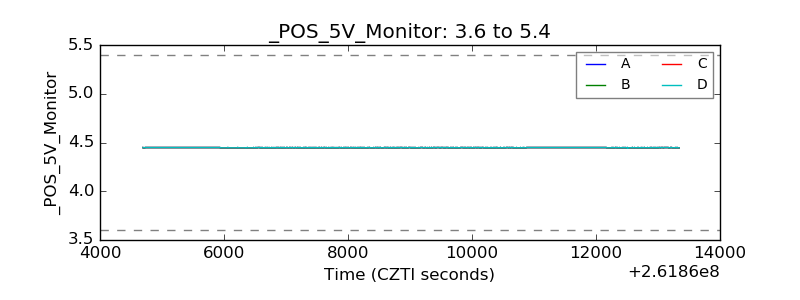 |
| _ROLL_ROT | 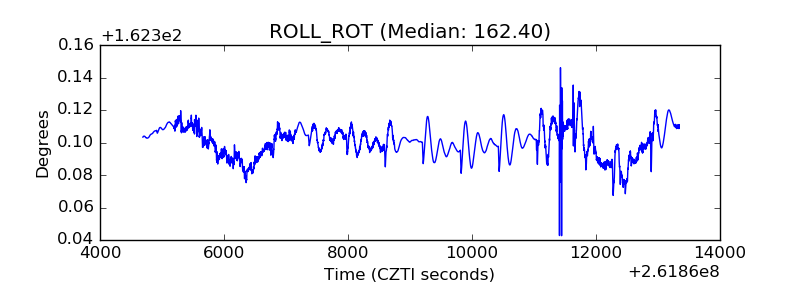 |
| _Roll_DEC | 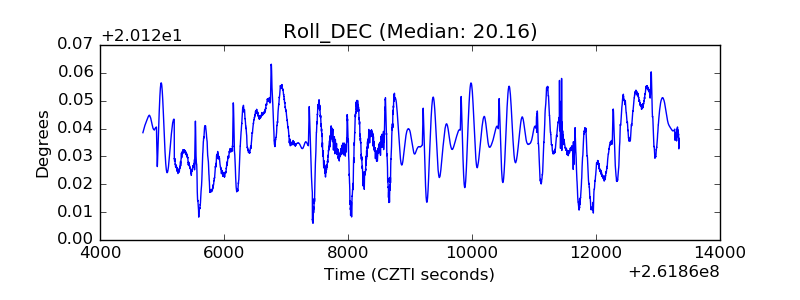 |
| _Roll_RA | 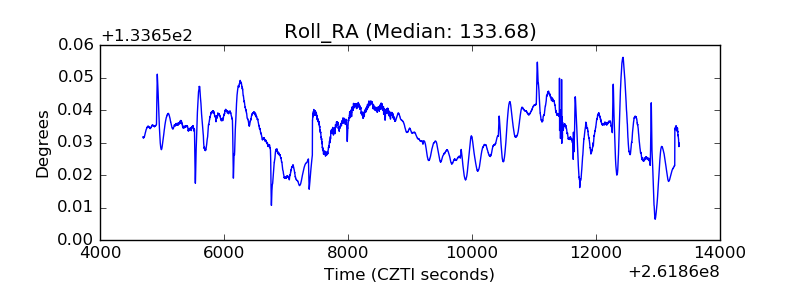 |
| Veto Counter | 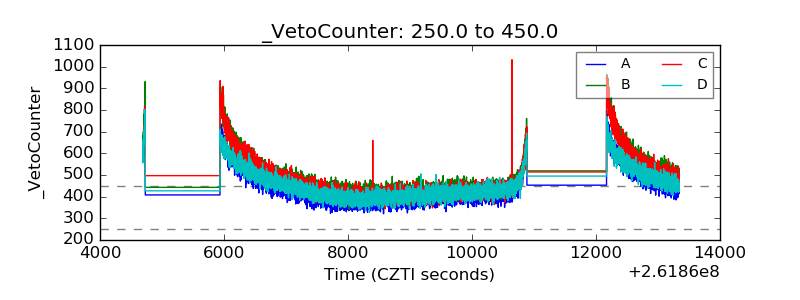 |