| Param | Original file | Final file |
|---|---|---|
| Filename | modeM0/AS1A04_199T01_9000002040_13839cztM0_level2.evt | modeM0/AS1A04_199T01_9000002040_13839cztM0_level2_quad_clean.evt |
| Size (bytes) | 466,516,800 | 67,821,120 |
| Size | 444.9 MB | 64.7 MB |
| Events in quadrant A | 3,287,919 | 403,620 |
| Events in quadrant B | 3,394,274 | 411,394 |
| Events in quadrant C | 3,195,021 | 398,029 |
| Events in quadrant D | 3,801,643 | 378,885 |
| Mode M9 | |||
|---|---|---|---|
| Quadrant | BADHDUFLAG | Total packets | Discarded packets |
| A | 0 | 23 | 0 |
| B | 0 | 23 | 0 |
| C | 0 | 23 | 0 |
| D | 0 | 24 | 0 |
| Mode SS | |||
|---|---|---|---|
| Quadrant | BADHDUFLAG | Total packets | Discarded packets |
| A | 0 | 134 | 0 |
| B | 0 | 134 | 0 |
| C | 0 | 134 | 0 |
| D | 0 | 134 | 0 |
| Mode M0 | |||
|---|---|---|---|
| Quadrant | BADHDUFLAG | Total packets | Discarded packets |
| A | 0 | 13861 | 3 |
| B | 0 | 14070 | 2 |
| C | 0 | 13598 | 2 |
| D | 0 | 15563 | 2 |
| Quadrant | Total seconds | Saturated seconds | Saturation percentage |
|---|---|---|---|
| A | 6621 | 34 | 0.513518% |
| B | 6621 | 71 | 1.072346% |
| C | 6621 | 8 | 0.120828% |
| D | 6621 | 37 | 0.558828% |
Noise dominated data is calculated using 1-second bins in cleaned event files. If a bin has >2000 counts, and if more than 50% of those come from <1% of pixels, then it is considered to be noise-dominated and hence unusable.
| Quadrant | # 1 sec bins | Bins with >0 counts | Bins with >2000 counts | High rate bins dominated by noise | Noise dominated (total time) | Noise dominated (detector-on time) | Marked lightcurve |
|---|---|---|---|---|---|---|---|
| A | 7777 | 6623 | 8 | 8 | 0.10% | 0.12% | 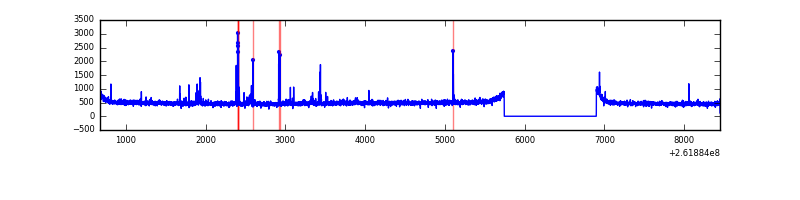 |
| B | 7777 | 6623 | 12 | 12 | 0.15% | 0.18% | 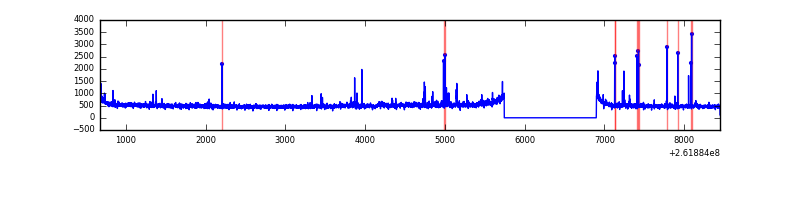 |
| C | 7777 | 6623 | 0 | 0 | 0.00% | 0.00% | 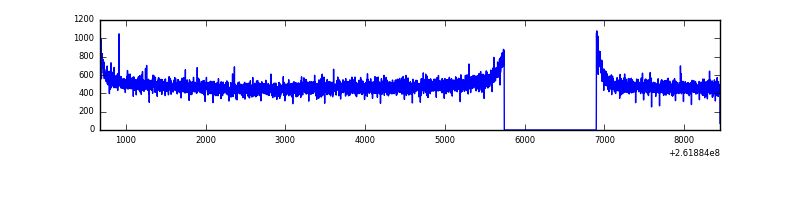 |
| D | 7777 | 6623 | 27 | 27 | 0.35% | 0.41% | 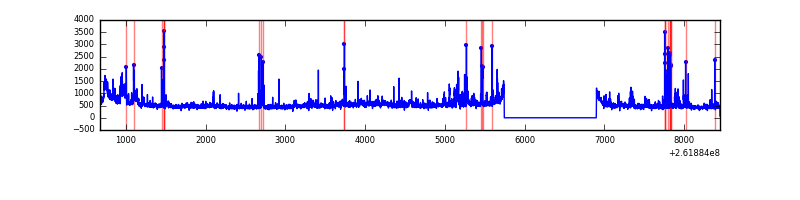 |
Top three noisy pixels from each quadrant. If the there are fewer than three noisy pixels in the level2.evt file, extra rows are filled as -1
| Pixel properties | Quadrant properties | ||||||
|---|---|---|---|---|---|---|---|
| Quadrant | DetID | PixID | Counts | Sigma | Mean | Median | Sigma |
| A | 9 | 143 | 92560 | 548.84 | 825 | 808 | 167.2 |
| A | 1 | 162 | 10190 | 56.12 | 825 | 808 | 167.2 |
| A | 15 | 69 | 7939 | 42.66 | 825 | 808 | 167.2 |
| B | 0 | 219 | 43490 | 270.82 | 829 | 812 | 157.6 |
| B | 4 | 80 | 36320 | 225.32 | 829 | 812 | 157.6 |
| B | 3 | 209 | 28394 | 175.02 | 829 | 812 | 157.6 |
| C | 3 | 233 | 82558 | 440.14 | 798 | 804 | 185.7 |
| C | 13 | 61 | 5862 | 27.23 | 798 | 804 | 185.7 |
| C | 3 | 202 | 1861 | 5.69 | 798 | 804 | 185.7 |
| D | 10 | 157 | 379520 | 1890.03 | 785 | 766 | 200.4 |
| D | 1 | 52 | 131209 | 650.93 | 785 | 766 | 200.4 |
| D | 5 | 222 | 117473 | 582.38 | 785 | 766 | 200.4 |
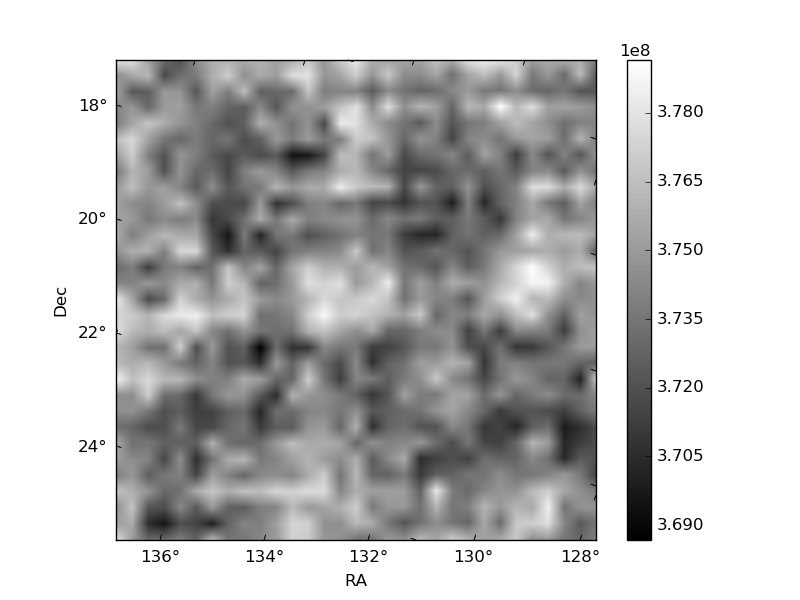
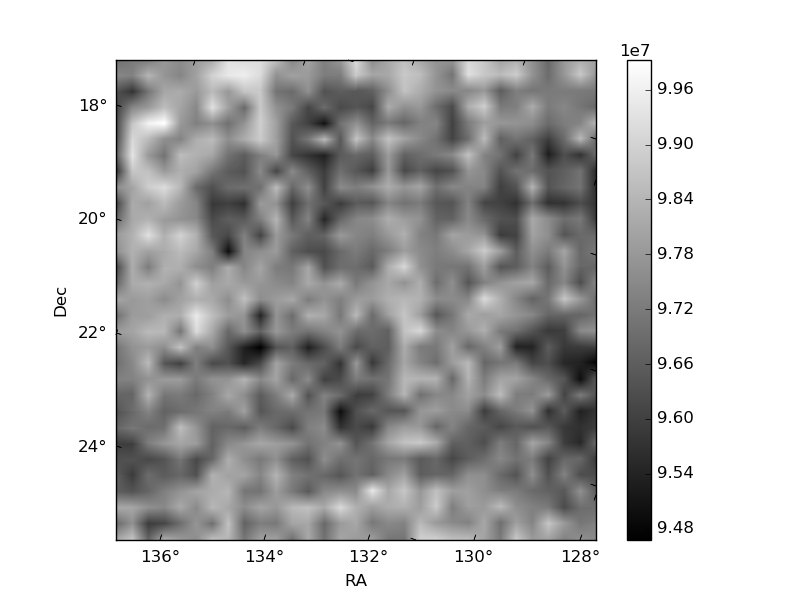
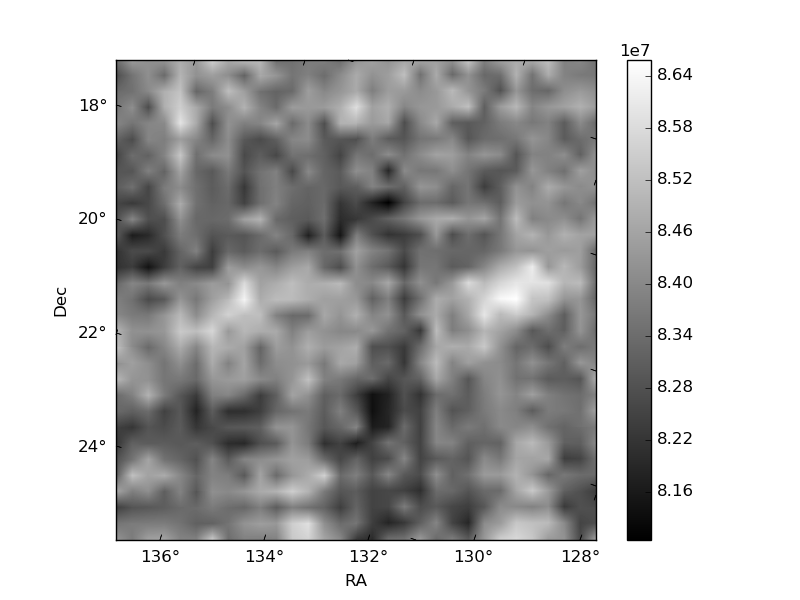
Histogram calculated using DETX and DETY for each event in the final _common_clean file
| Quadrant A | 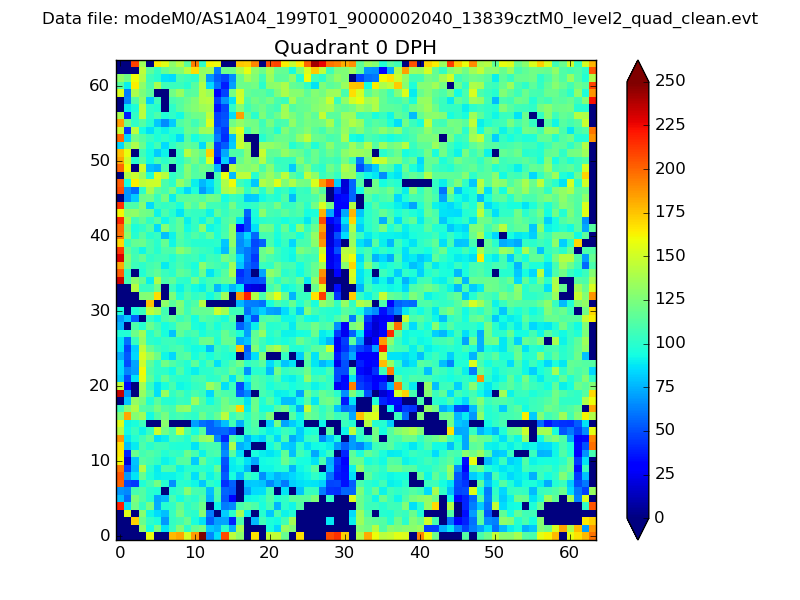 |
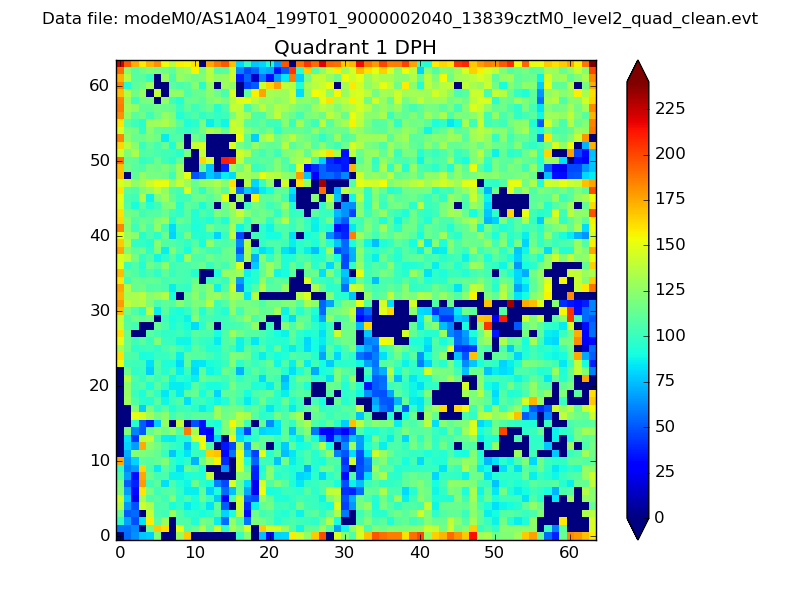 |
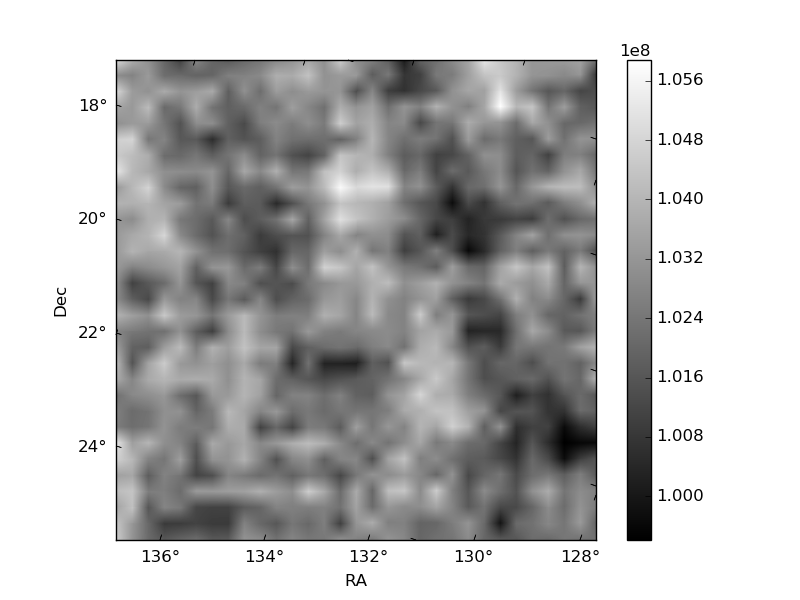
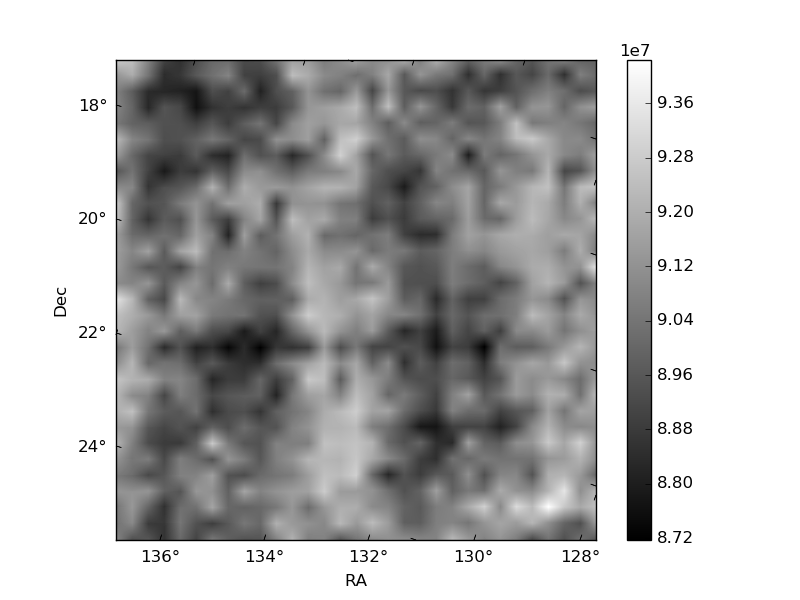
Quadrant B |
|---|---|---|---|
| Quadrant D | 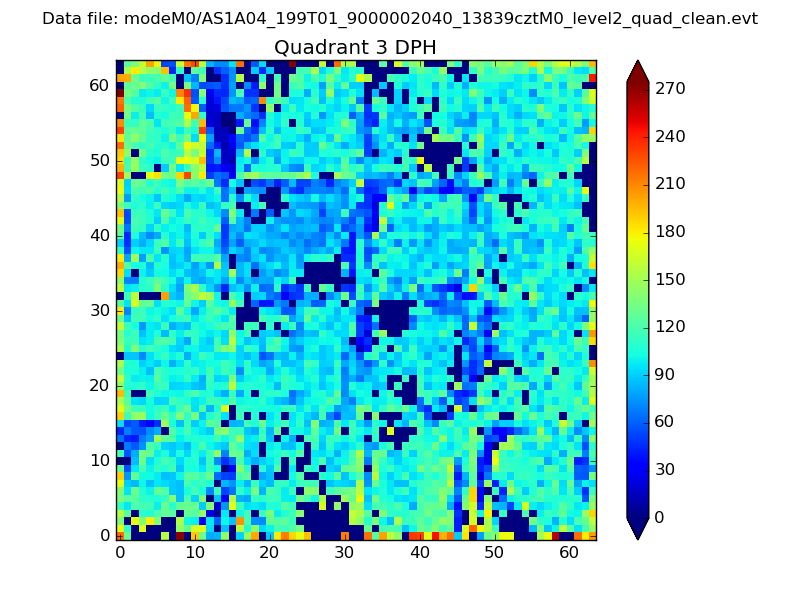 |
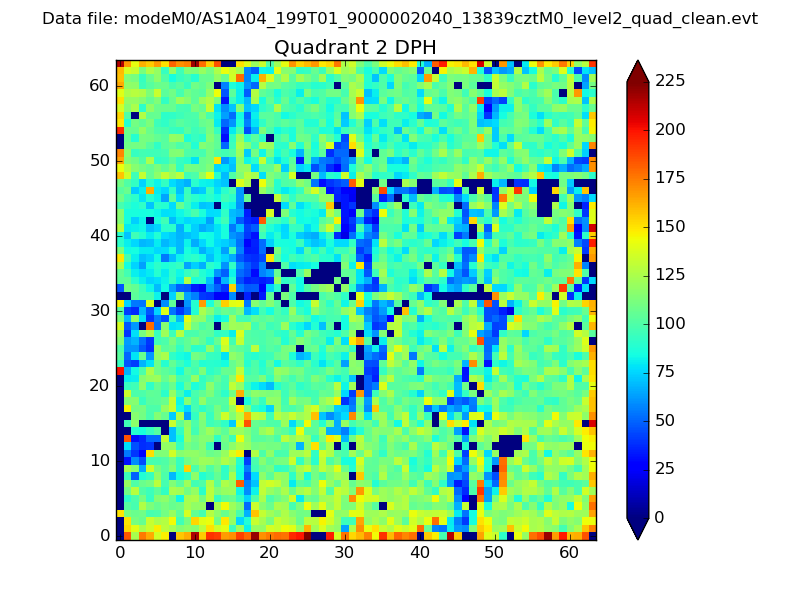 |
Quadrant C |
| Plot type | Count rate plots | Images |
|---|---|---|
| Comparison with Poisson distribution Blue bars denote a histogram of data divided into 1 sec bins. Red curve is a Poisson curve with rate = median count rate of data. |
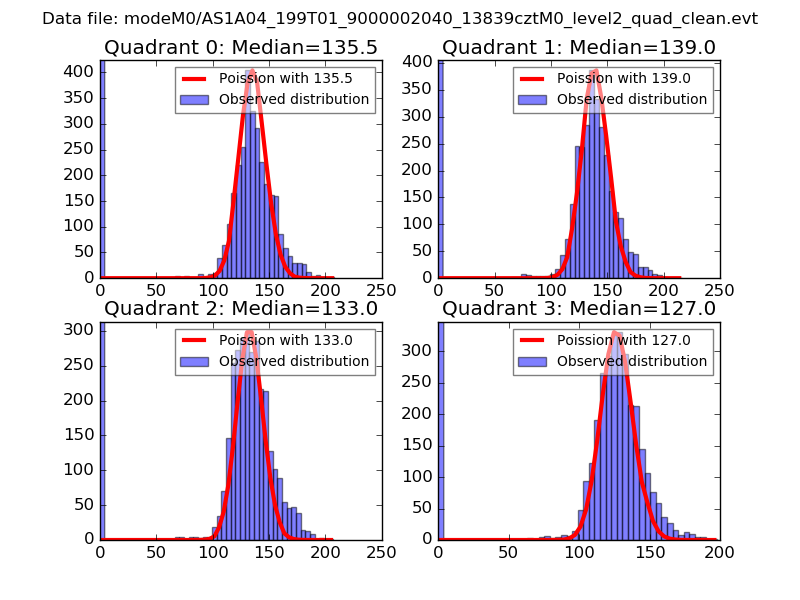 |
 |
| Quadrant-wise count rates Data is divided into 100 sec bins |
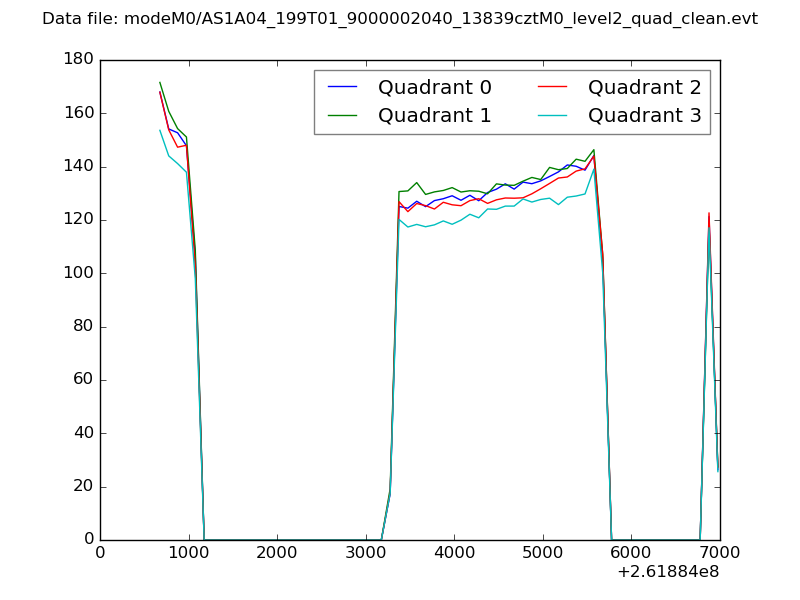 |
|
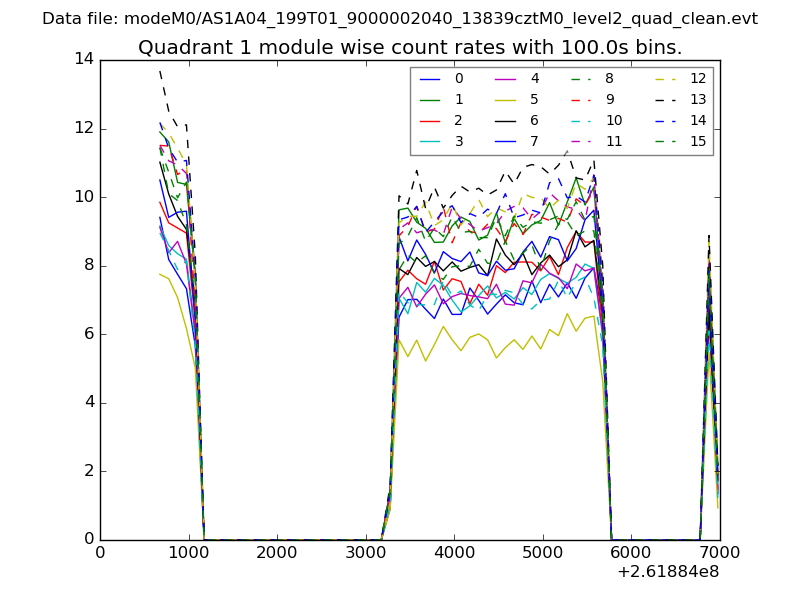
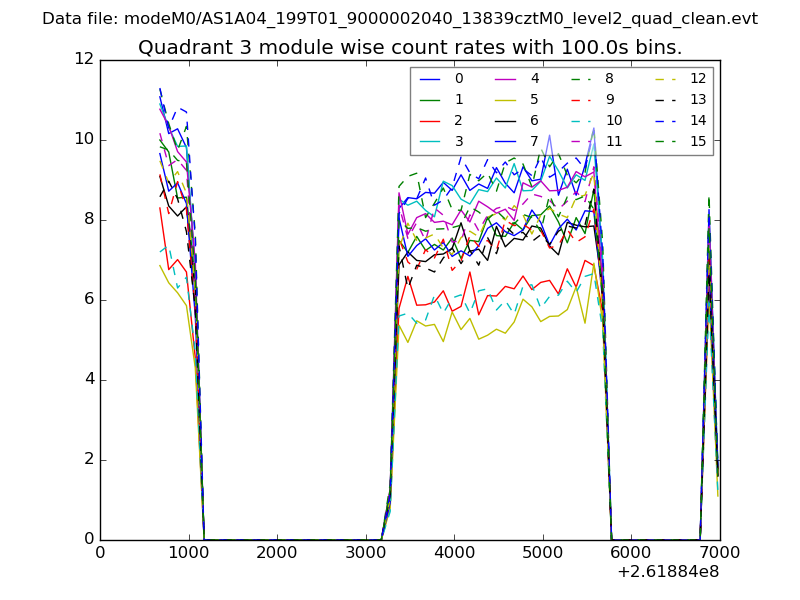
| Module-wise count rates for Quadrant A Data is divided into 100 sec bins |
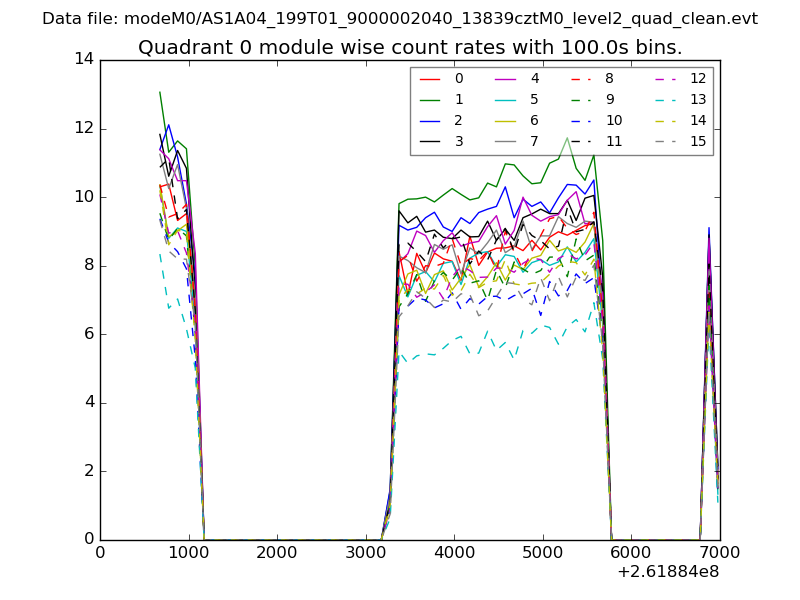 |
 |
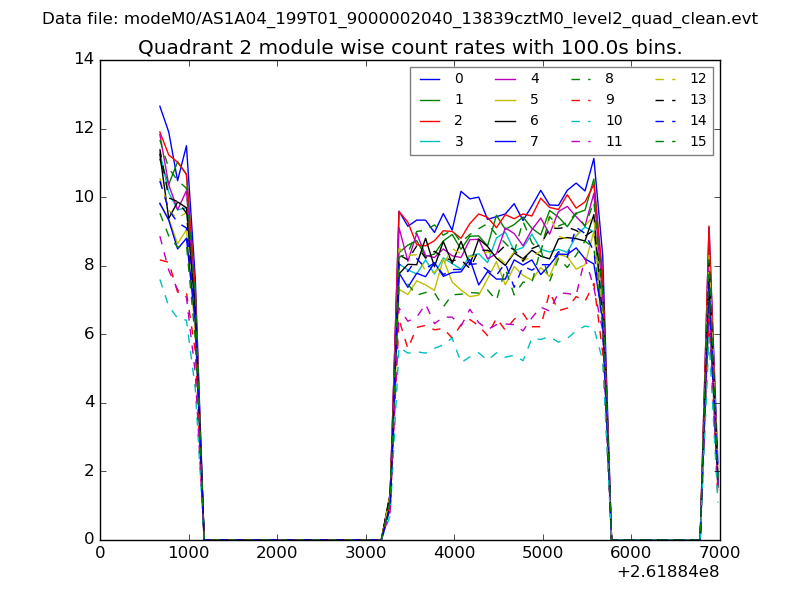
| Module-wise count rates for Quadrant B Data is divided into 100 sec bins |
 |
 |
| Module-wise count rates for Quadrant C Data is divided into 100 sec bins |
 |
 |
| Module-wise count rates for Quadrant D Data is divided into 100 sec bins |
 |
 |
| Parameter | Plot |
|---|---|
| CZT HV Monitor | 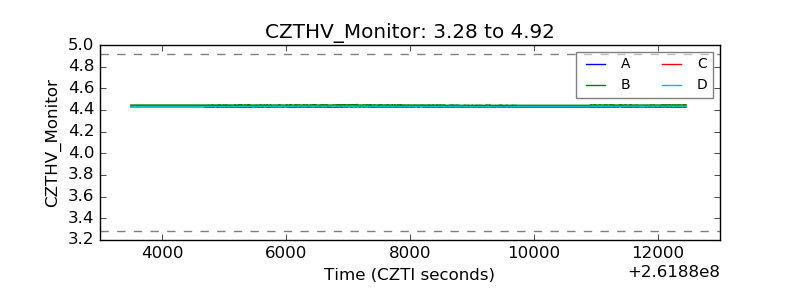 |
| D_VDD | 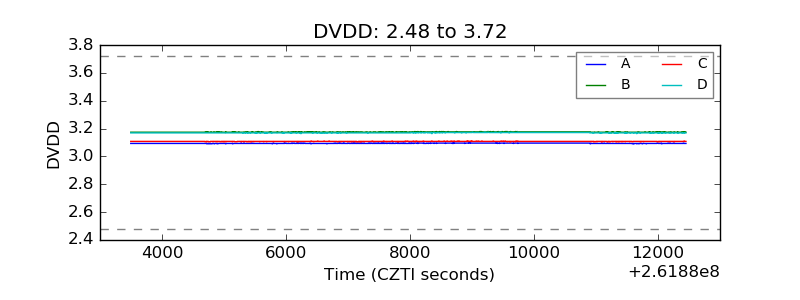 |
| Temperature 1 |  |
| Veto HV Monitor | 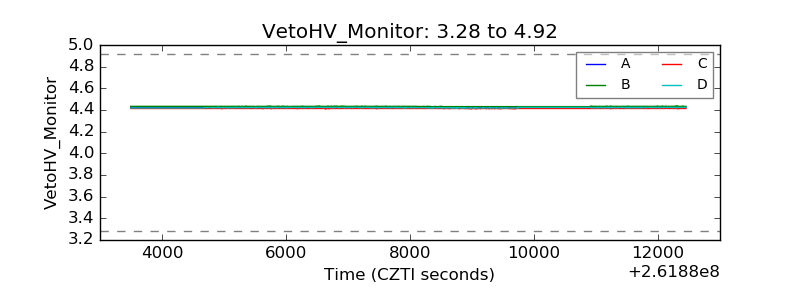 |
| Veto LLD | 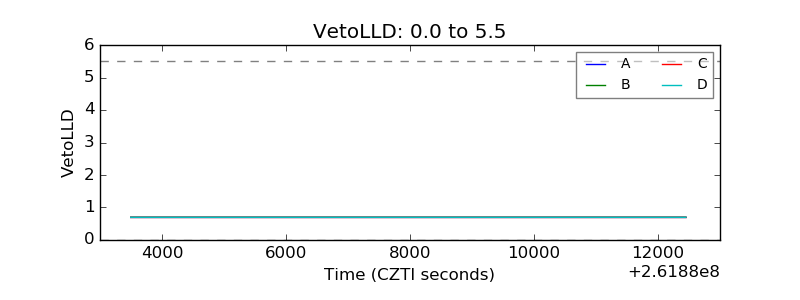 |
| Alpha Counter | 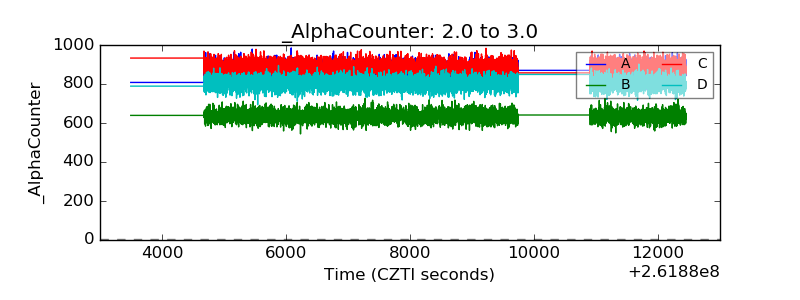 |
| _CPM_Rate | 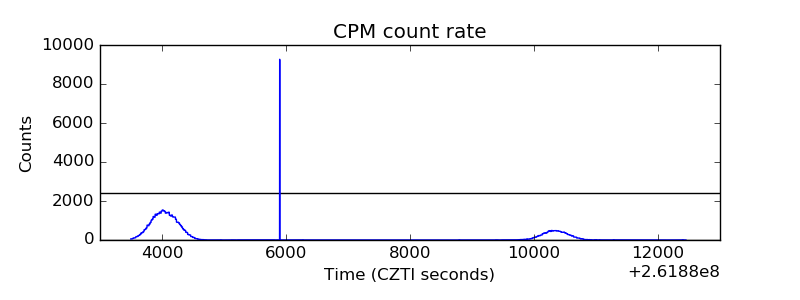 |
| CZT Counter | 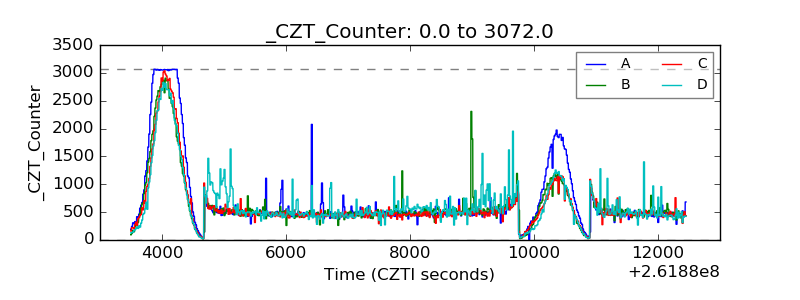 |
| +2.5 Volts monitor | 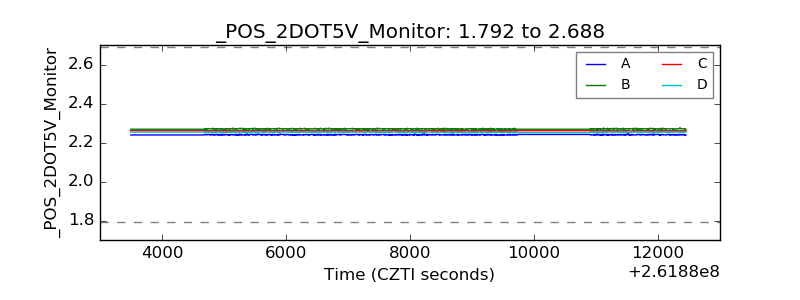 |
| +5 Volts monitor |  |
| _ROLL_ROT | 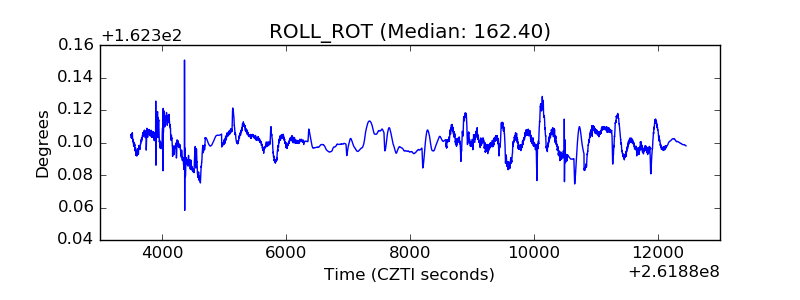 |
| _Roll_DEC | 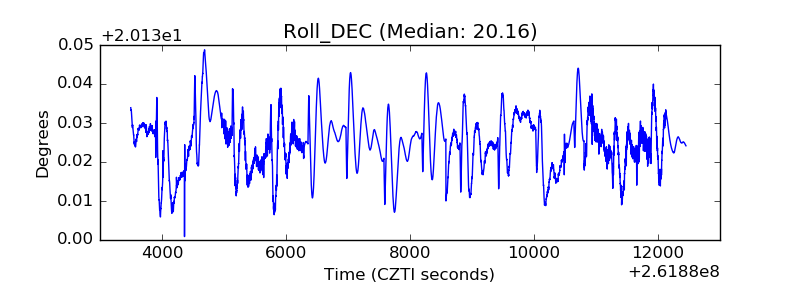 |
| _Roll_RA | 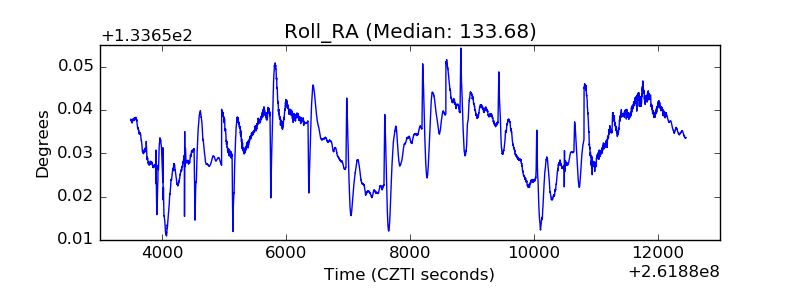 |
| Veto Counter | 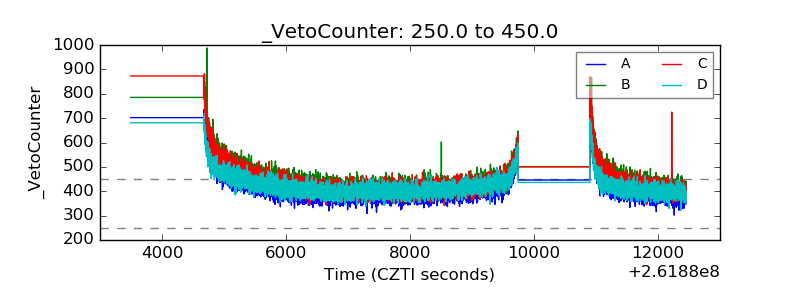 |