| Param | Original file | Final file |
|---|---|---|
| Filename | modeM0/AS1A04_199T01_9000002040_13842cztM0_level2.evt | modeM0/AS1A04_199T01_9000002040_13842cztM0_level2_quad_clean.evt |
| Size (bytes) | 664,401,600 | 89,760,960 |
| Size | 633.6 MB | 85.6 MB |
| Events in quadrant A | 4,219,833 | 539,337 |
| Events in quadrant B | 4,407,550 | 545,934 |
| Events in quadrant C | 4,265,583 | 536,538 |
| Events in quadrant D | 6,639,764 | 493,739 |
| Mode M9 | |||
|---|---|---|---|
| Quadrant | BADHDUFLAG | Total packets | Discarded packets |
| A | 0 | 2 | 0 |
| B | 0 | 2 | 0 |
| C | 0 | 2 | 0 |
| D | 0 | 2 | 0 |
| Mode SS | |||
|---|---|---|---|
| Quadrant | BADHDUFLAG | Total packets | Discarded packets |
| A | 0 | 174 | 0 |
| B | 0 | 174 | 0 |
| C | 0 | 174 | 0 |
| D | 0 | 174 | 0 |
| Mode M0 | |||
|---|---|---|---|
| Quadrant | BADHDUFLAG | Total packets | Discarded packets |
| A | 0 | 18260 | 2 |
| B | 0 | 18580 | 1 |
| C | 0 | 18361 | 1 |
| D | 0 | 25537 | 1 |
| Quadrant | Total seconds | Saturated seconds | Saturation percentage |
|---|---|---|---|
| A | 8681 | 524 | 6.036171% |
| B | 8681 | 559 | 6.439350% |
| C | 8681 | 371 | 4.273701% |
| D | 8681 | 823 | 9.480475% |
Noise dominated data is calculated using 1-second bins in cleaned event files. If a bin has >2000 counts, and if more than 50% of those come from <1% of pixels, then it is considered to be noise-dominated and hence unusable.
| Quadrant | # 1 sec bins | Bins with >0 counts | Bins with >2000 counts | High rate bins dominated by noise | Noise dominated (total time) | Noise dominated (detector-on time) | Marked lightcurve |
|---|---|---|---|---|---|---|---|
| A | 8877 | 8682 | 0 | 0 | 0.00% | 0.00% | 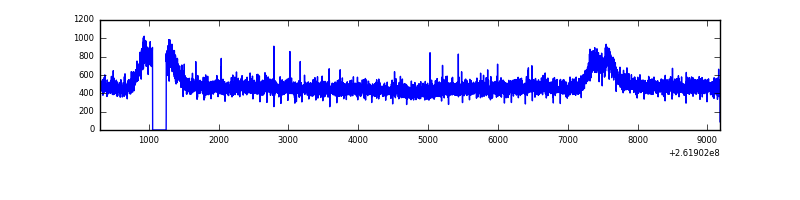 |
| B | 8877 | 8682 | 9 | 9 | 0.10% | 0.10% | 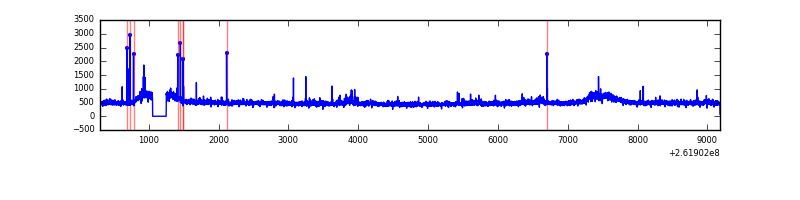 |
| C | 8877 | 8682 | 0 | 0 | 0.00% | 0.00% | 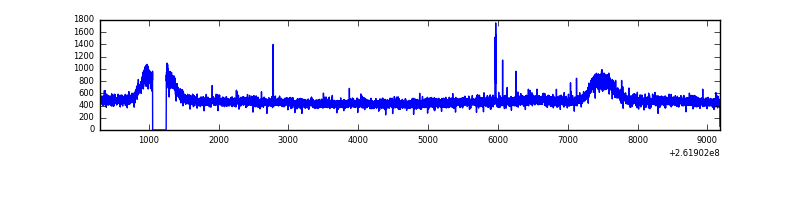 |
| D | 8877 | 8682 | 395 | 395 | 4.45% | 4.55% | 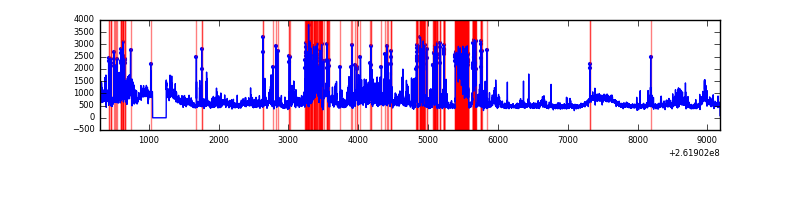 |
Top three noisy pixels from each quadrant. If the there are fewer than three noisy pixels in the level2.evt file, extra rows are filled as -1
| Pixel properties | Quadrant properties | ||||||
|---|---|---|---|---|---|---|---|
| Quadrant | DetID | PixID | Counts | Sigma | Mean | Median | Sigma |
| A | 8 | 15 | 16708 | 69.59 | 1090 | 1060 | 224.9 |
| A | 0 | 226 | 9706 | 38.45 | 1090 | 1060 | 224.9 |
| A | 12 | 194 | 8274 | 32.08 | 1090 | 1060 | 224.9 |
| B | 0 | 219 | 50369 | 230.71 | 1087 | 1055 | 213.7 |
| B | 4 | 80 | 48288 | 220.97 | 1087 | 1055 | 213.7 |
| B | 3 | 209 | 38941 | 177.24 | 1087 | 1055 | 213.7 |
| C | 3 | 233 | 73119 | 289.08 | 1071 | 1074 | 249.2 |
| C | 12 | 4 | 17332 | 65.24 | 1071 | 1074 | 249.2 |
| C | 13 | 61 | 7803 | 27.0 | 1071 | 1074 | 249.2 |
| D | 1 | 52 | 1666630 | 6508.64 | 1040 | 1010 | 255.9 |
| D | 13 | 122 | 420875 | 1640.68 | 1040 | 1010 | 255.9 |
| D | 10 | 157 | 282467 | 1099.83 | 1040 | 1010 | 255.9 |
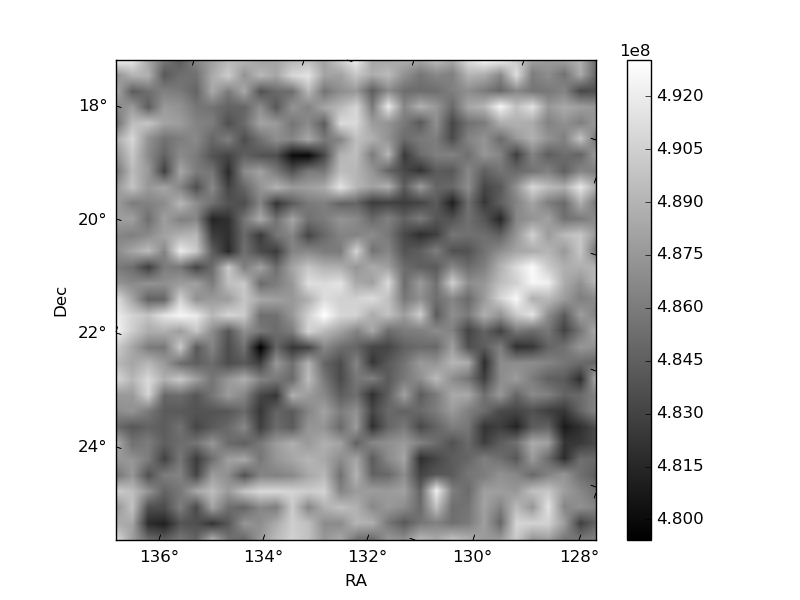
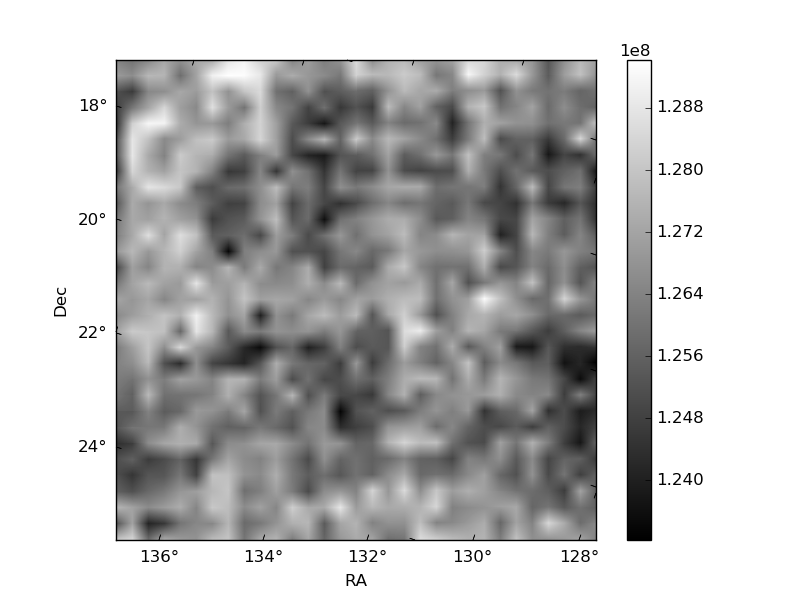
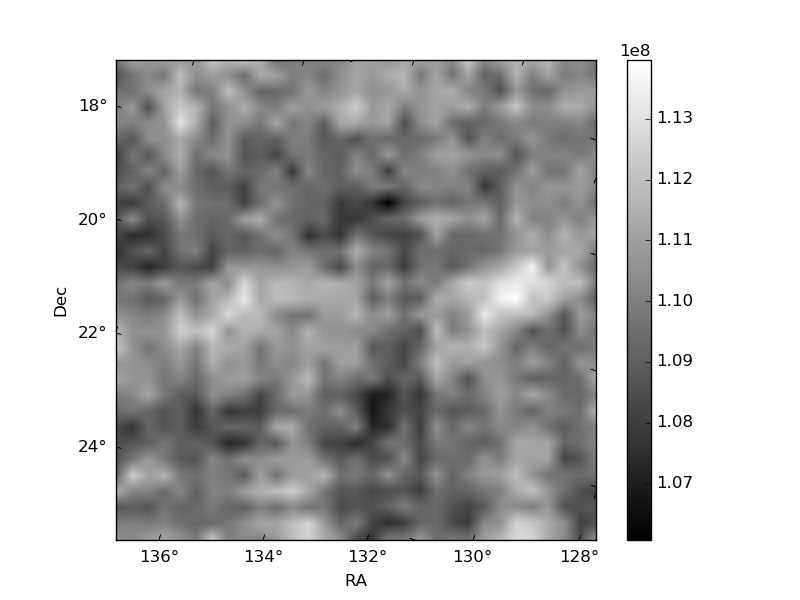
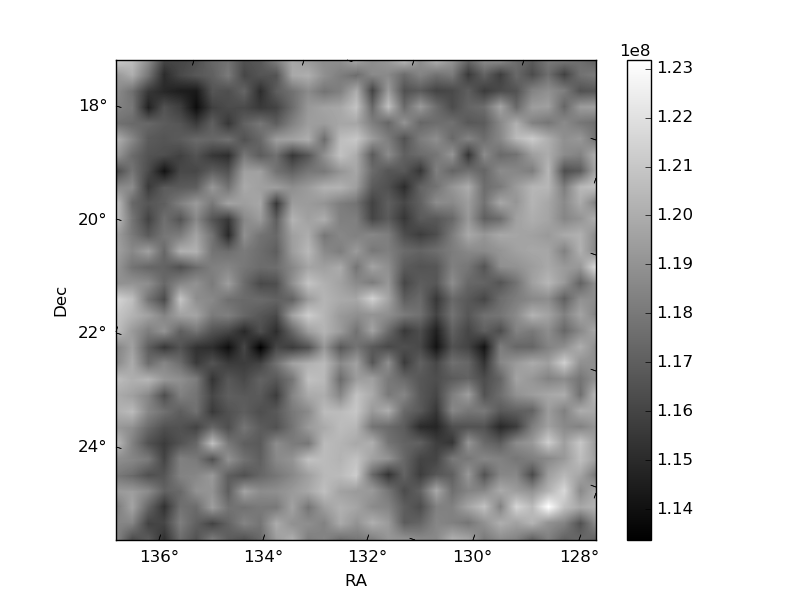
Histogram calculated using DETX and DETY for each event in the final _common_clean file
| Quadrant A | 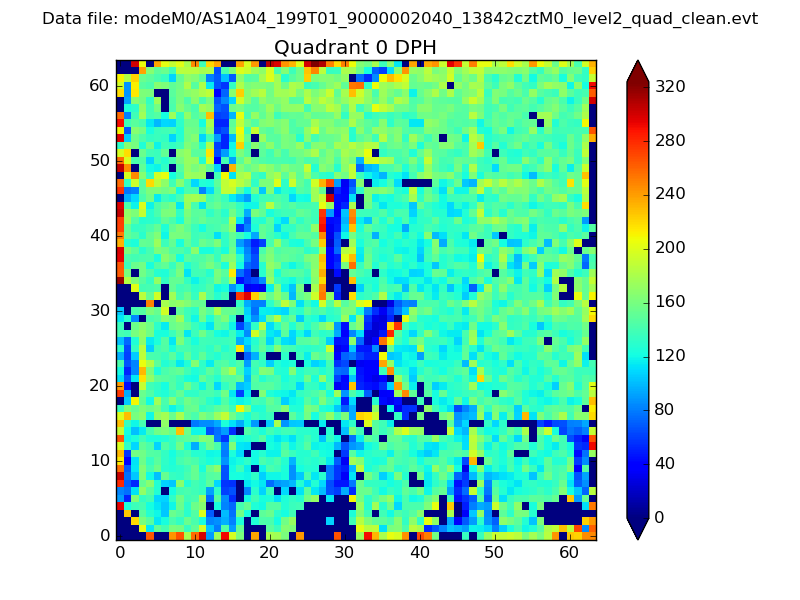 |
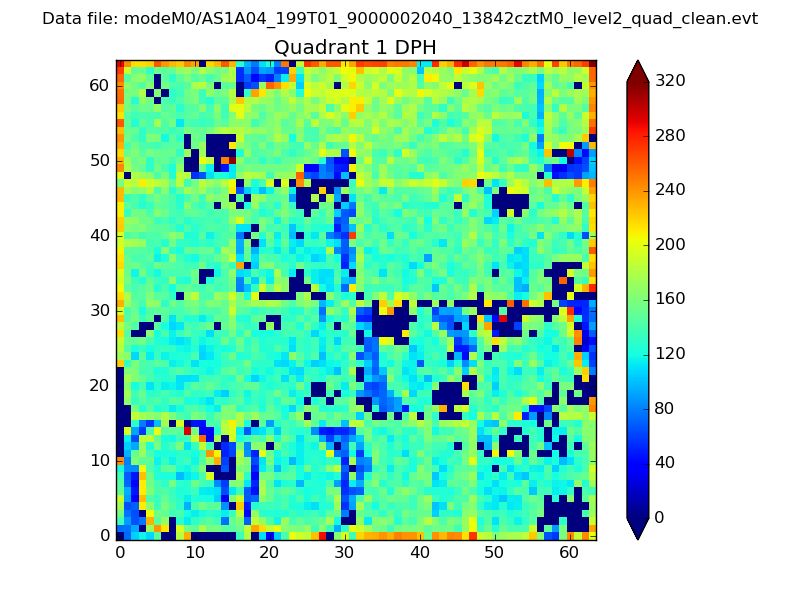 |
Quadrant B |
|---|---|---|---|
| Quadrant D | 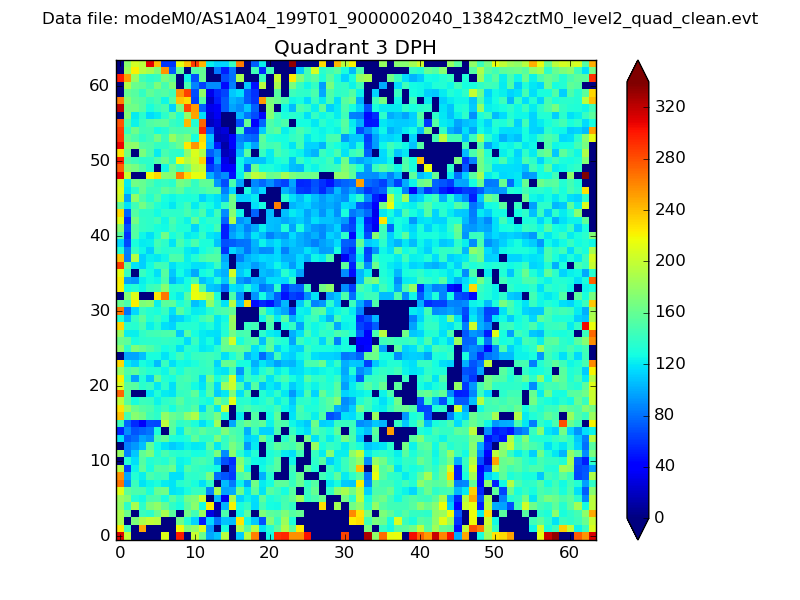 |
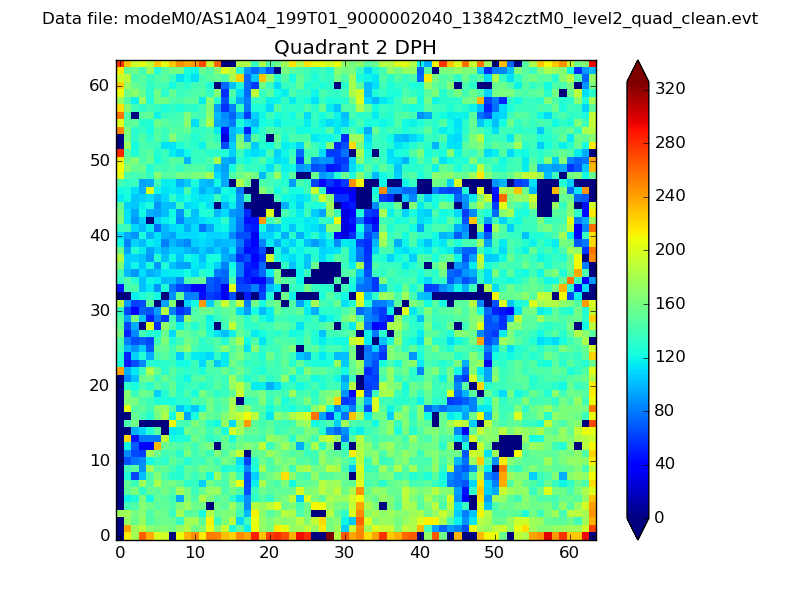 |
Quadrant C |
| Plot type | Count rate plots | Images |
|---|---|---|
| Comparison with Poisson distribution Blue bars denote a histogram of data divided into 1 sec bins. Red curve is a Poisson curve with rate = median count rate of data. |
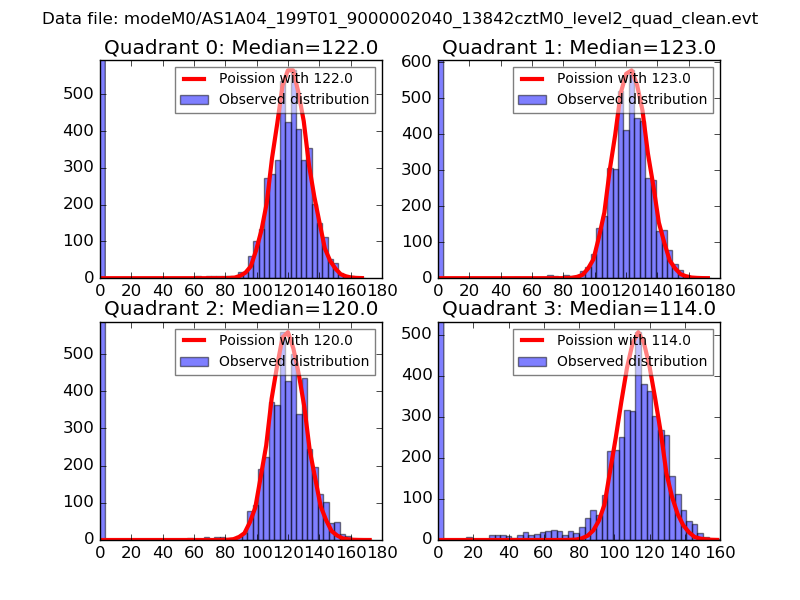 |
 |
| Quadrant-wise count rates Data is divided into 100 sec bins |
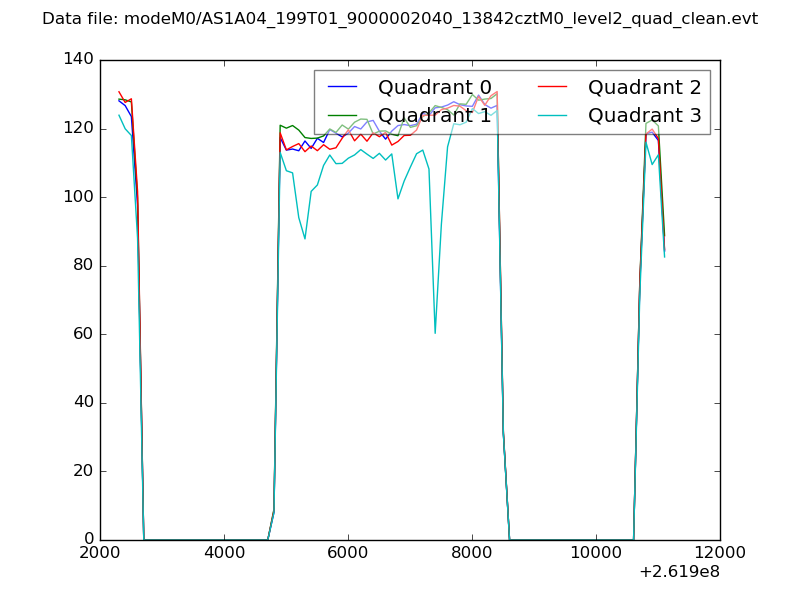 |
|
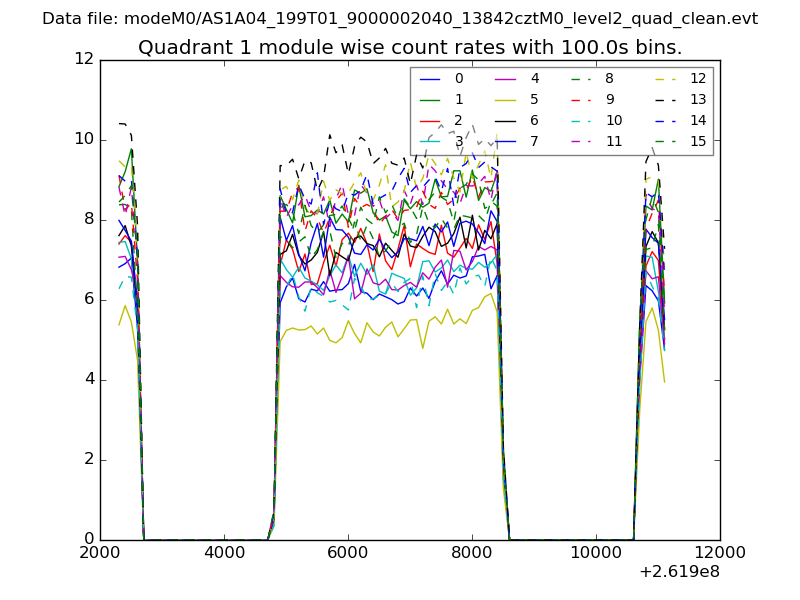
| Module-wise count rates for Quadrant A Data is divided into 100 sec bins |
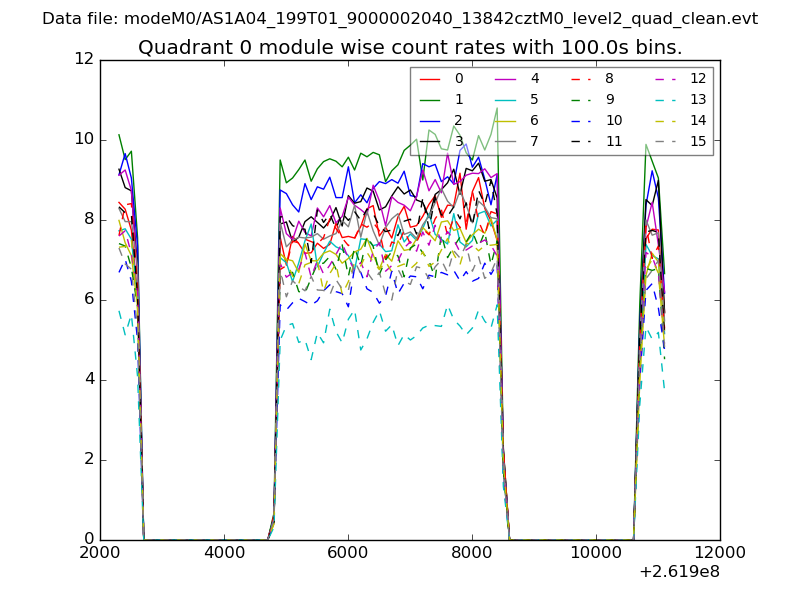 |
 |
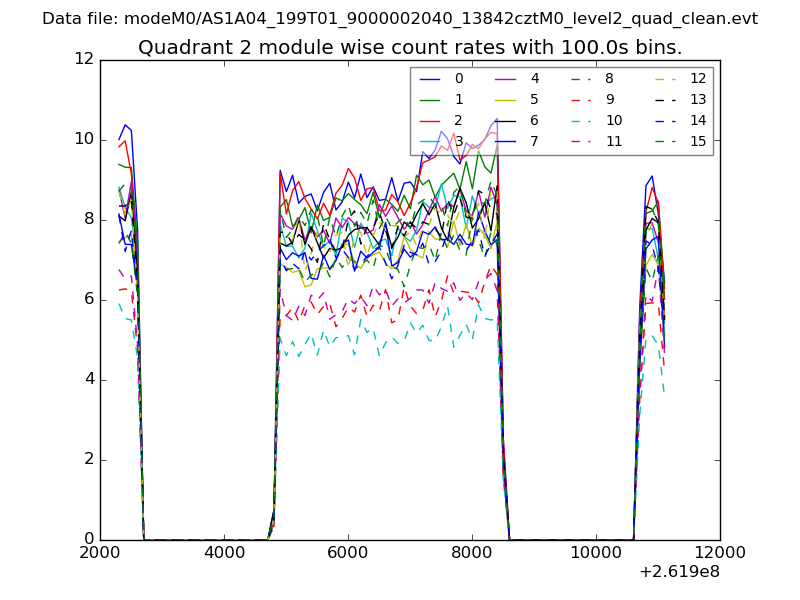
| Module-wise count rates for Quadrant B Data is divided into 100 sec bins |
 |
 |
| Module-wise count rates for Quadrant C Data is divided into 100 sec bins |
 |
 |
| Module-wise count rates for Quadrant D Data is divided into 100 sec bins |
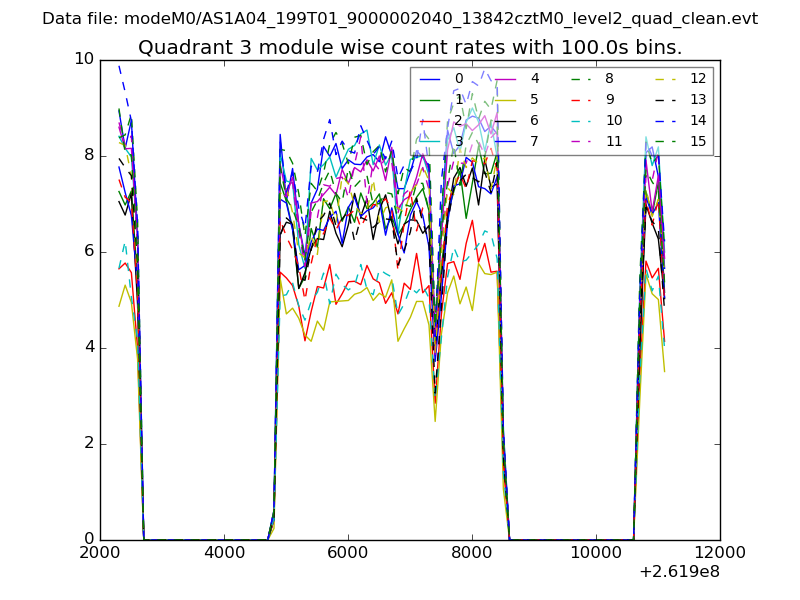 |
 |
| Parameter | Plot |
|---|---|
| CZT HV Monitor | 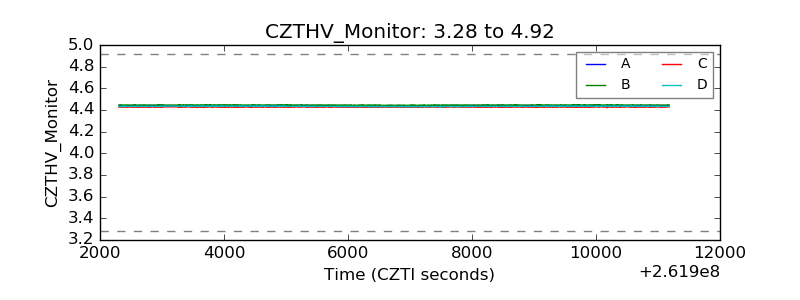 |
| D_VDD |  |
| Temperature 1 |  |
| Veto HV Monitor | 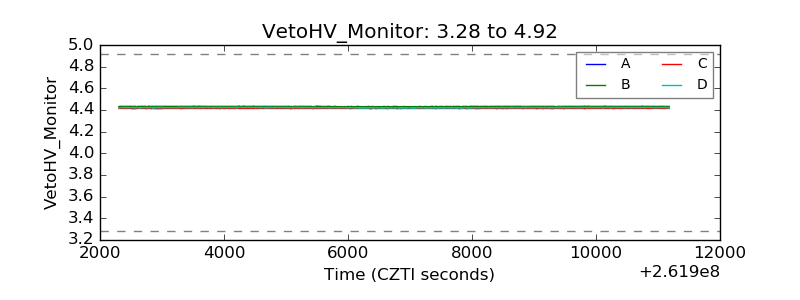 |
| Veto LLD | 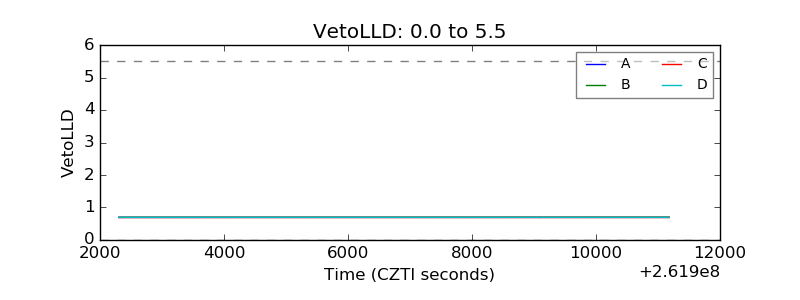 |
| Alpha Counter | 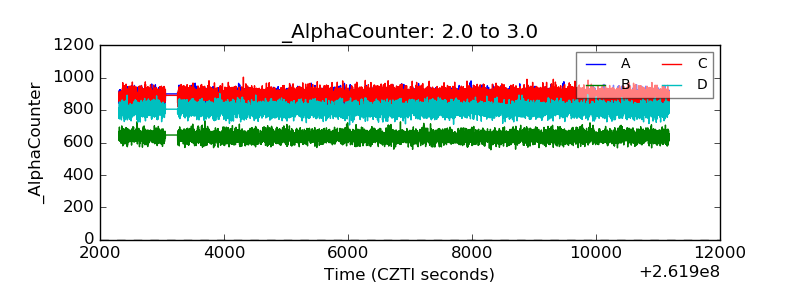 |
| _CPM_Rate | 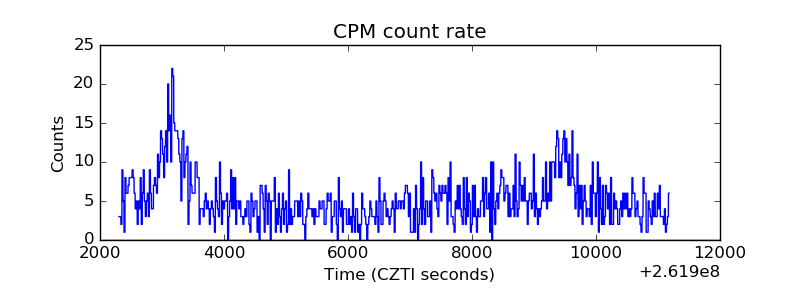 |
| CZT Counter | 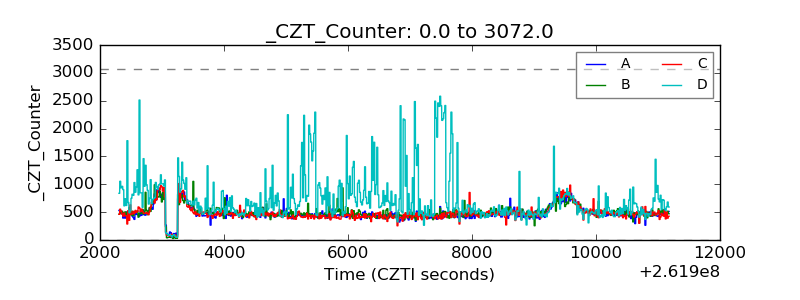 |
| +2.5 Volts monitor | 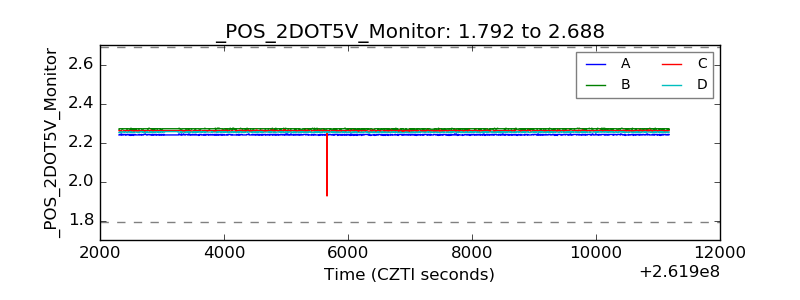 |
| +5 Volts monitor | 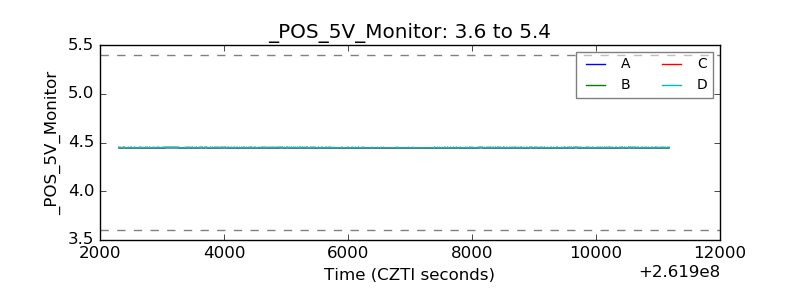 |
| _ROLL_ROT | 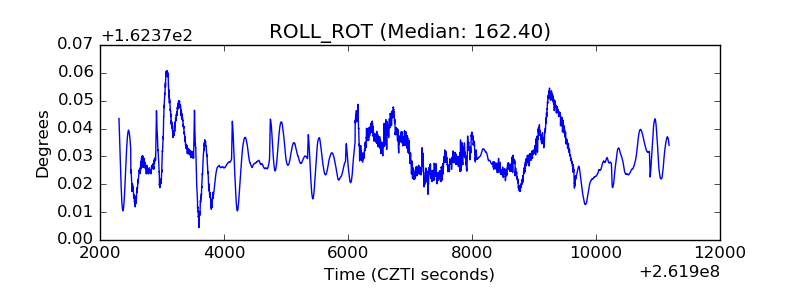 |
| _Roll_DEC | 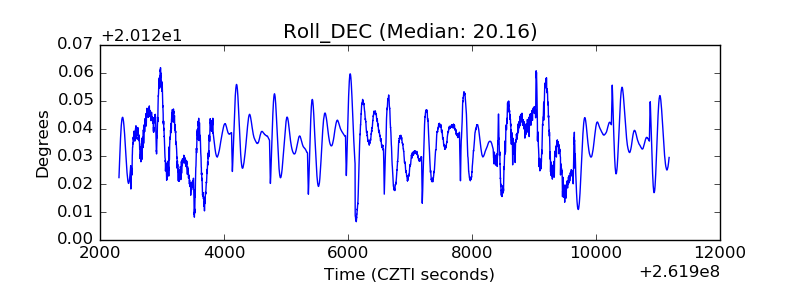 |
| _Roll_RA | 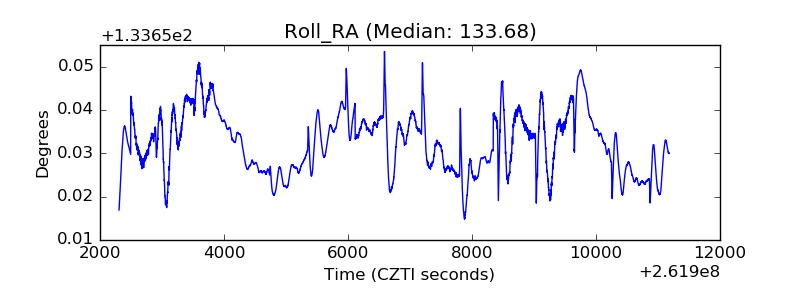 |
| Veto Counter | 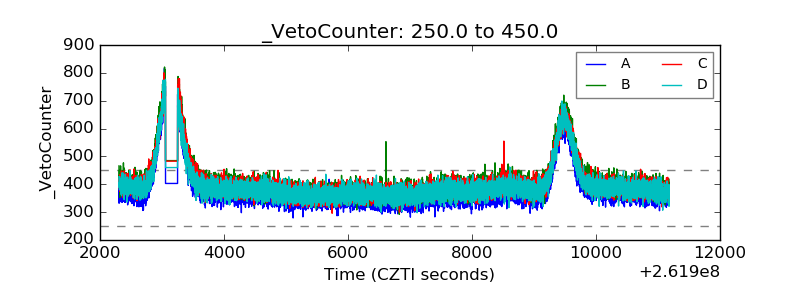 |