| Param | Original file | Final file |
|---|---|---|
| Filename | modeM0/AS1A04_199T01_9000002040_13846cztM0_level2.evt | modeM0/AS1A04_199T01_9000002040_13846cztM0_level2_quad_clean.evt |
| Size (bytes) | 436,533,120 | 82,258,560 |
| Size | 416.3 MB | 78.4 MB |
| Events in quadrant A | 3,006,868 | 517,228 |
| Events in quadrant B | 2,995,958 | 522,946 |
| Events in quadrant C | 2,895,593 | 513,936 |
| Events in quadrant D | 3,890,839 | 494,191 |
| Mode M9 | |||
|---|---|---|---|
| Quadrant | BADHDUFLAG | Total packets | Discarded packets |
| A | 0 | 9 | 0 |
| B | 0 | 9 | 0 |
| C | 0 | 9 | 0 |
| D | 0 | 9 | 0 |
| Mode SS | |||
|---|---|---|---|
| Quadrant | BADHDUFLAG | Total packets | Discarded packets |
| A | 0 | 128 | 0 |
| B | 0 | 128 | 0 |
| C | 0 | 128 | 0 |
| D | 0 | 128 | 0 |
| Mode M0 | |||
|---|---|---|---|
| Quadrant | BADHDUFLAG | Total packets | Discarded packets |
| A | 0 | 13238 | 2 |
| B | 0 | 13109 | 1 |
| C | 0 | 12966 | 1 |
| D | 0 | 15711 | 1 |
| Quadrant | Total seconds | Saturated seconds | Saturation percentage |
|---|---|---|---|
| A | 6346 | 50 | 0.787898% |
| B | 6346 | 51 | 0.803656% |
| C | 6346 | 31 | 0.488497% |
| D | 6346 | 96 | 1.512764% |
Noise dominated data is calculated using 1-second bins in cleaned event files. If a bin has >2000 counts, and if more than 50% of those come from <1% of pixels, then it is considered to be noise-dominated and hence unusable.
| Quadrant | # 1 sec bins | Bins with >0 counts | Bins with >2000 counts | High rate bins dominated by noise | Noise dominated (total time) | Noise dominated (detector-on time) | Marked lightcurve |
|---|---|---|---|---|---|---|---|
| A | 7227 | 6347 | 5 | 5 | 0.07% | 0.08% | 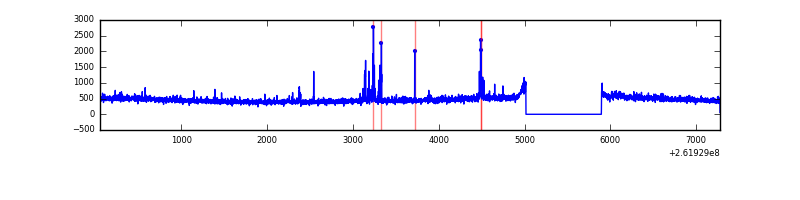 |
| B | 7227 | 6347 | 5 | 5 | 0.07% | 0.08% | 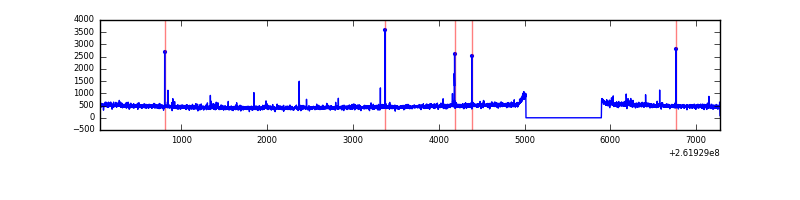 |
| C | 7227 | 6347 | 0 | 0 | 0.00% | 0.00% | 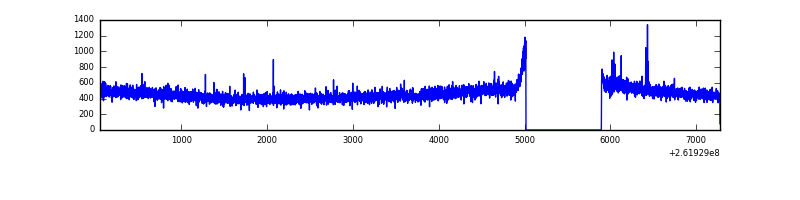 |
| D | 7227 | 6347 | 57 | 57 | 0.79% | 0.90% | 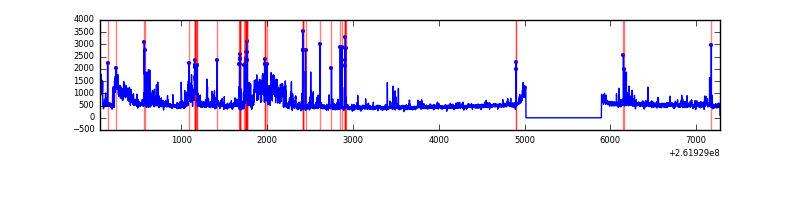 |
Top three noisy pixels from each quadrant. If the there are fewer than three noisy pixels in the level2.evt file, extra rows are filled as -1
| Pixel properties | Quadrant properties | ||||||
|---|---|---|---|---|---|---|---|
| Quadrant | DetID | PixID | Counts | Sigma | Mean | Median | Sigma |
| A | 9 | 143 | 80635 | 513.7 | 748 | 730 | 155.5 |
| A | 8 | 15 | 22033 | 136.95 | 748 | 730 | 155.5 |
| A | 1 | 162 | 13251 | 80.5 | 748 | 730 | 155.5 |
| B | 0 | 219 | 24879 | 169.06 | 745 | 727 | 142.9 |
| B | 4 | 80 | 20088 | 135.52 | 745 | 727 | 142.9 |
| B | 12 | 111 | 16655 | 111.49 | 745 | 727 | 142.9 |
| C | 3 | 233 | 51373 | 296.82 | 729 | 731 | 170.6 |
| C | 13 | 61 | 5162 | 25.97 | 729 | 731 | 170.6 |
| C | 14 | 220 | 2644 | 11.21 | 729 | 731 | 170.6 |
| D | 1 | 52 | 809726 | 4639.06 | 723 | 705 | 174.4 |
| D | 10 | 157 | 222670 | 1272.79 | 723 | 705 | 174.4 |
| D | 5 | 222 | 35395 | 198.92 | 723 | 705 | 174.4 |
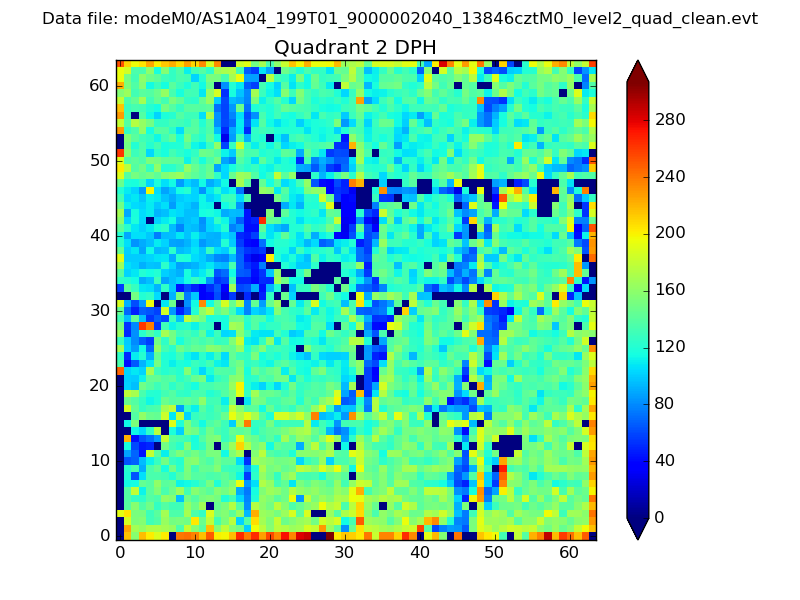
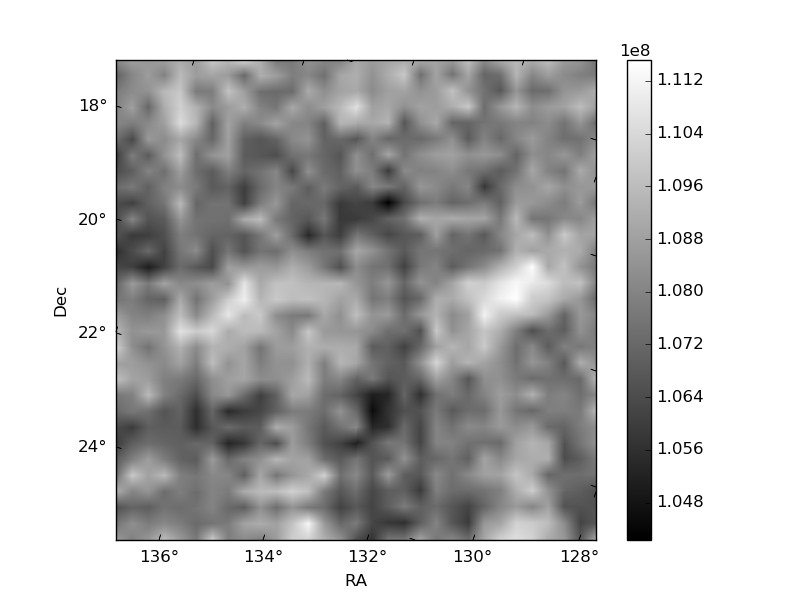
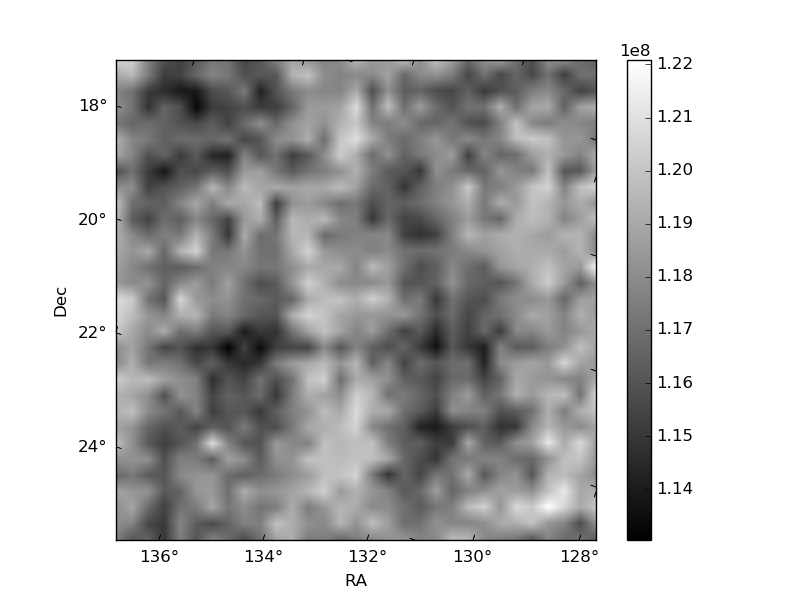
Histogram calculated using DETX and DETY for each event in the final _common_clean file
| Quadrant A | 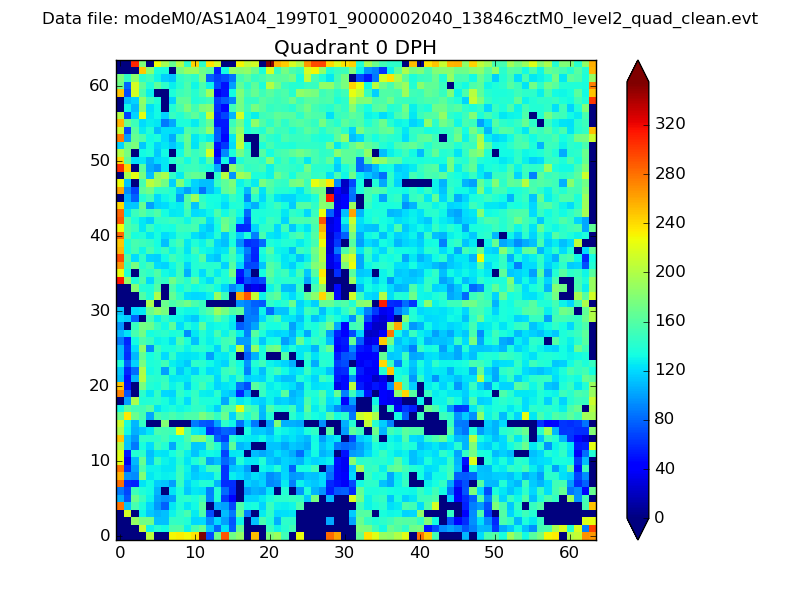 |
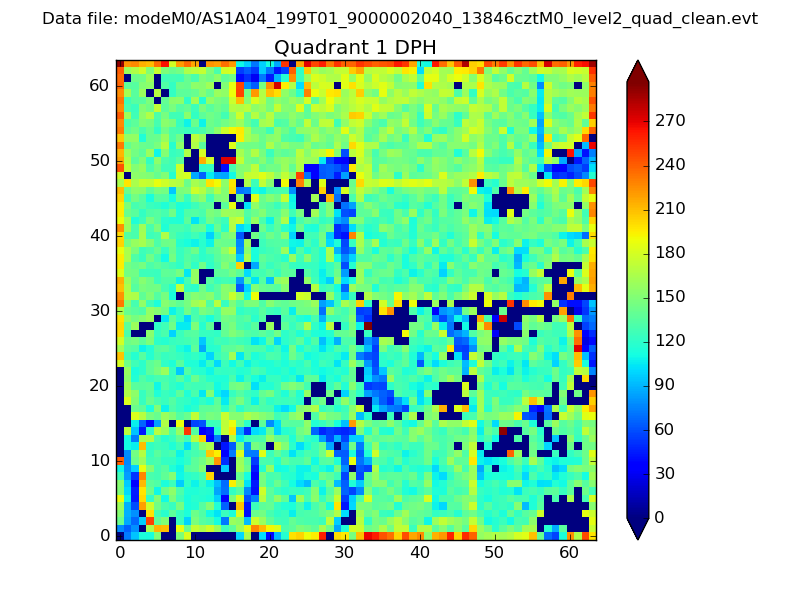 |
Quadrant B |
|---|---|---|---|
| Quadrant D | 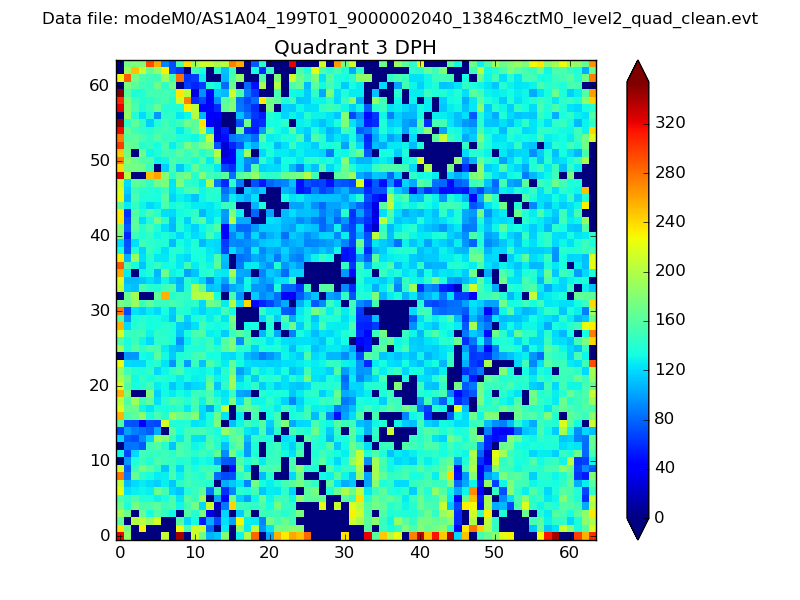 |
 |
Quadrant C |
| Plot type | Count rate plots | Images |
|---|---|---|
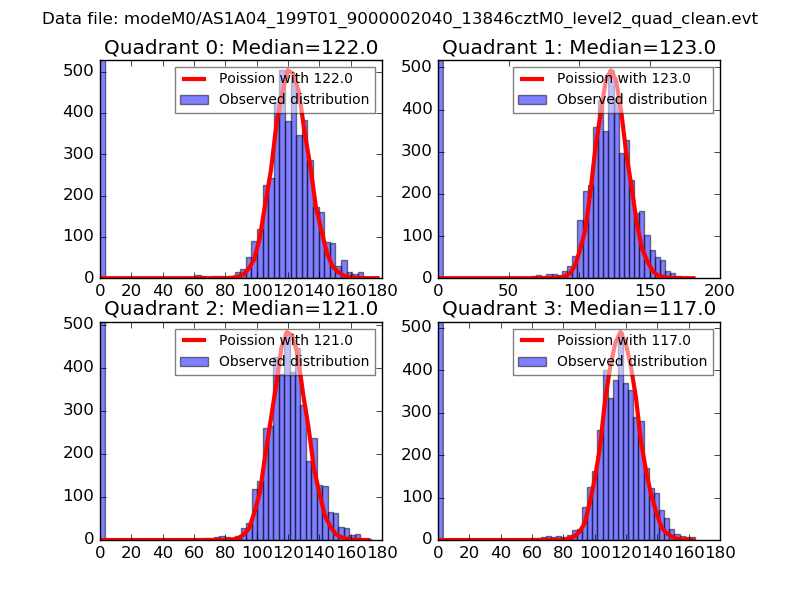
| Comparison with Poisson distribution Blue bars denote a histogram of data divided into 1 sec bins. Red curve is a Poisson curve with rate = median count rate of data. |
 |
 |
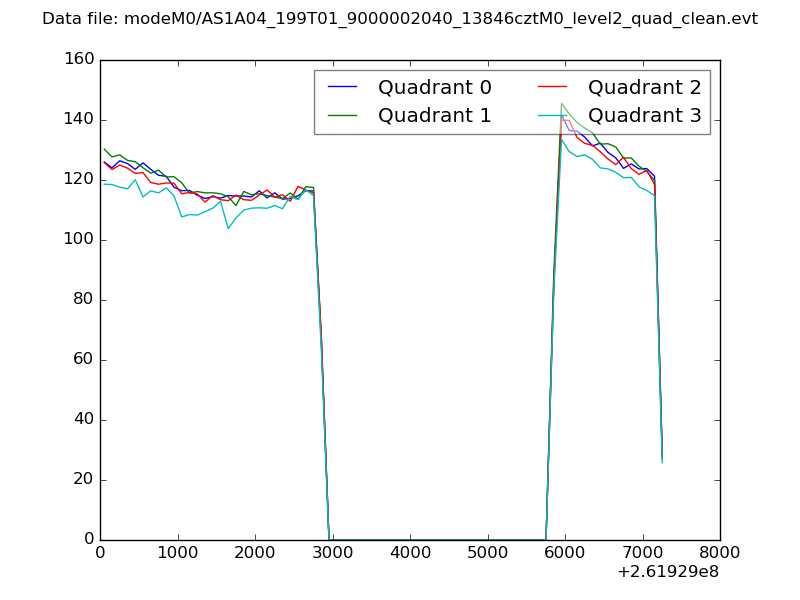
| Quadrant-wise count rates Data is divided into 100 sec bins |
 |
|
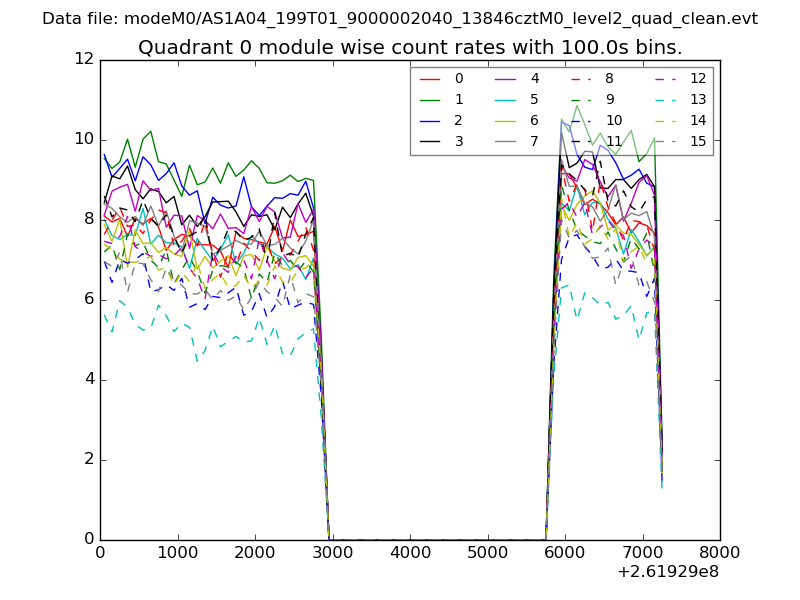
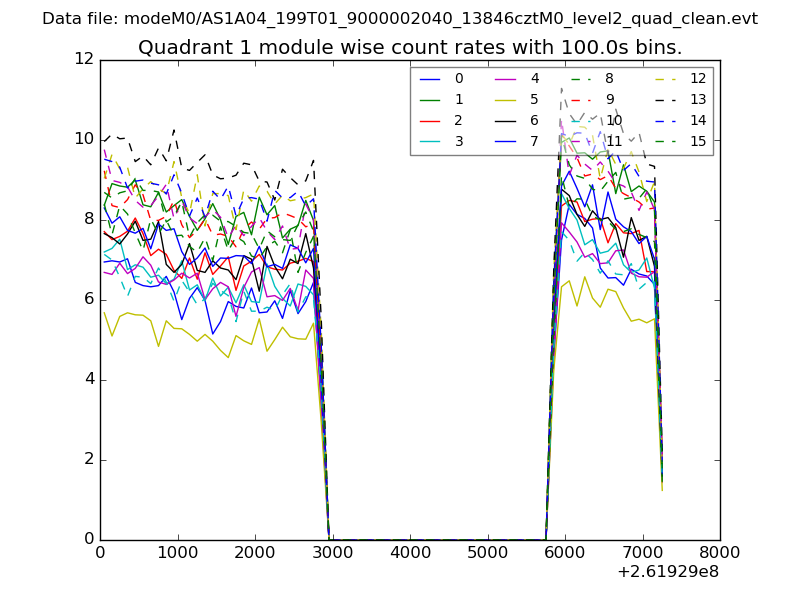
| Module-wise count rates for Quadrant A Data is divided into 100 sec bins |
 |
 |
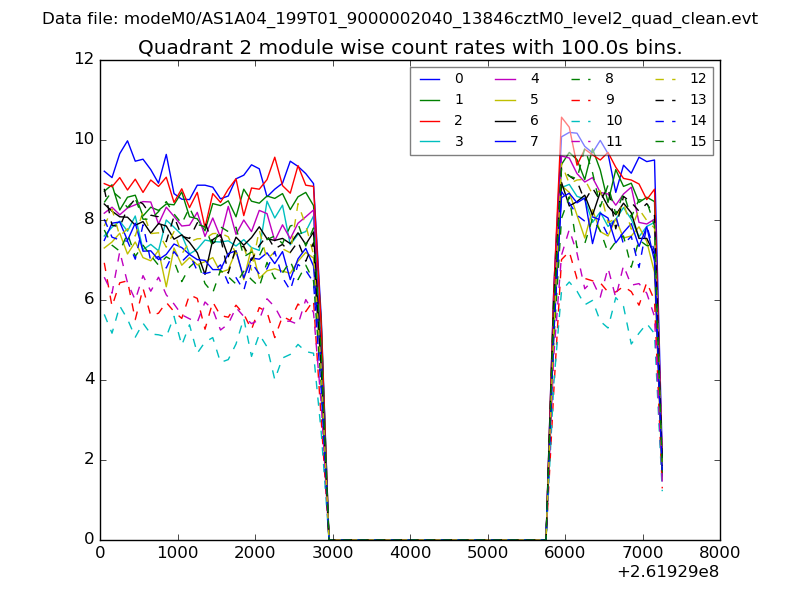
| Module-wise count rates for Quadrant B Data is divided into 100 sec bins |
 |
 |
| Module-wise count rates for Quadrant C Data is divided into 100 sec bins |
 |
 |
| Module-wise count rates for Quadrant D Data is divided into 100 sec bins |
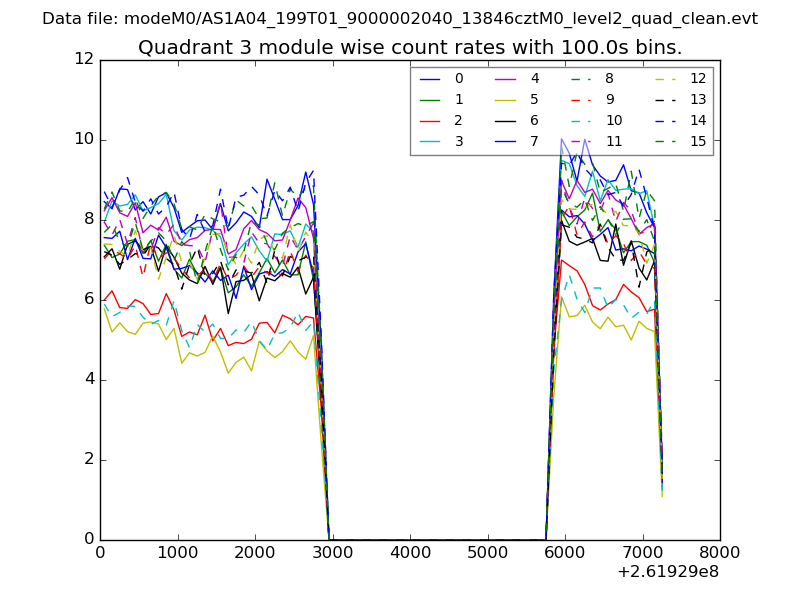 |
 |
| Parameter | Plot |
|---|---|
| CZT HV Monitor | 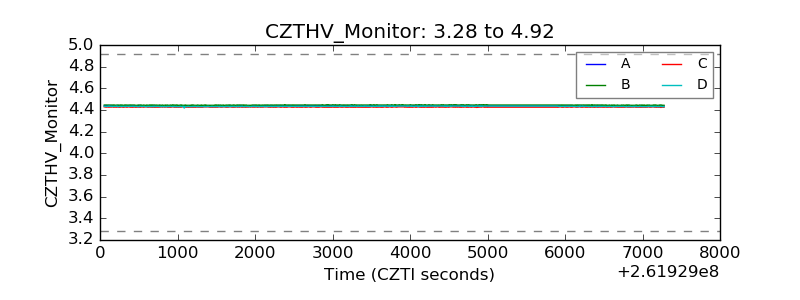 |
| D_VDD | 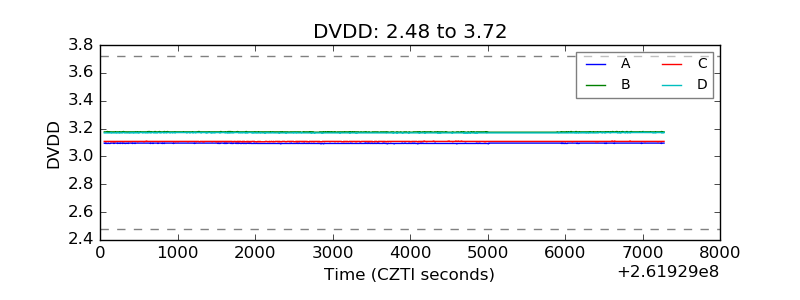 |
| Temperature 1 | 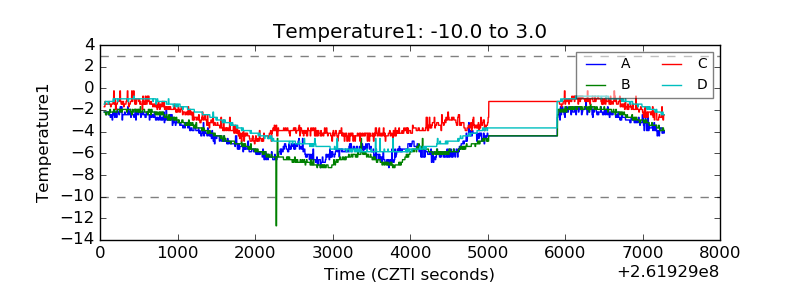 |
| Veto HV Monitor |  |
| Veto LLD | 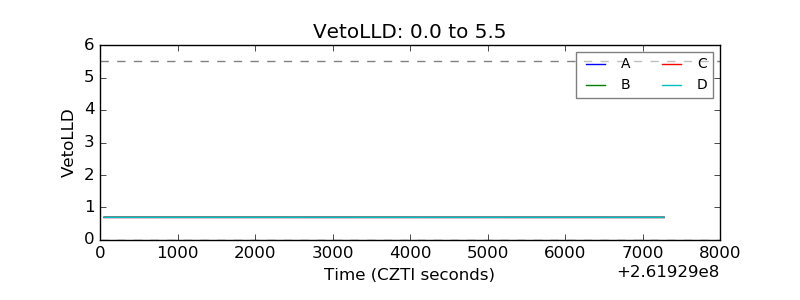 |
| Alpha Counter | 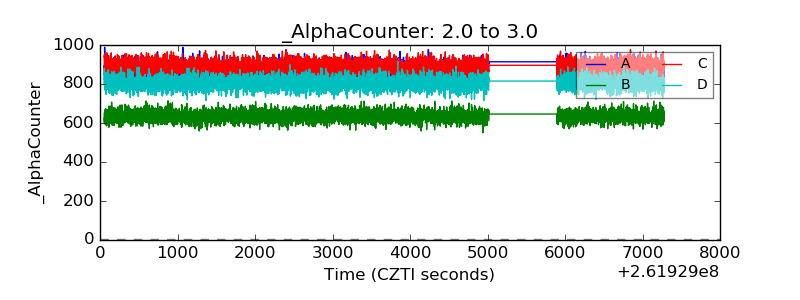 |
| _CPM_Rate | 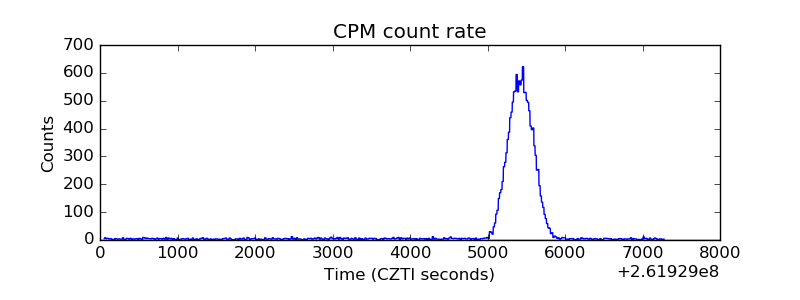 |
| CZT Counter | 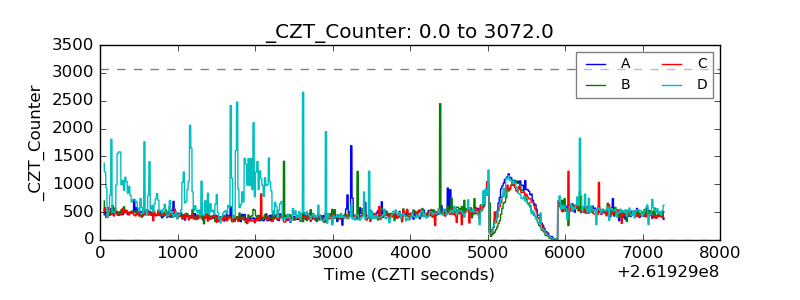 |
| +2.5 Volts monitor |  |
| +5 Volts monitor | 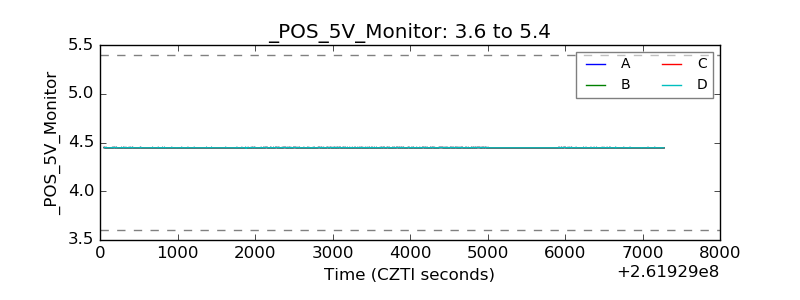 |
| _ROLL_ROT | 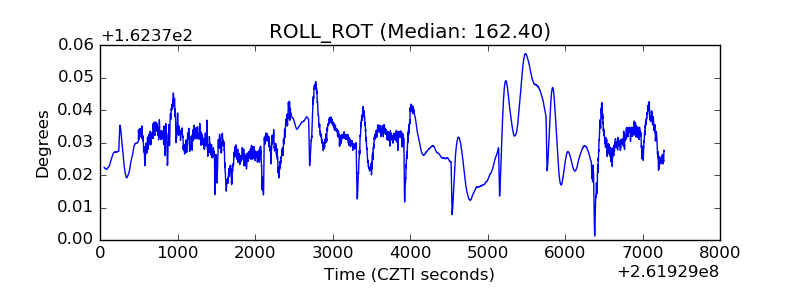 |
| _Roll_DEC | 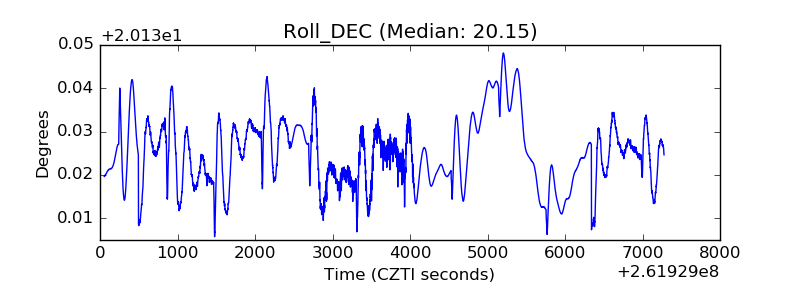 |
| _Roll_RA | 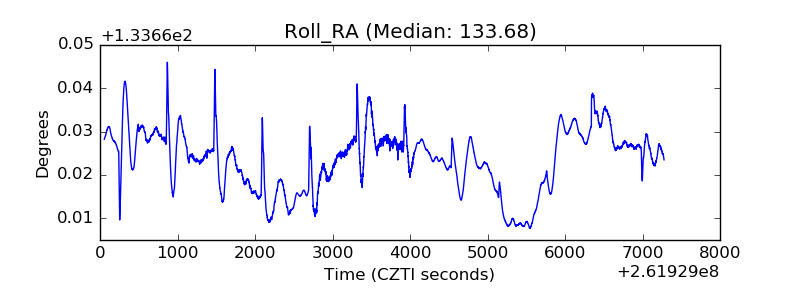 |
| Veto Counter | 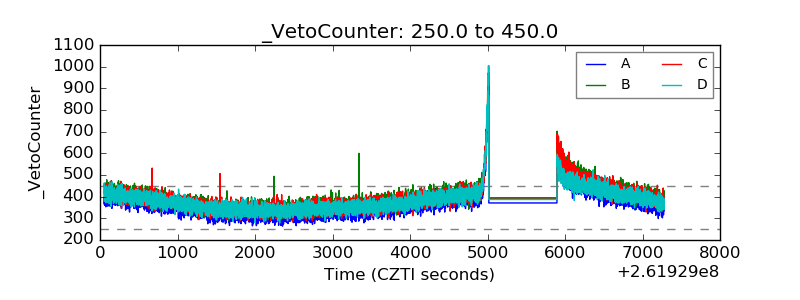 |