| Param | Original file | Final file |
|---|---|---|
| Filename | modeM0/AS1A04_199T01_9000002040_13847cztM0_level2.evt | modeM0/AS1A04_199T01_9000002040_13847cztM0_level2_quad_clean.evt |
| Size (bytes) | 466,997,760 | 89,663,040 |
| Size | 445.4 MB | 85.5 MB |
| Events in quadrant A | 3,213,493 | 570,726 |
| Events in quadrant B | 3,348,759 | 576,681 |
| Events in quadrant C | 3,093,515 | 565,635 |
| Events in quadrant D | 4,040,600 | 543,683 |
| Mode M9 | |||
|---|---|---|---|
| Quadrant | BADHDUFLAG | Total packets | Discarded packets |
| A | 0 | 12 | 0 |
| B | 0 | 12 | 0 |
| C | 0 | 12 | 0 |
| D | 0 | 13 | 0 |
| Mode SS | |||
|---|---|---|---|
| Quadrant | BADHDUFLAG | Total packets | Discarded packets |
| A | 0 | 132 | 0 |
| B | 0 | 132 | 0 |
| C | 0 | 132 | 0 |
| D | 0 | 132 | 0 |
| Mode M0 | |||
|---|---|---|---|
| Quadrant | BADHDUFLAG | Total packets | Discarded packets |
| A | 0 | 13996 | 3 |
| B | 0 | 14229 | 2 |
| C | 0 | 13639 | 2 |
| D | 0 | 16404 | 2 |
| Quadrant | Total seconds | Saturated seconds | Saturation percentage |
|---|---|---|---|
| A | 6581 | 83 | 1.261207% |
| B | 6581 | 97 | 1.473940% |
| C | 6581 | 41 | 0.623006% |
| D | 6581 | 66 | 1.002887% |
Noise dominated data is calculated using 1-second bins in cleaned event files. If a bin has >2000 counts, and if more than 50% of those come from <1% of pixels, then it is considered to be noise-dominated and hence unusable.
| Quadrant | # 1 sec bins | Bins with >0 counts | Bins with >2000 counts | High rate bins dominated by noise | Noise dominated (total time) | Noise dominated (detector-on time) | Marked lightcurve |
|---|---|---|---|---|---|---|---|
| A | 7567 | 6582 | 26 | 26 | 0.34% | 0.40% | 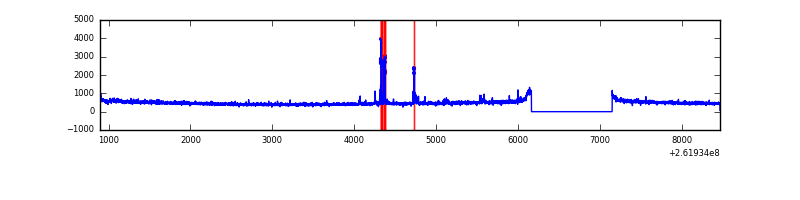 |
| B | 7567 | 6582 | 30 | 30 | 0.40% | 0.46% | 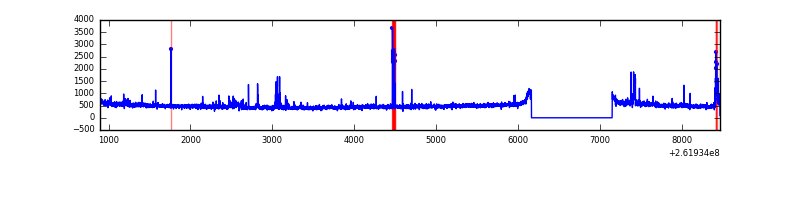 |
| C | 7567 | 6582 | 0 | 0 | 0.00% | 0.00% | 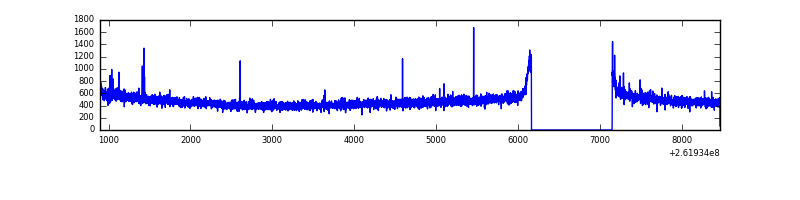 |
| D | 7567 | 6582 | 38 | 38 | 0.50% | 0.58% | 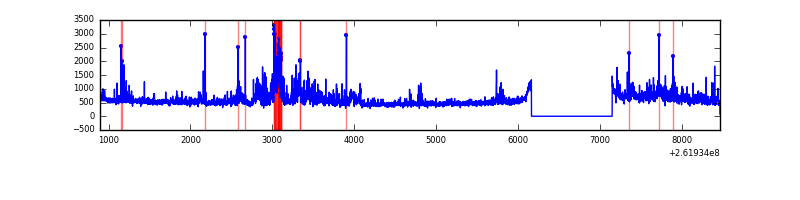 |
Top three noisy pixels from each quadrant. If the there are fewer than three noisy pixels in the level2.evt file, extra rows are filled as -1
| Pixel properties | Quadrant properties | ||||||
|---|---|---|---|---|---|---|---|
| Quadrant | DetID | PixID | Counts | Sigma | Mean | Median | Sigma |
| A | 9 | 143 | 121308 | 740.8 | 794 | 778 | 162.7 |
| A | 8 | 15 | 23015 | 136.67 | 794 | 778 | 162.7 |
| A | 0 | 23 | 11158 | 63.8 | 794 | 778 | 162.7 |
| B | 3 | 64 | 114254 | 736.86 | 795 | 776 | 154.0 |
| B | 0 | 219 | 67681 | 434.44 | 795 | 776 | 154.0 |
| B | 3 | 209 | 21769 | 136.32 | 795 | 776 | 154.0 |
| C | 3 | 233 | 60584 | 331.17 | 777 | 781 | 180.6 |
| C | 13 | 61 | 5470 | 25.97 | 777 | 781 | 180.6 |
| C | 14 | 234 | 3730 | 16.33 | 777 | 781 | 180.6 |
| D | 1 | 52 | 622632 | 3318.52 | 773 | 754 | 187.4 |
| D | 5 | 222 | 228584 | 1215.77 | 773 | 754 | 187.4 |
| D | 10 | 157 | 179172 | 952.09 | 773 | 754 | 187.4 |
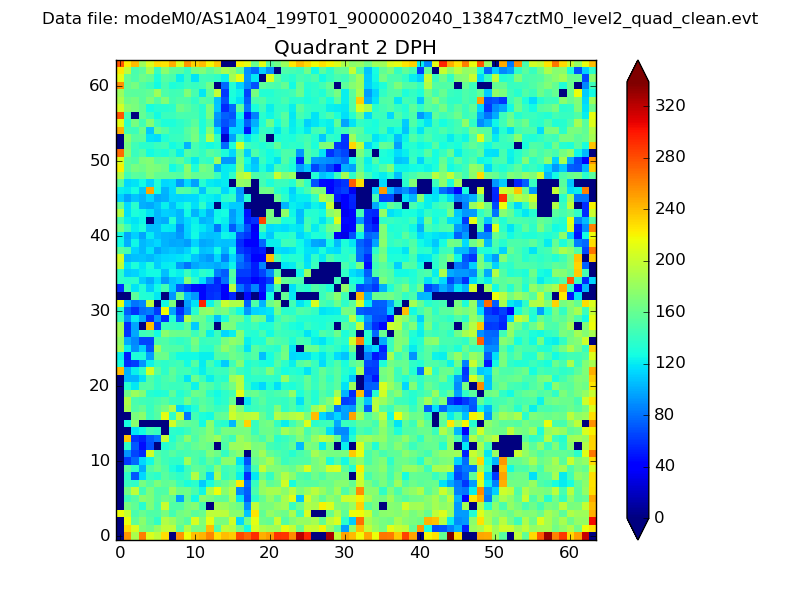
Histogram calculated using DETX and DETY for each event in the final _common_clean file
| Quadrant A | 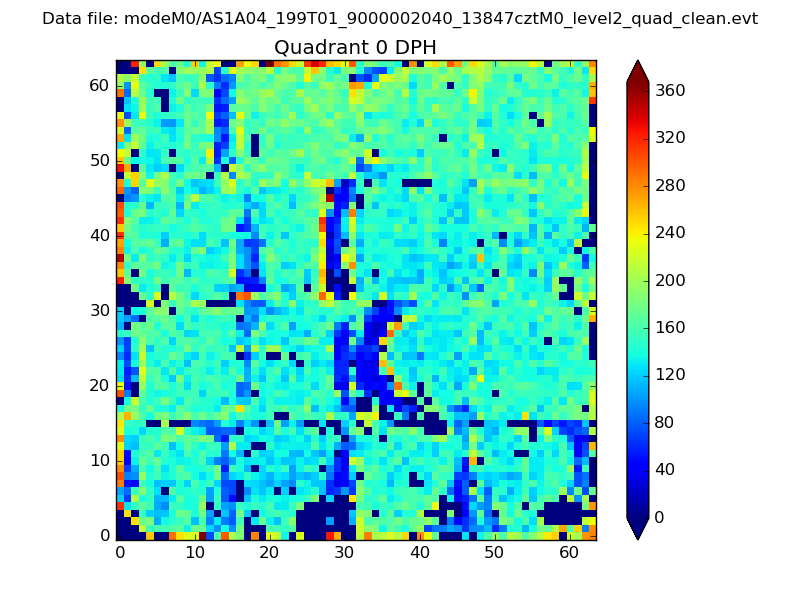 |
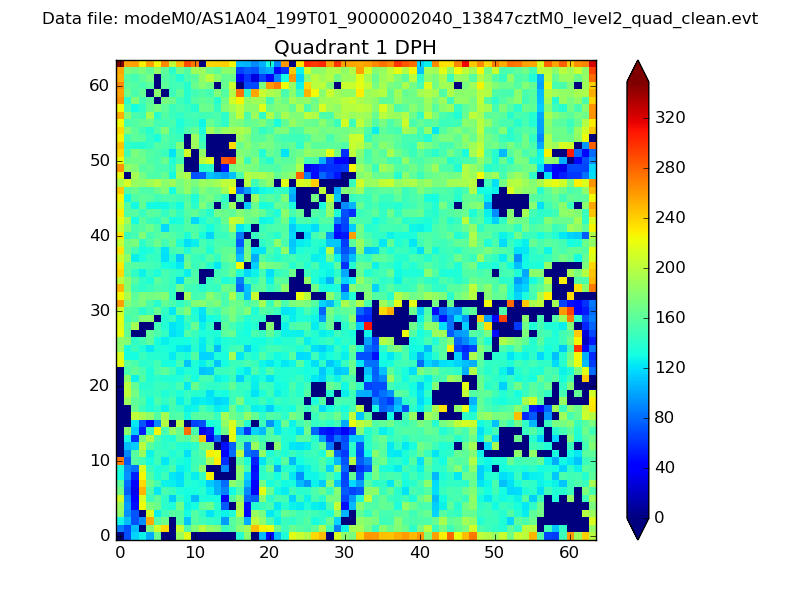 |
Quadrant B |
|---|---|---|---|
| Quadrant D | 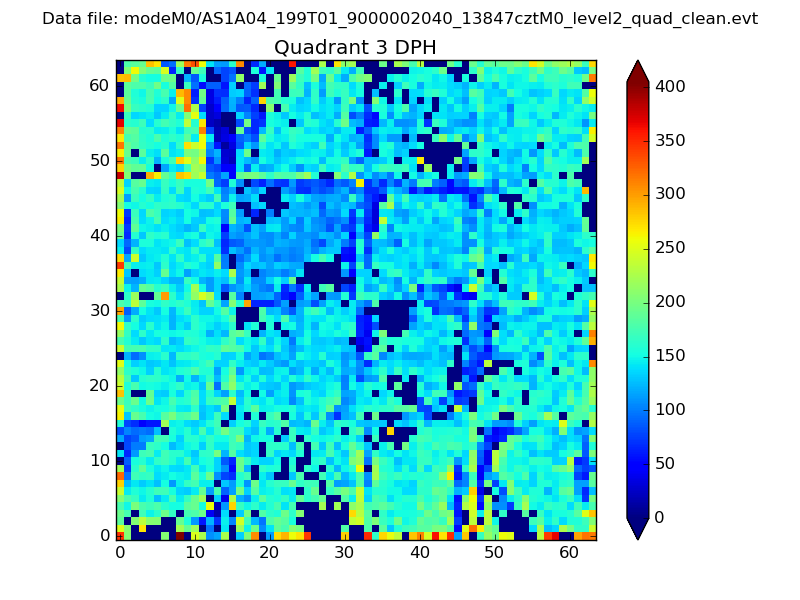 |
 |
Quadrant C |
| Plot type | Count rate plots | Images |
|---|---|---|
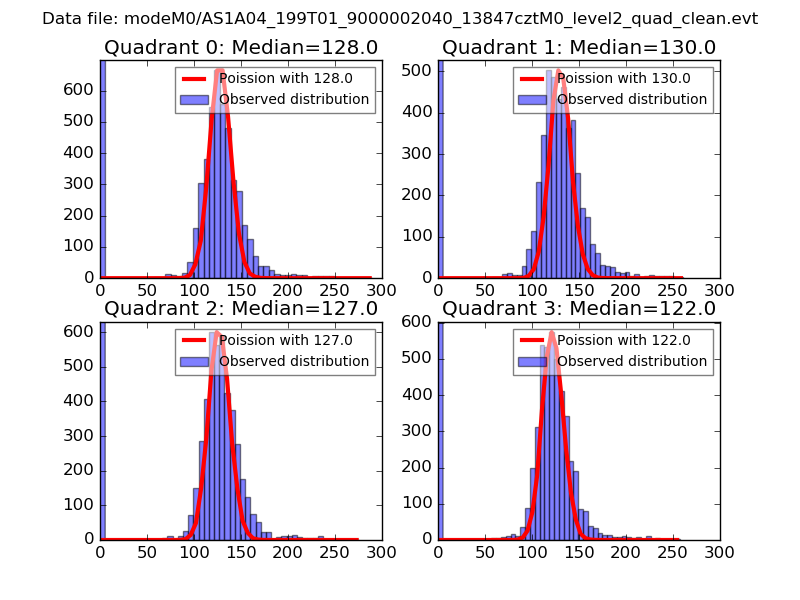
| Comparison with Poisson distribution Blue bars denote a histogram of data divided into 1 sec bins. Red curve is a Poisson curve with rate = median count rate of data. |
 |
 |
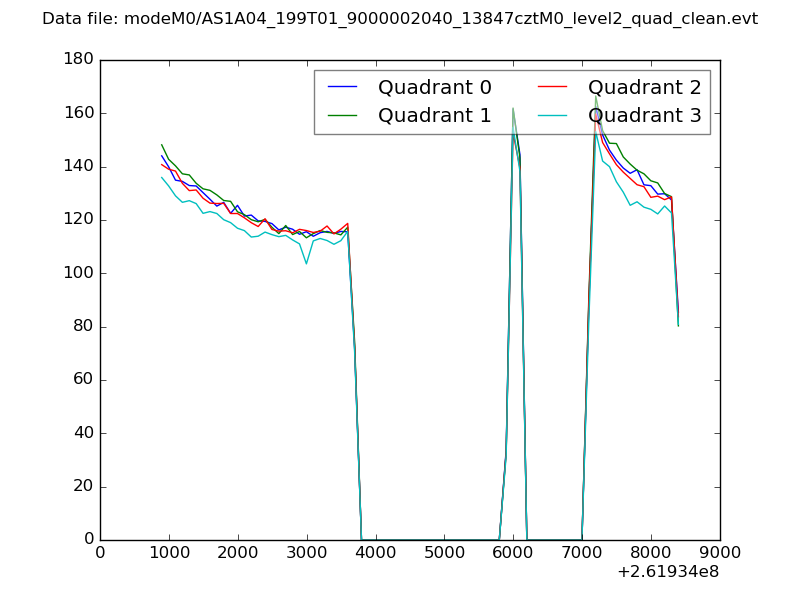
| Quadrant-wise count rates Data is divided into 100 sec bins |
 |
|
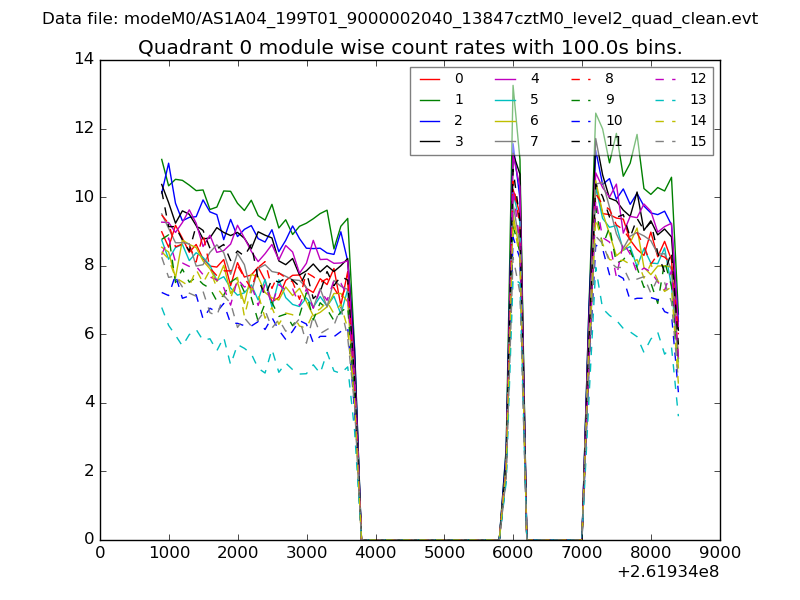
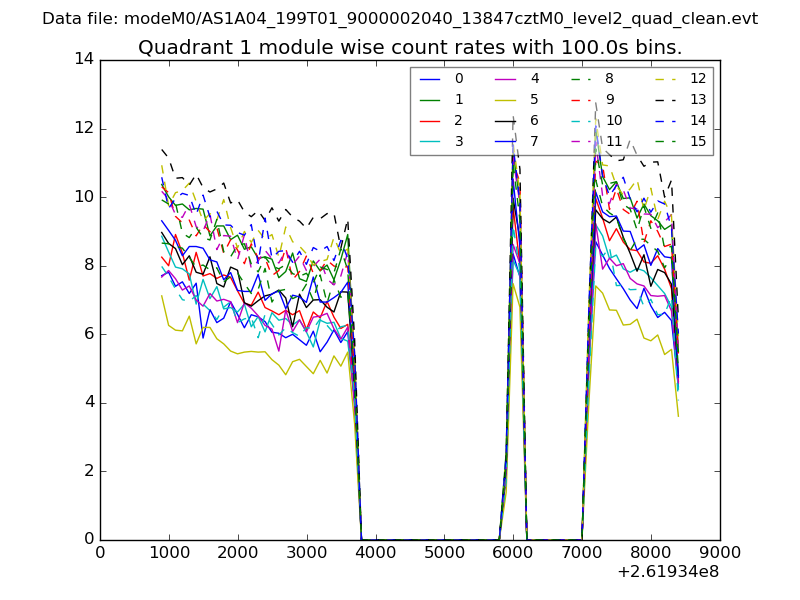
| Module-wise count rates for Quadrant A Data is divided into 100 sec bins |
 |
 |
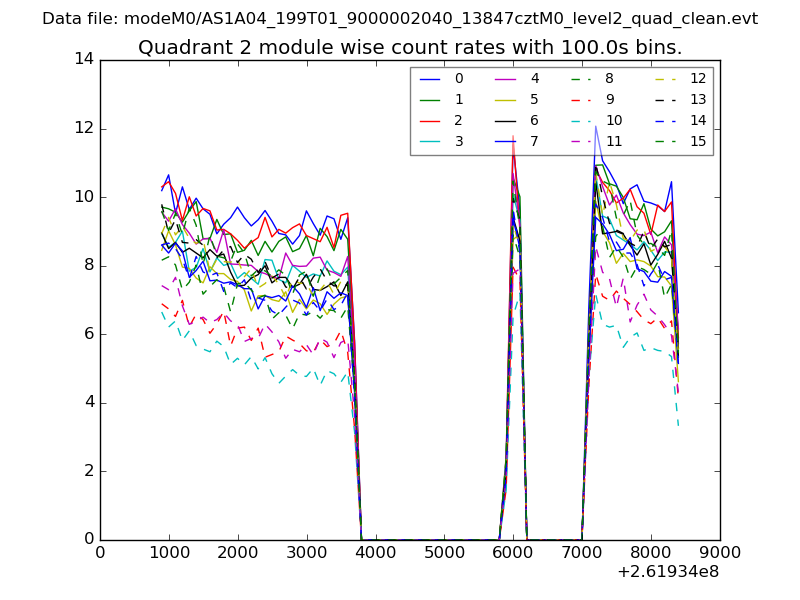
| Module-wise count rates for Quadrant B Data is divided into 100 sec bins |
 |
 |
| Module-wise count rates for Quadrant C Data is divided into 100 sec bins |
 |
 |
| Module-wise count rates for Quadrant D Data is divided into 100 sec bins |
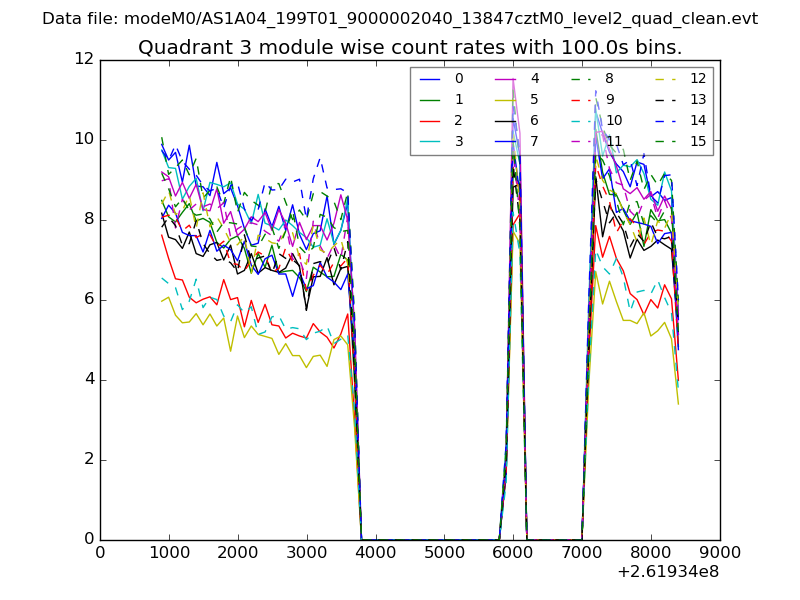 |
 |
| Parameter | Plot |
|---|---|
| CZT HV Monitor | 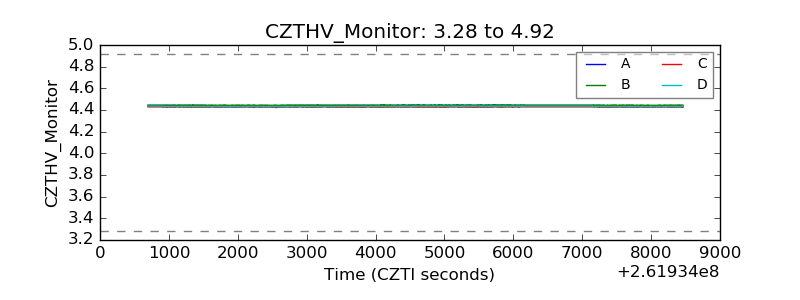 |
| D_VDD | 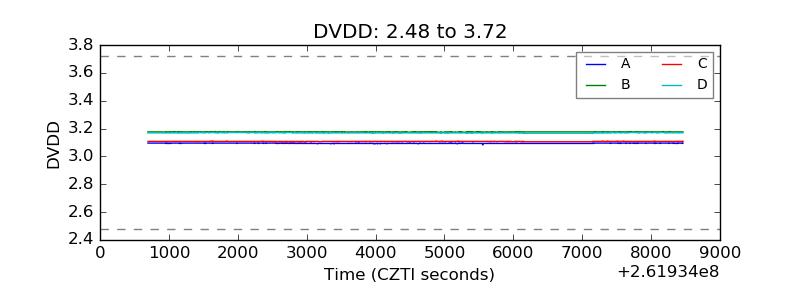 |
| Temperature 1 | 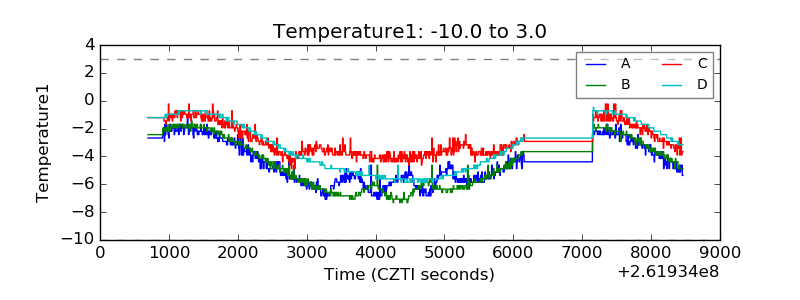 |
| Veto HV Monitor | 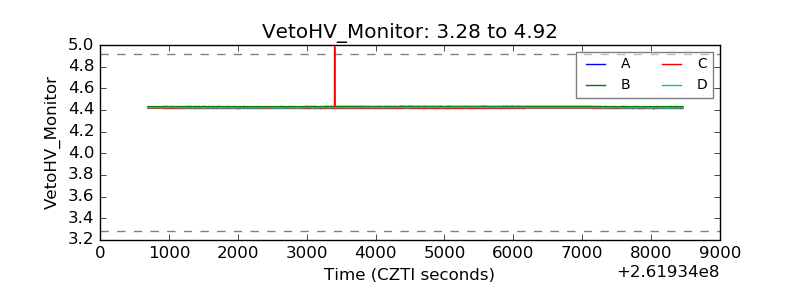 |
| Veto LLD |  |
| Alpha Counter | 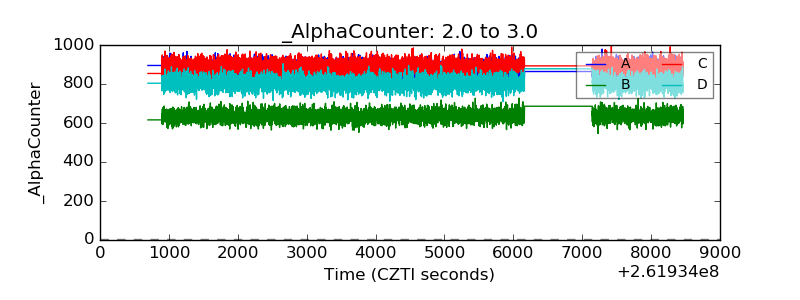 |
| _CPM_Rate | 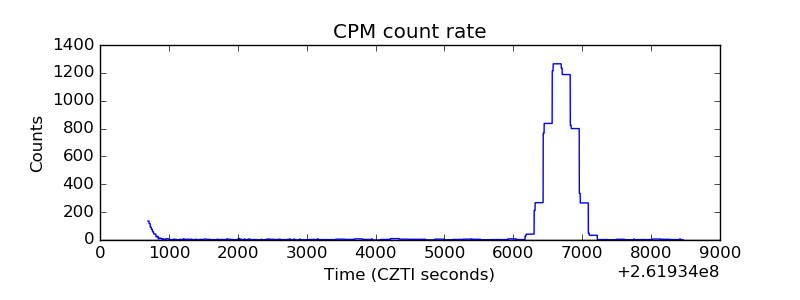 |
| CZT Counter | 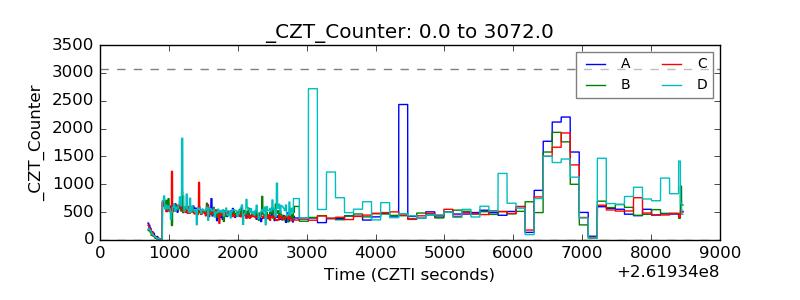 |
| +2.5 Volts monitor |  |
| +5 Volts monitor |  |
| _ROLL_ROT | 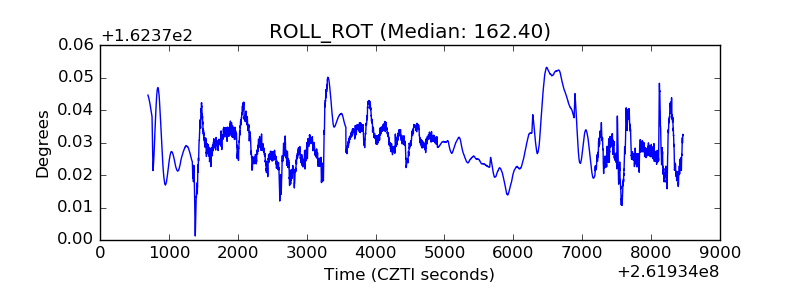 |
| _Roll_DEC | 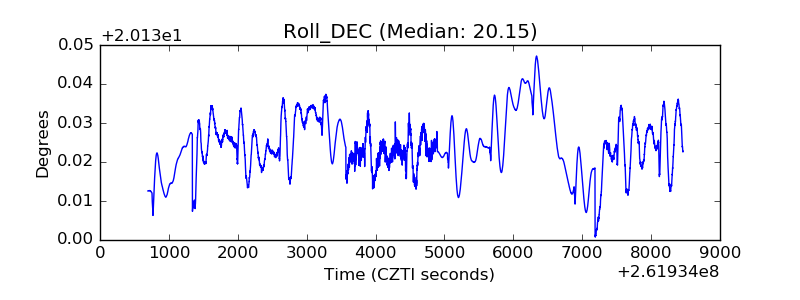 |
| _Roll_RA | 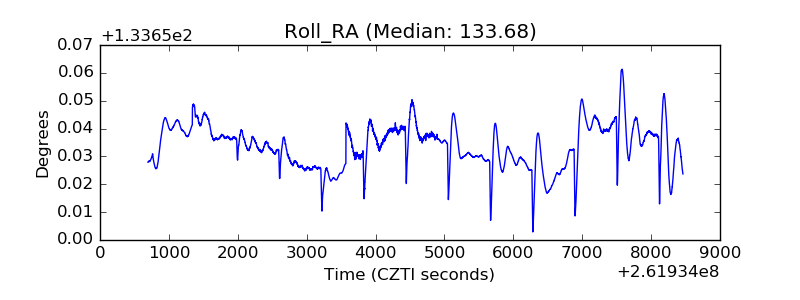 |
| Veto Counter | 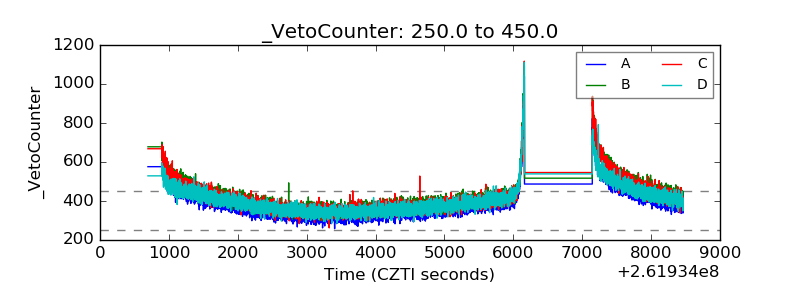 |