| Param | Original file | Final file |
|---|---|---|
| Filename | modeM0/AS1A04_199T01_9000002040_13851cztM0_level2.evt | modeM0/AS1A04_199T01_9000002040_13851cztM0_level2_quad_clean.evt |
| Size (bytes) | 481,210,560 | 88,799,040 |
| Size | 458.9 MB | 84.7 MB |
| Events in quadrant A | 3,182,773 | 570,127 |
| Events in quadrant B | 3,284,032 | 589,094 |
| Events in quadrant C | 3,086,722 | 567,522 |
| Events in quadrant D | 4,597,207 | 527,457 |
| Mode M9 | |||
|---|---|---|---|
| Quadrant | BADHDUFLAG | Total packets | Discarded packets |
| A | 0 | 19 | 0 |
| B | 0 | 19 | 0 |
| C | 0 | 19 | 0 |
| D | 0 | 20 | 0 |
| Mode SS | |||
|---|---|---|---|
| Quadrant | BADHDUFLAG | Total packets | Discarded packets |
| A | 0 | 128 | 0 |
| B | 0 | 128 | 0 |
| C | 0 | 128 | 0 |
| D | 0 | 128 | 0 |
| Mode M0 | |||
|---|---|---|---|
| Quadrant | BADHDUFLAG | Total packets | Discarded packets |
| A | 0 | 13389 | 3 |
| B | 0 | 13459 | 2 |
| C | 0 | 13037 | 2 |
| D | 0 | 17842 | 2 |
| Quadrant | Total seconds | Saturated seconds | Saturation percentage |
|---|---|---|---|
| A | 6225 | 41 | 0.658635% |
| B | 6225 | 44 | 0.706827% |
| C | 6225 | 24 | 0.385542% |
| D | 6225 | 200 | 3.212851% |
Noise dominated data is calculated using 1-second bins in cleaned event files. If a bin has >2000 counts, and if more than 50% of those come from <1% of pixels, then it is considered to be noise-dominated and hence unusable.
| Quadrant | # 1 sec bins | Bins with >0 counts | Bins with >2000 counts | High rate bins dominated by noise | Noise dominated (total time) | Noise dominated (detector-on time) | Marked lightcurve |
|---|---|---|---|---|---|---|---|
| A | 7546 | 6226 | 7 | 7 | 0.09% | 0.11% | 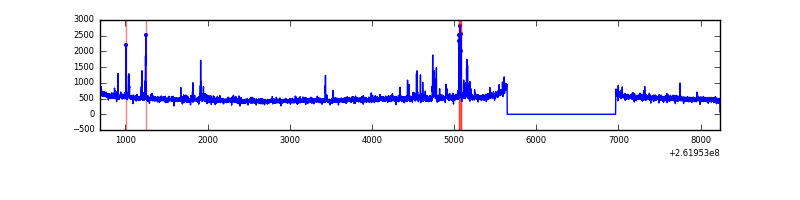 |
| B | 7546 | 6226 | 6 | 6 | 0.08% | 0.10% | 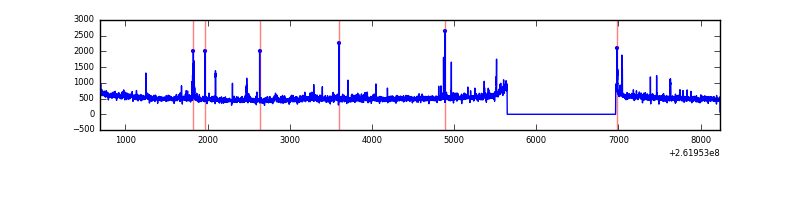 |
| C | 7546 | 6227 | 12 | 12 | 0.16% | 0.19% | 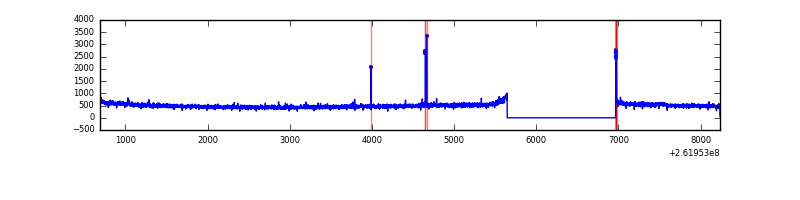 |
| D | 7546 | 6227 | 190 | 190 | 2.52% | 3.05% | 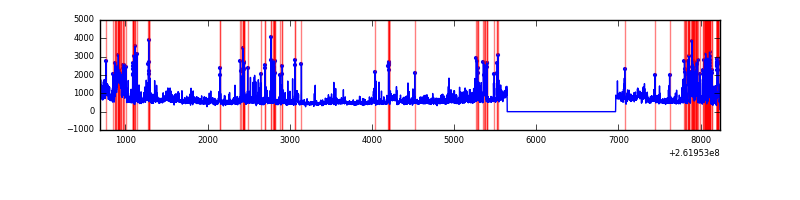 |
Top three noisy pixels from each quadrant. If the there are fewer than three noisy pixels in the level2.evt file, extra rows are filled as -1
| Pixel properties | Quadrant properties | ||||||
|---|---|---|---|---|---|---|---|
| Quadrant | DetID | PixID | Counts | Sigma | Mean | Median | Sigma |
| A | 9 | 143 | 114785 | 722.82 | 782 | 767 | 157.7 |
| A | 15 | 69 | 31227 | 193.1 | 782 | 767 | 157.7 |
| A | 8 | 15 | 23399 | 143.48 | 782 | 767 | 157.7 |
| B | 3 | 64 | 88490 | 590.63 | 789 | 770 | 148.5 |
| B | 4 | 80 | 36645 | 241.55 | 789 | 770 | 148.5 |
| B | 4 | 173 | 25867 | 168.98 | 789 | 770 | 148.5 |
| C | 3 | 233 | 53855 | 300.94 | 760 | 766 | 176.4 |
| C | 14 | 220 | 35457 | 196.65 | 760 | 766 | 176.4 |
| C | 6 | 253 | 22076 | 120.8 | 760 | 766 | 176.4 |
| D | 1 | 52 | 748438 | 4133.59 | 739 | 722 | 180.9 |
| D | 13 | 189 | 315173 | 1738.38 | 739 | 722 | 180.9 |
| D | 5 | 222 | 308093 | 1699.24 | 739 | 722 | 180.9 |
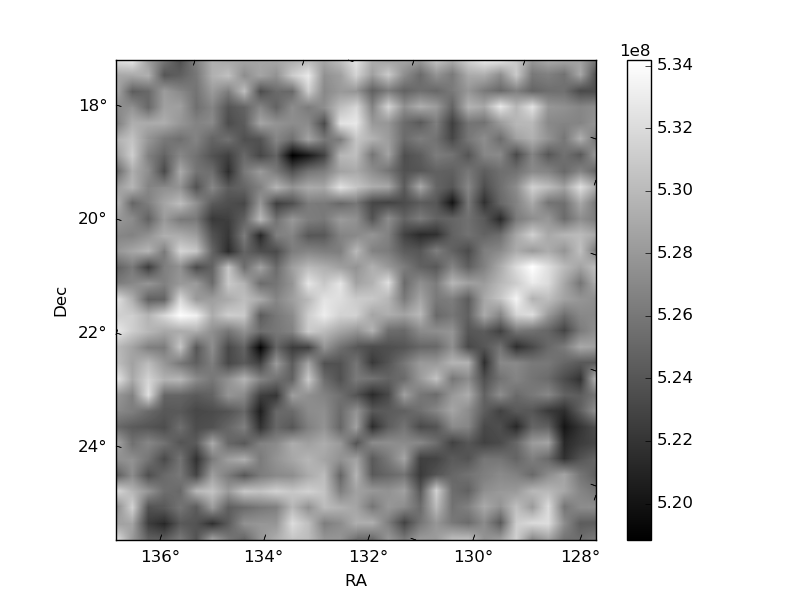
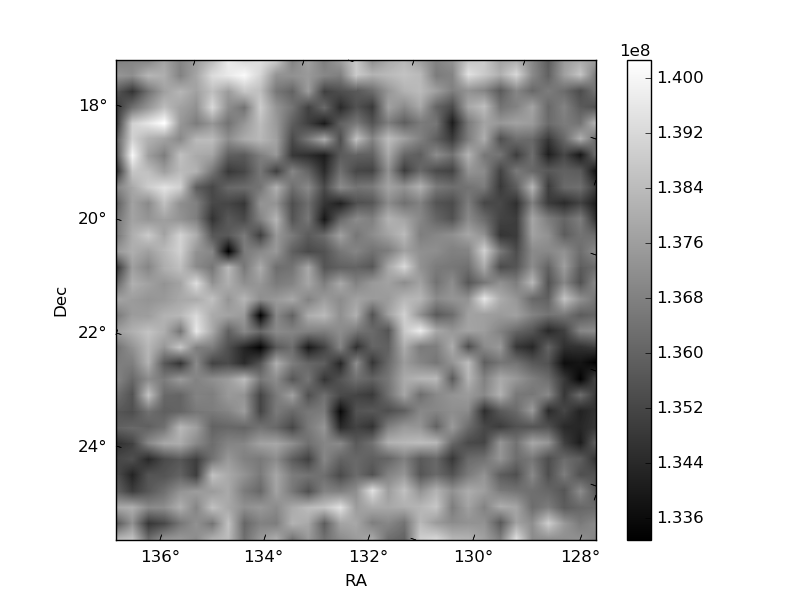
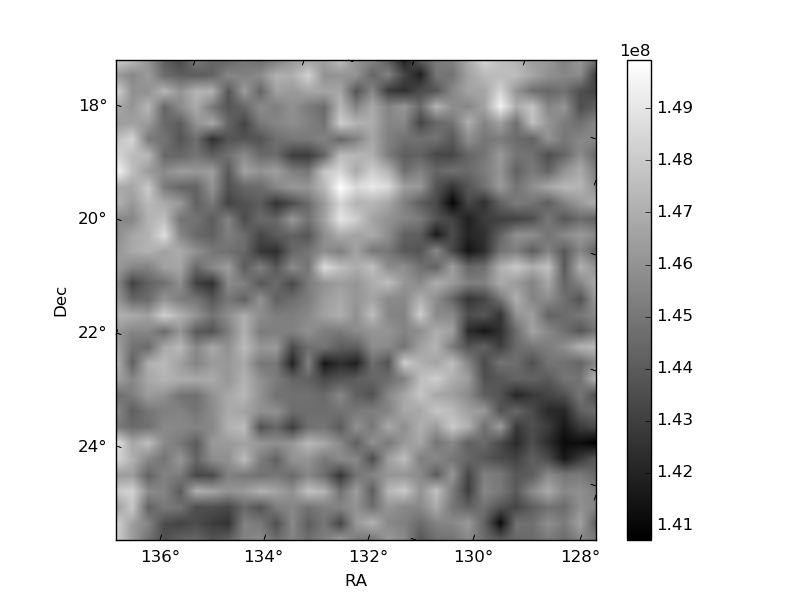
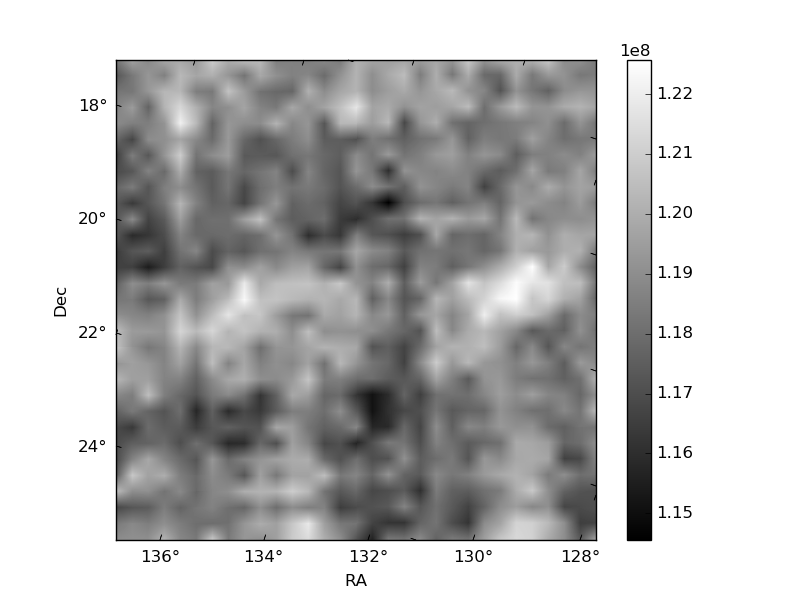
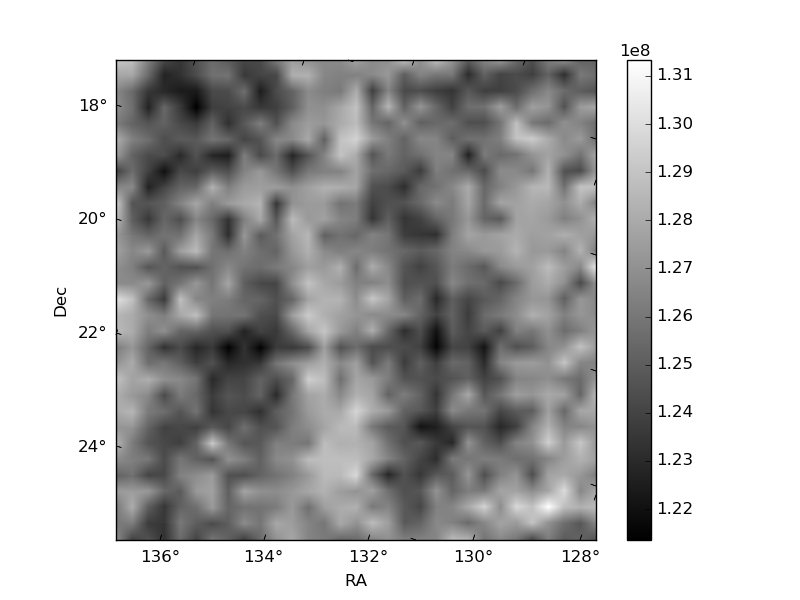
Histogram calculated using DETX and DETY for each event in the final _common_clean file
| Quadrant A | 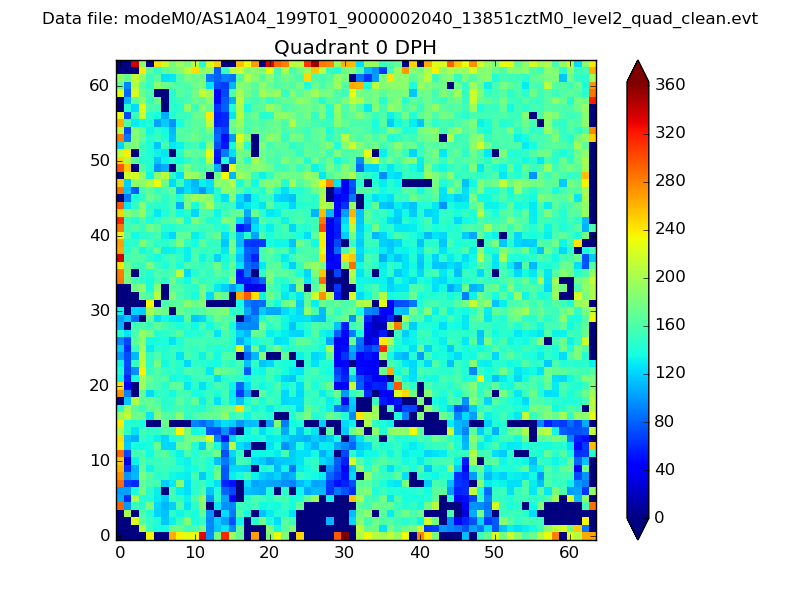 |
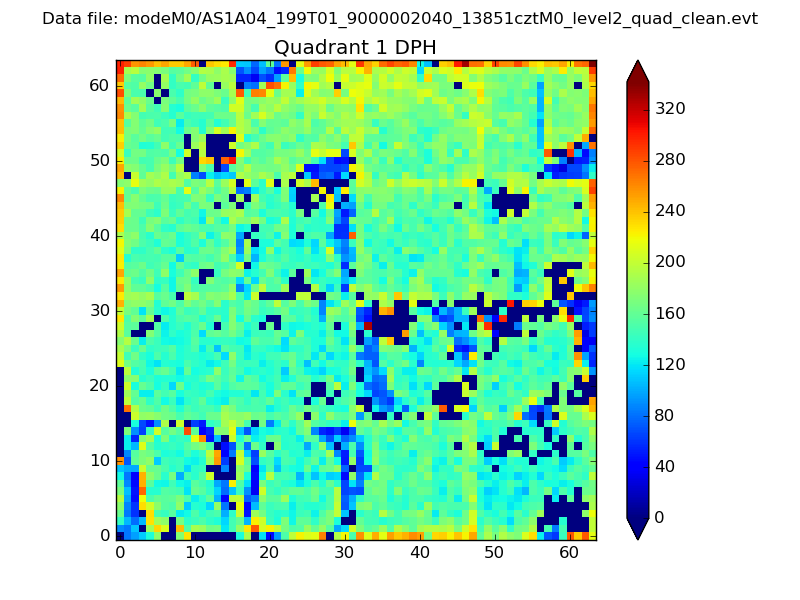 |
Quadrant B |
|---|---|---|---|
| Quadrant D | 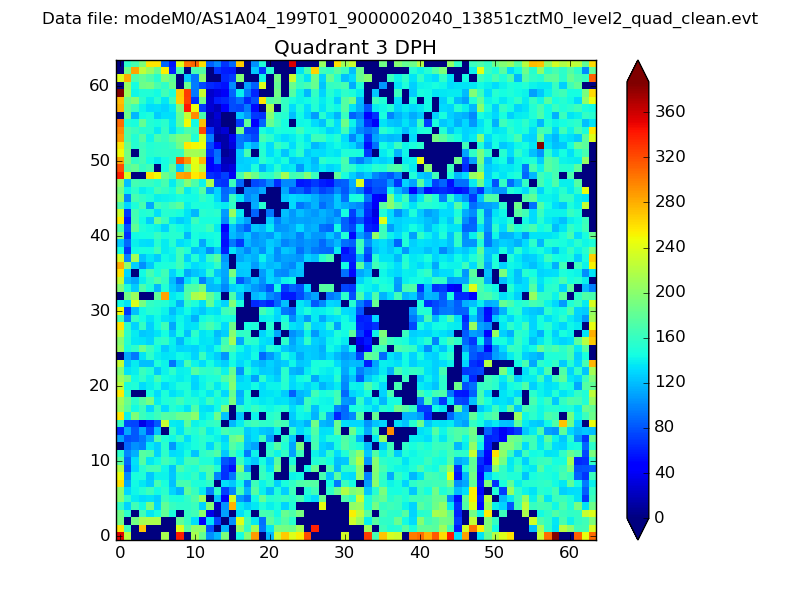 |
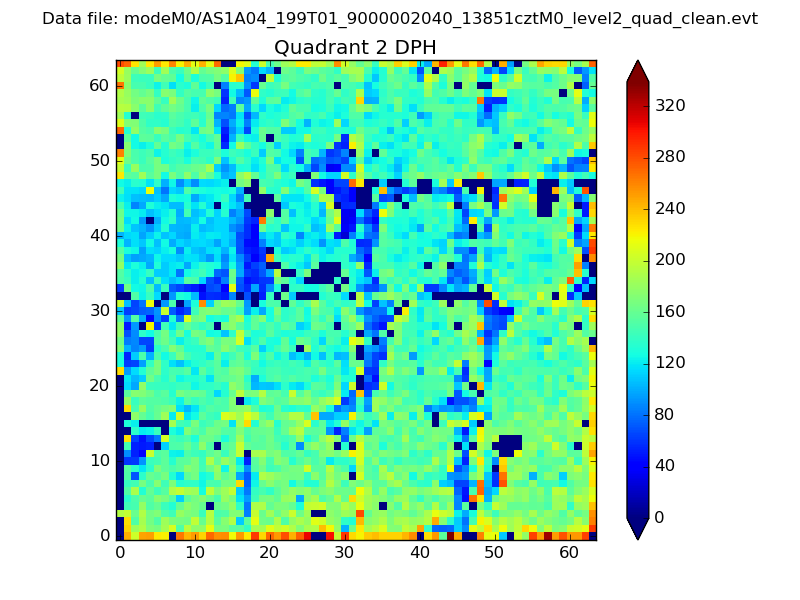 |
Quadrant C |
| Plot type | Count rate plots | Images |
|---|---|---|
| Comparison with Poisson distribution Blue bars denote a histogram of data divided into 1 sec bins. Red curve is a Poisson curve with rate = median count rate of data. |
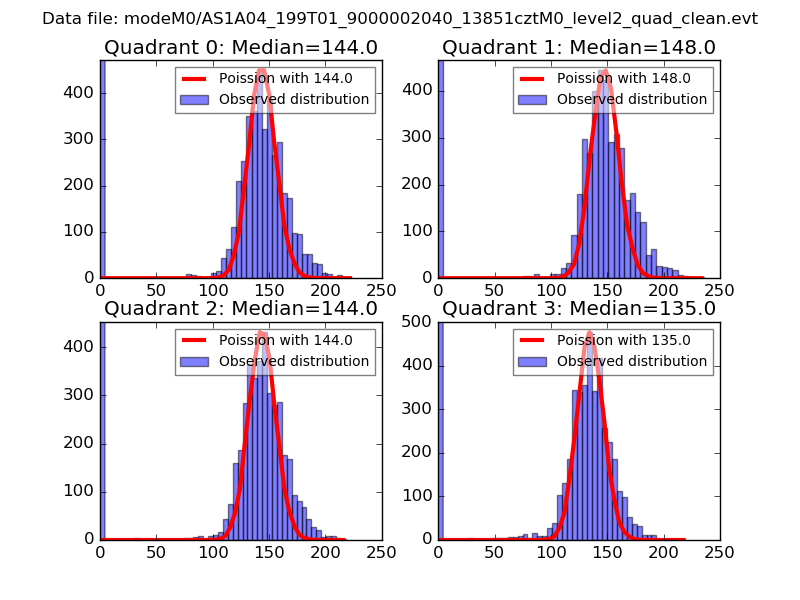 |
 |
| Quadrant-wise count rates Data is divided into 100 sec bins |
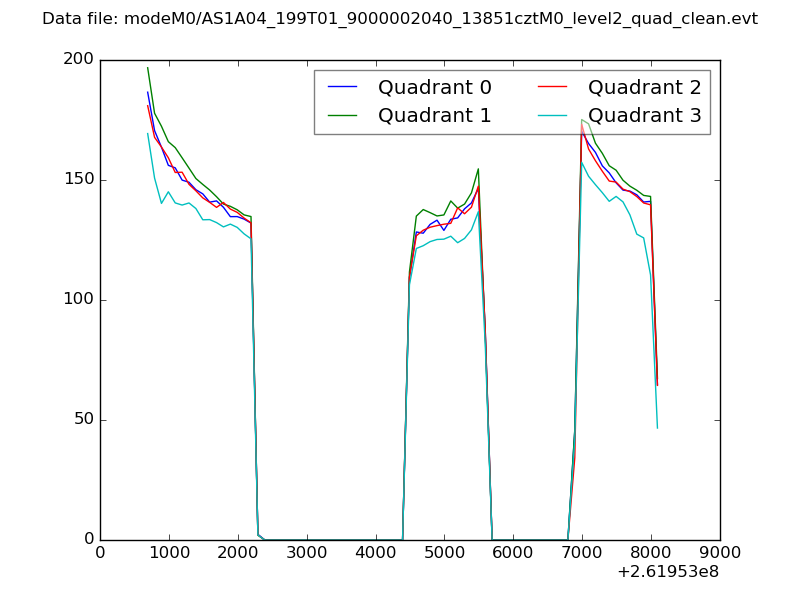 |
|
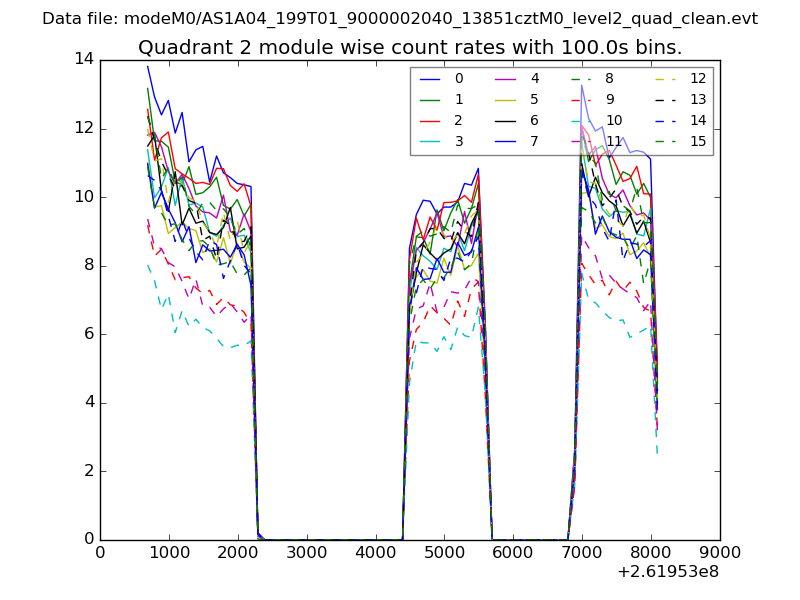
| Module-wise count rates for Quadrant A Data is divided into 100 sec bins |
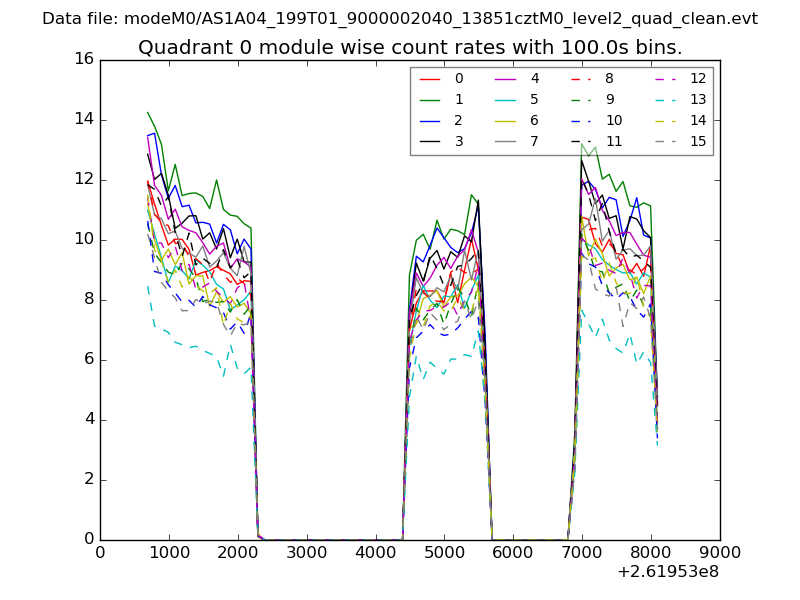 |
 |
| Module-wise count rates for Quadrant B Data is divided into 100 sec bins |
 |
 |
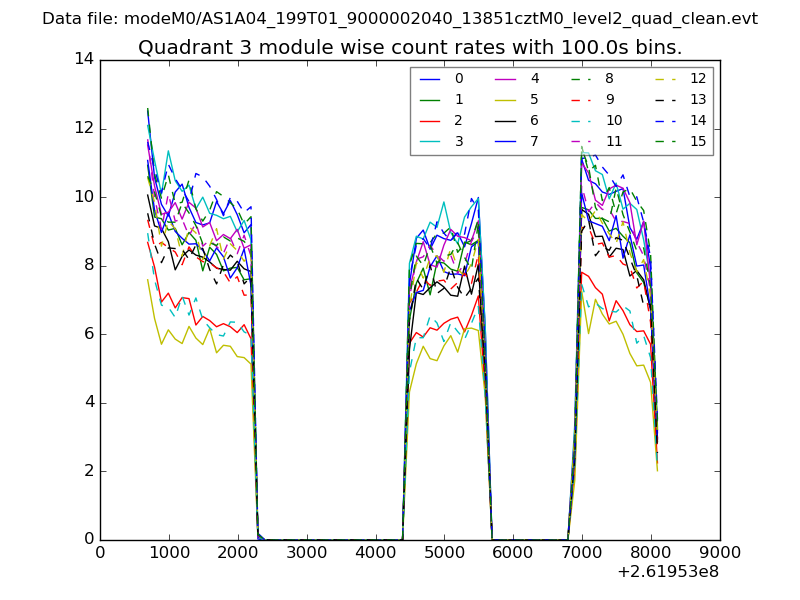
| Module-wise count rates for Quadrant C Data is divided into 100 sec bins |
 |
 |
| Module-wise count rates for Quadrant D Data is divided into 100 sec bins |
 |
 |
| Parameter | Plot |
|---|---|
| CZT HV Monitor | 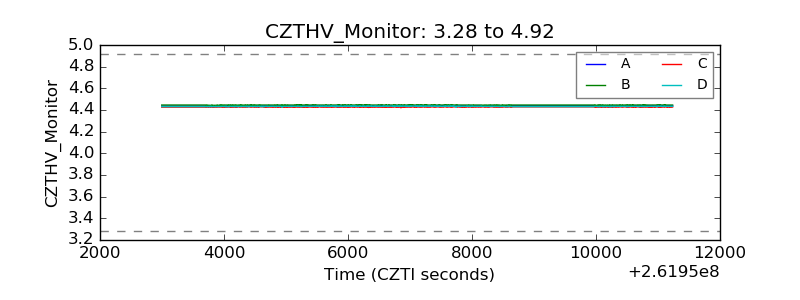 |
| D_VDD | 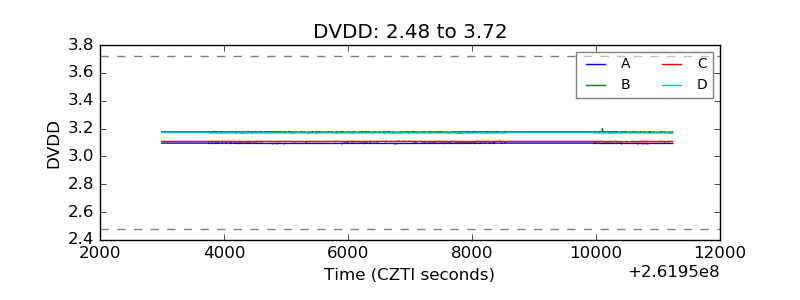 |
| Temperature 1 | 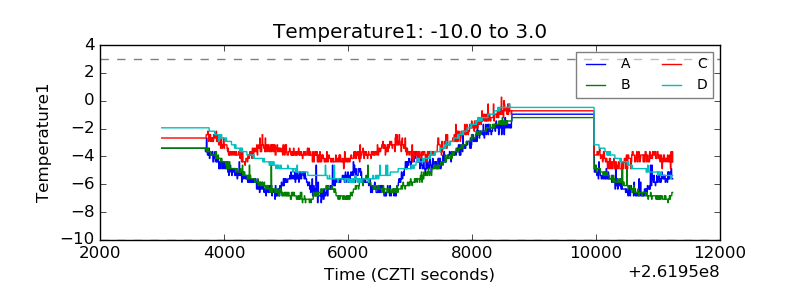 |
| Veto HV Monitor | 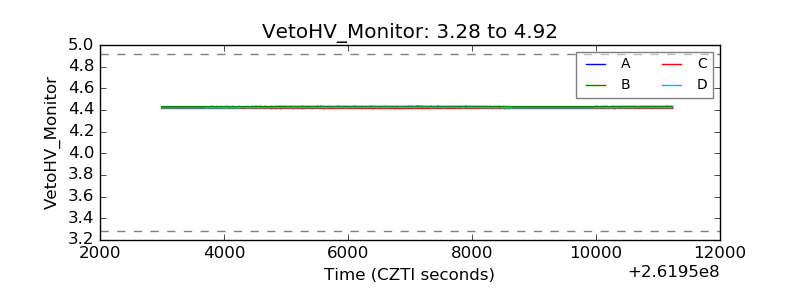 |
| Veto LLD | 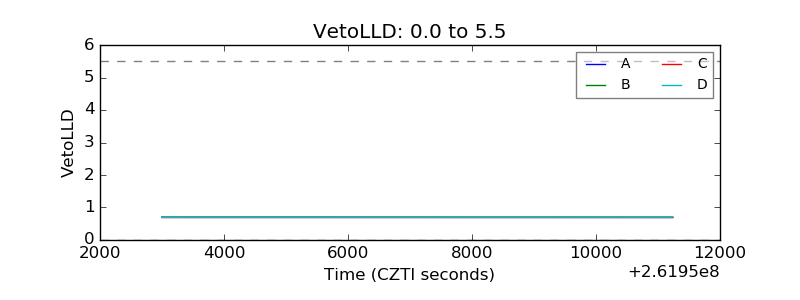 |
| Alpha Counter | 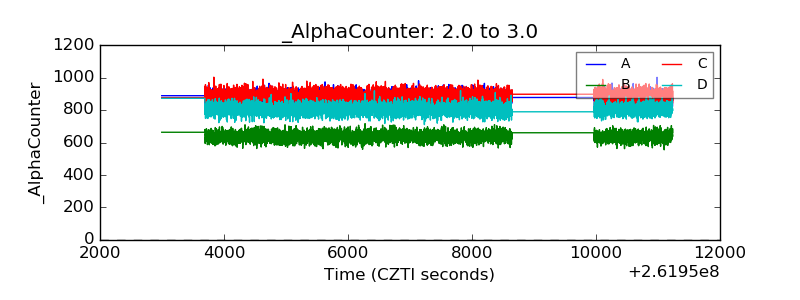 |
| _CPM_Rate | 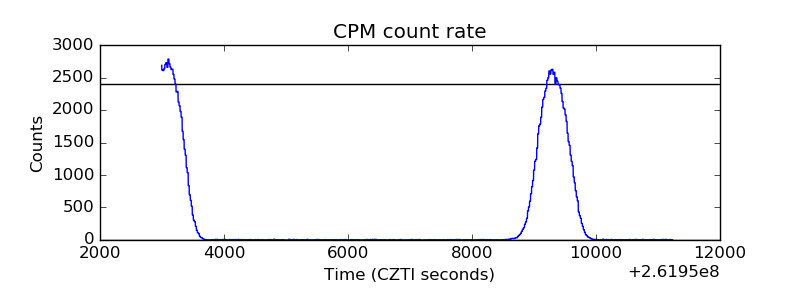 |
| CZT Counter |  |
| +2.5 Volts monitor |  |
| +5 Volts monitor |  |
| _ROLL_ROT | 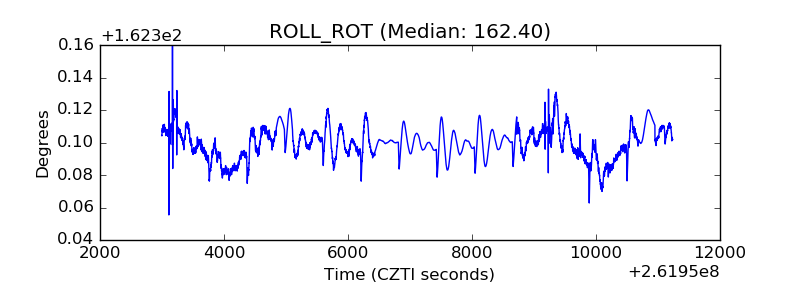 |
| _Roll_DEC | 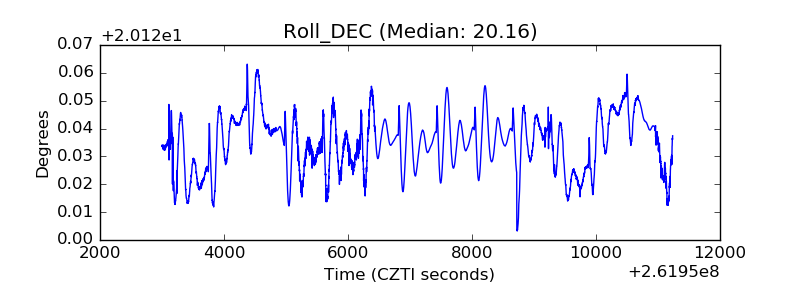 |
| _Roll_RA | 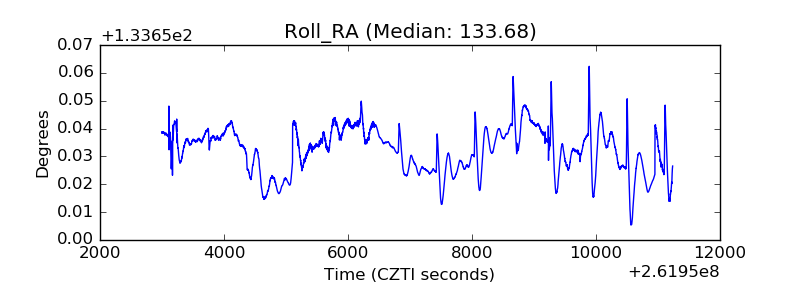 |
| Veto Counter | 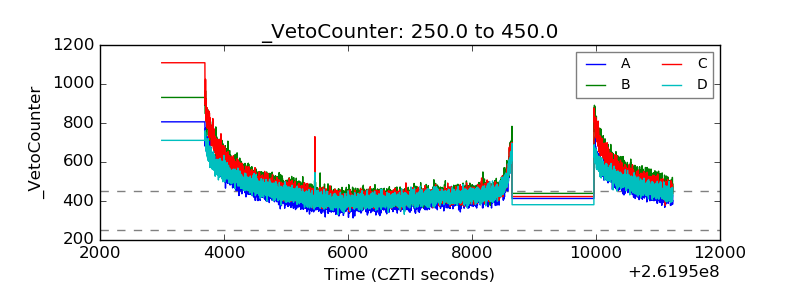 |