| Param | Original file | Final file |
|---|---|---|
| Filename | modeM0/AS1A04_199T01_9000002040_13853cztM0_level2.evt | modeM0/AS1A04_199T01_9000002040_13853cztM0_level2_quad_clean.evt |
| Size (bytes) | 448,899,840 | 72,103,680 |
| Size | 428.1 MB | 68.8 MB |
| Events in quadrant A | 3,195,904 | 440,863 |
| Events in quadrant B | 3,200,232 | 451,759 |
| Events in quadrant C | 3,051,731 | 436,377 |
| Events in quadrant D | 3,718,386 | 413,793 |
| Mode M9 | |||
|---|---|---|---|
| Quadrant | BADHDUFLAG | Total packets | Discarded packets |
| A | 0 | 19 | 0 |
| B | 0 | 19 | 0 |
| C | 0 | 19 | 0 |
| D | 0 | 20 | 0 |
| Mode SS | |||
|---|---|---|---|
| Quadrant | BADHDUFLAG | Total packets | Discarded packets |
| A | 0 | 128 | 0 |
| B | 0 | 128 | 0 |
| C | 0 | 128 | 0 |
| D | 0 | 128 | 0 |
| Mode M0 | |||
|---|---|---|---|
| Quadrant | BADHDUFLAG | Total packets | Discarded packets |
| A | 0 | 13405 | 3 |
| B | 0 | 13370 | 2 |
| C | 0 | 12991 | 2 |
| D | 0 | 15120 | 2 |
| Quadrant | Total seconds | Saturated seconds | Saturation percentage |
|---|---|---|---|
| A | 6310 | 65 | 1.030111% |
| B | 6310 | 45 | 0.713154% |
| C | 6310 | 25 | 0.396197% |
| D | 6310 | 98 | 1.553090% |
Noise dominated data is calculated using 1-second bins in cleaned event files. If a bin has >2000 counts, and if more than 50% of those come from <1% of pixels, then it is considered to be noise-dominated and hence unusable.
| Quadrant | # 1 sec bins | Bins with >0 counts | Bins with >2000 counts | High rate bins dominated by noise | Noise dominated (total time) | Noise dominated (detector-on time) | Marked lightcurve |
|---|---|---|---|---|---|---|---|
| A | 7521 | 6313 | 29 | 29 | 0.39% | 0.46% | 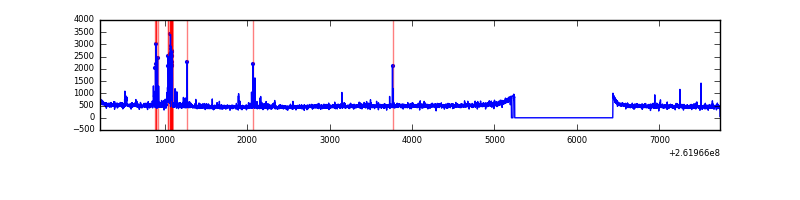 |
| B | 7521 | 6311 | 4 | 4 | 0.05% | 0.06% | 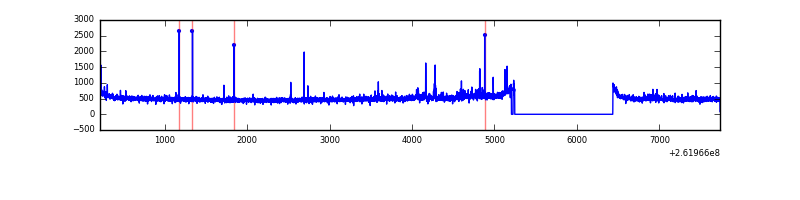 |
| C | 7521 | 6313 | 3 | 3 | 0.04% | 0.05% | 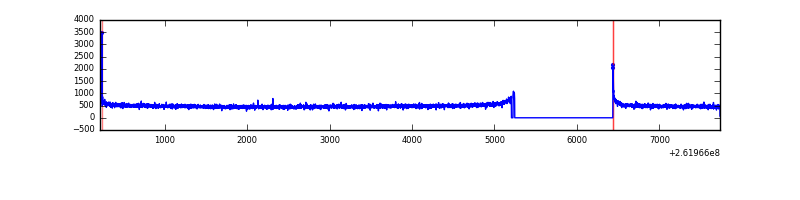 |
| D | 7521 | 6313 | 80 | 80 | 1.06% | 1.27% | 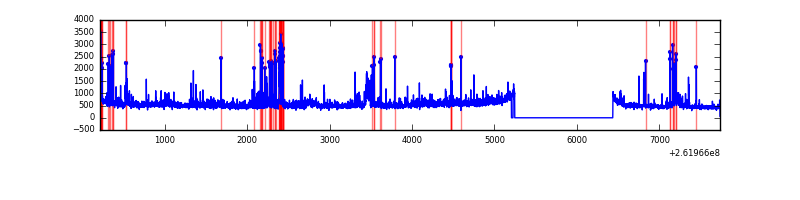 |
Top three noisy pixels from each quadrant. If the there are fewer than three noisy pixels in the level2.evt file, extra rows are filled as -1
| Pixel properties | Quadrant properties | ||||||
|---|---|---|---|---|---|---|---|
| Quadrant | DetID | PixID | Counts | Sigma | Mean | Median | Sigma |
| A | 9 | 143 | 170182 | 1061.83 | 782 | 766 | 159.6 |
| A | 8 | 15 | 10253 | 59.46 | 782 | 766 | 159.6 |
| A | 1 | 162 | 8055 | 45.68 | 782 | 766 | 159.6 |
| B | 0 | 219 | 43718 | 289.28 | 786 | 766 | 148.5 |
| B | 3 | 209 | 34624 | 228.03 | 786 | 766 | 148.5 |
| B | 0 | 214 | 26562 | 173.73 | 786 | 766 | 148.5 |
| C | 3 | 233 | 94957 | 536.89 | 757 | 761 | 175.4 |
| C | 6 | 253 | 8174 | 42.25 | 757 | 761 | 175.4 |
| C | 13 | 61 | 5446 | 26.7 | 757 | 761 | 175.4 |
| D | 1 | 52 | 212264 | 1192.42 | 741 | 725 | 177.4 |
| D | 13 | 189 | 199789 | 1122.1 | 741 | 725 | 177.4 |
| D | 10 | 157 | 191266 | 1074.06 | 741 | 725 | 177.4 |
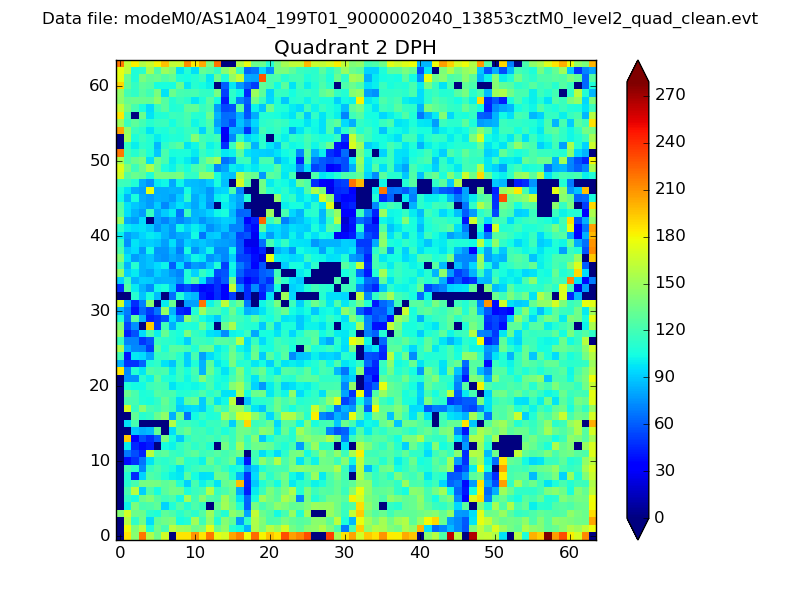
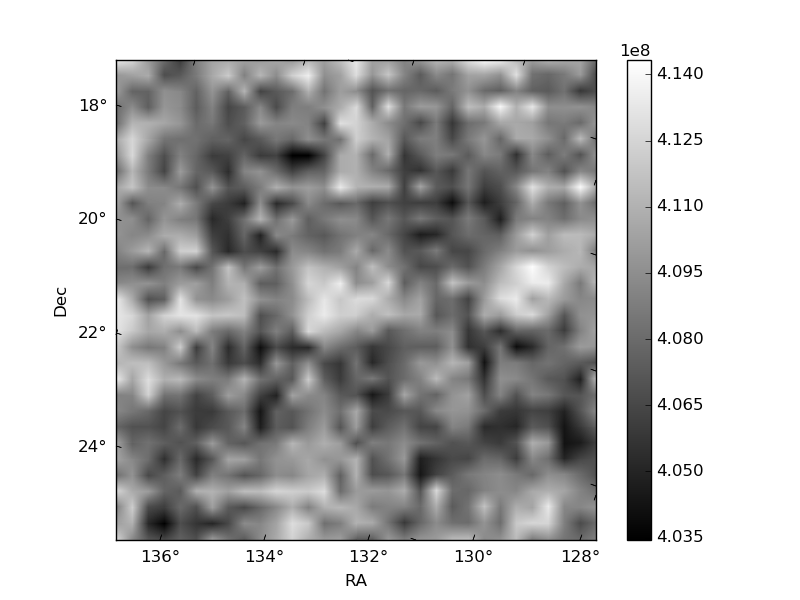
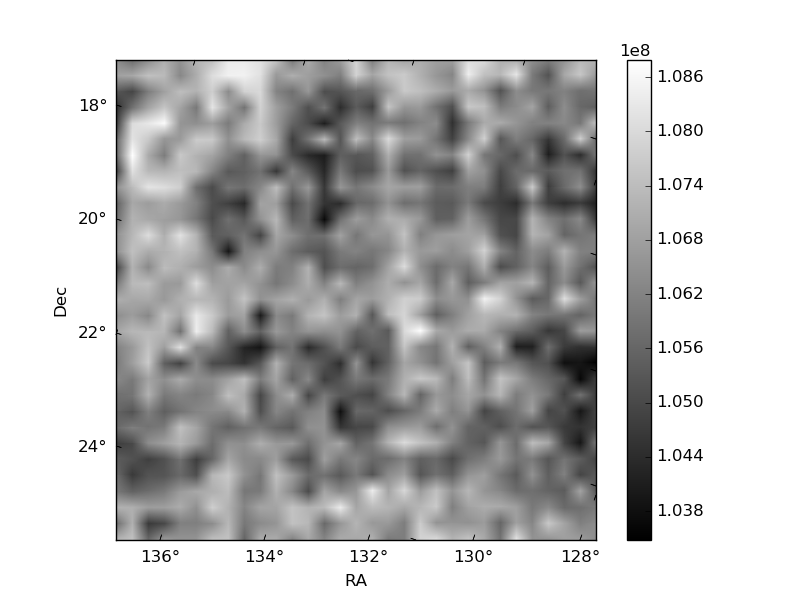
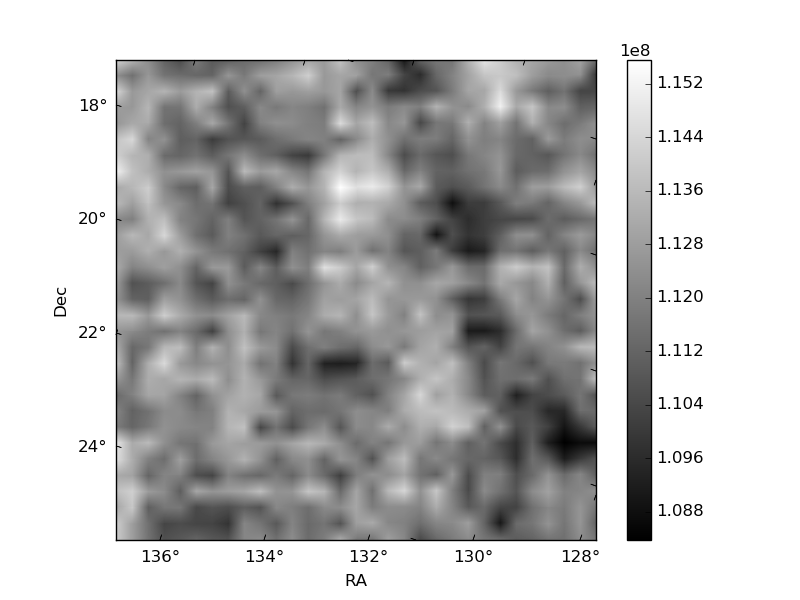
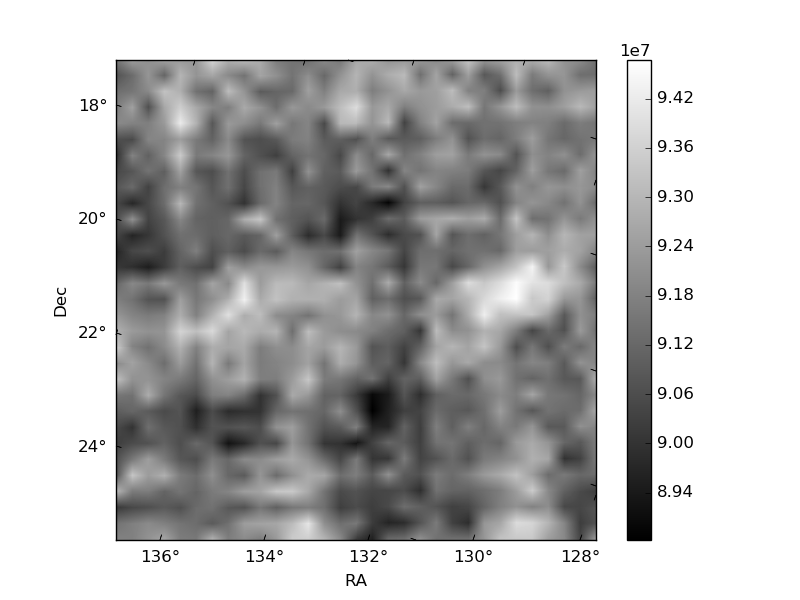
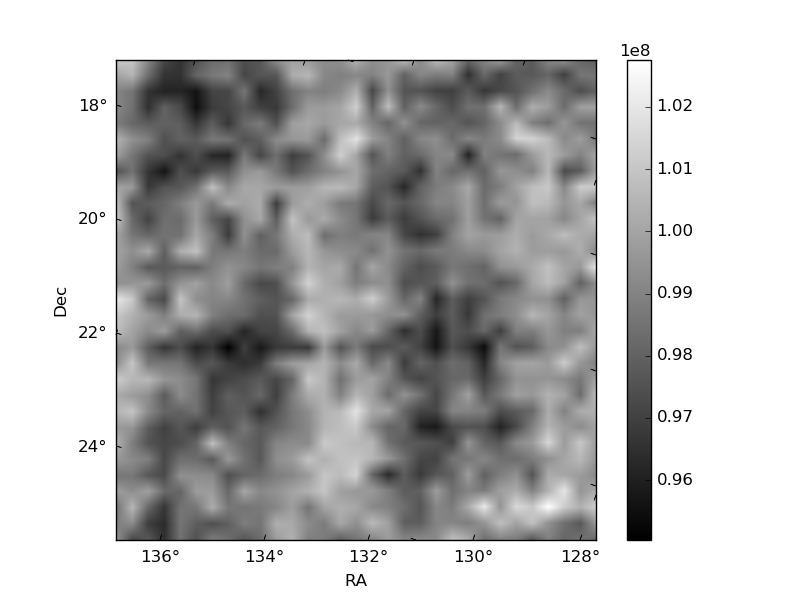
Histogram calculated using DETX and DETY for each event in the final _common_clean file
| Quadrant A | 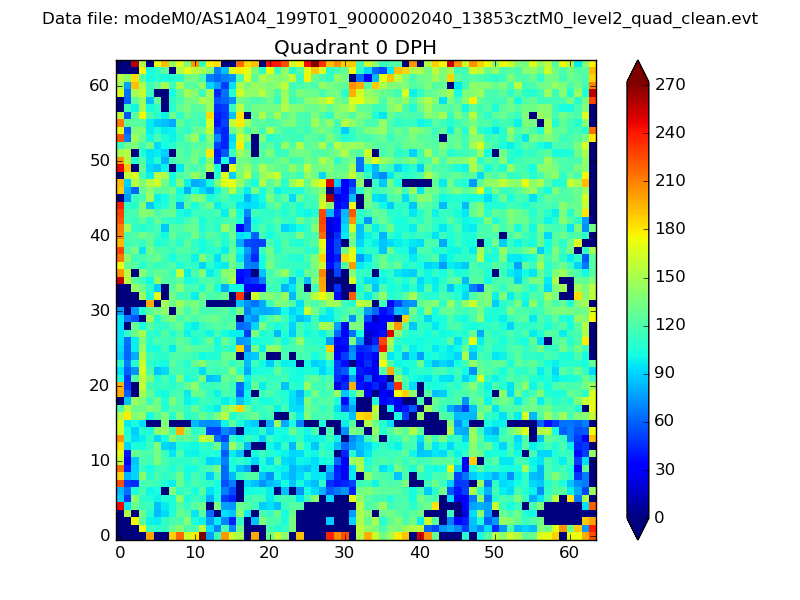 |
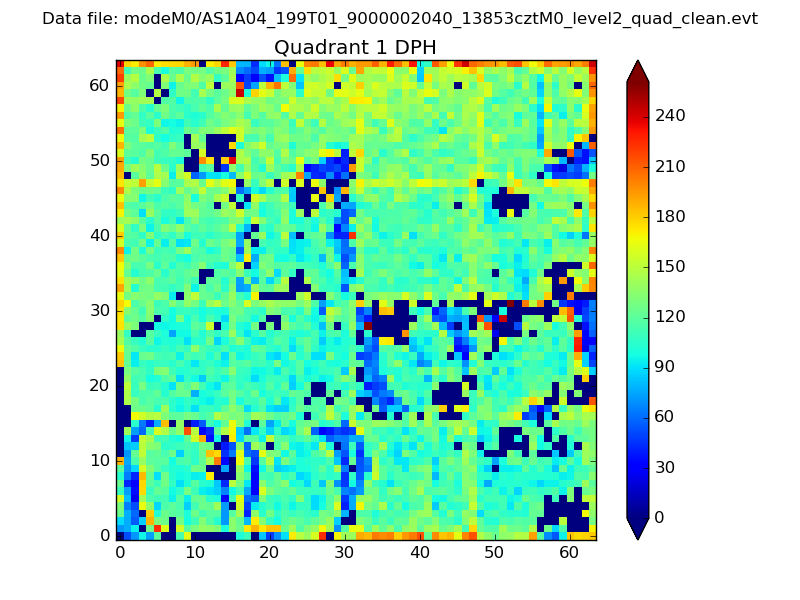 |
Quadrant B |
|---|---|---|---|
| Quadrant D | 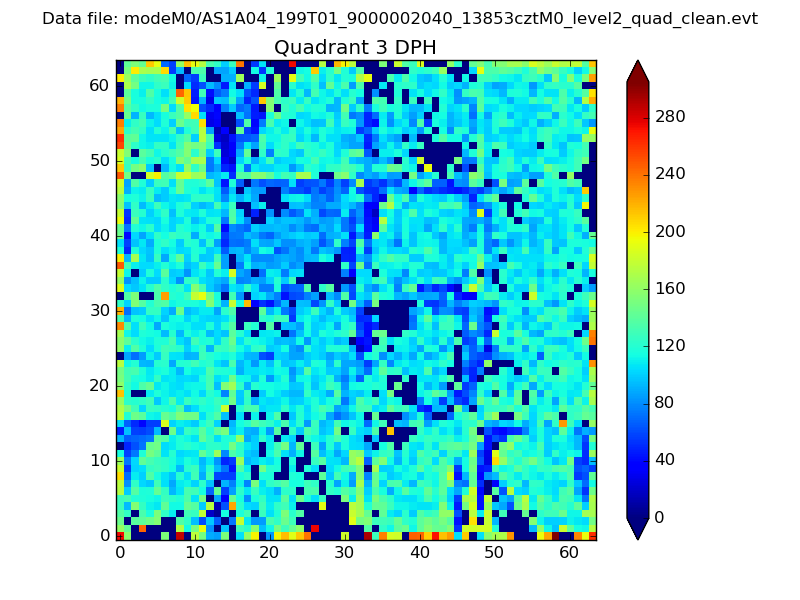 |
 |
Quadrant C |
| Plot type | Count rate plots | Images |
|---|---|---|
| Comparison with Poisson distribution Blue bars denote a histogram of data divided into 1 sec bins. Red curve is a Poisson curve with rate = median count rate of data. |
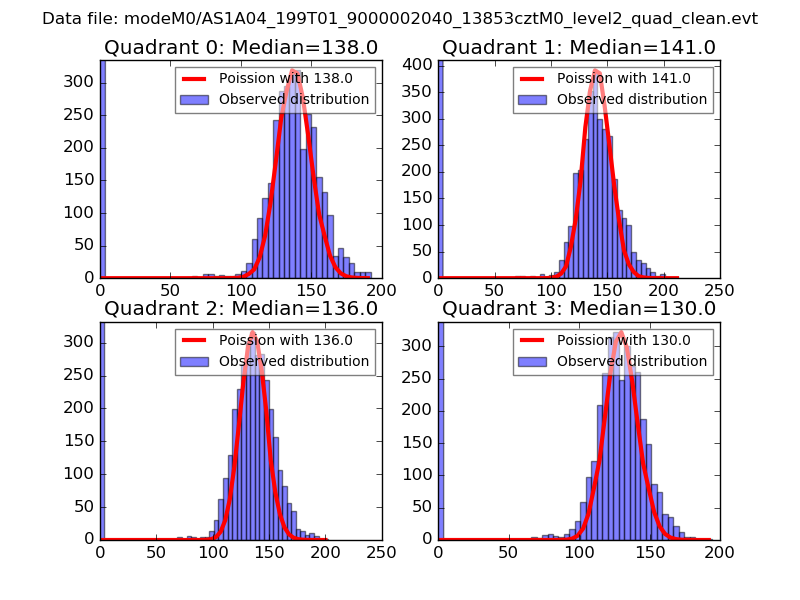 |
 |
| Quadrant-wise count rates Data is divided into 100 sec bins |
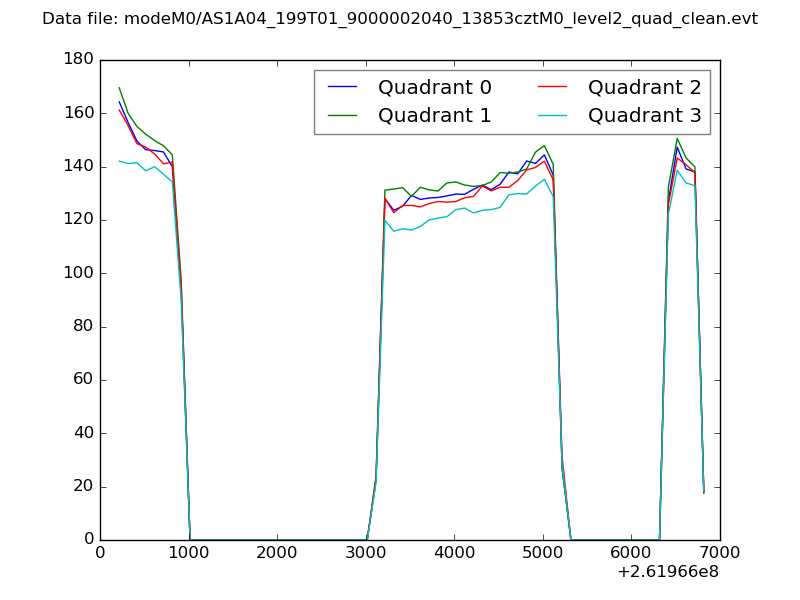 |
|
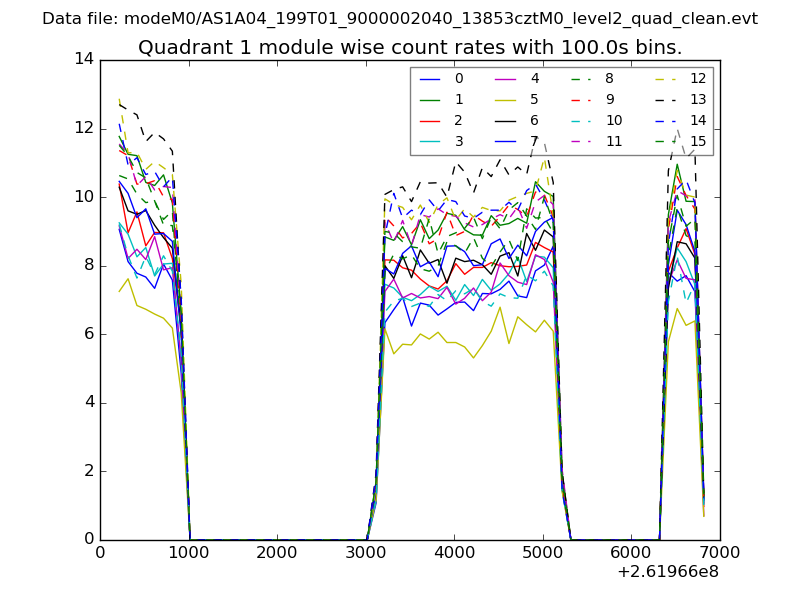
| Module-wise count rates for Quadrant A Data is divided into 100 sec bins |
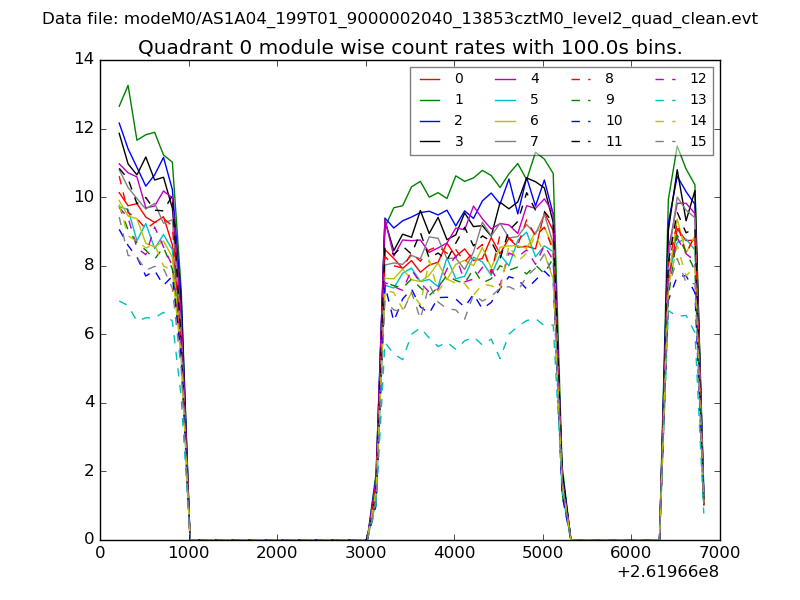 |
 |
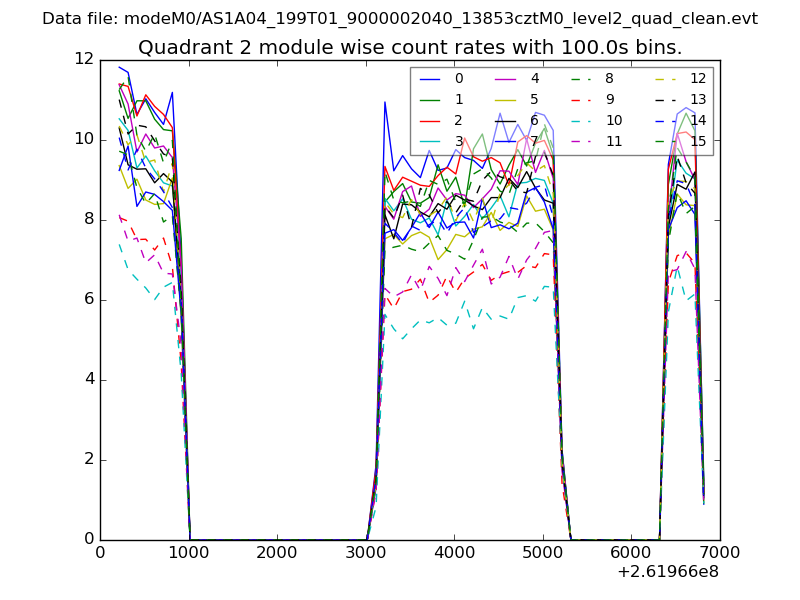
| Module-wise count rates for Quadrant B Data is divided into 100 sec bins |
 |
 |
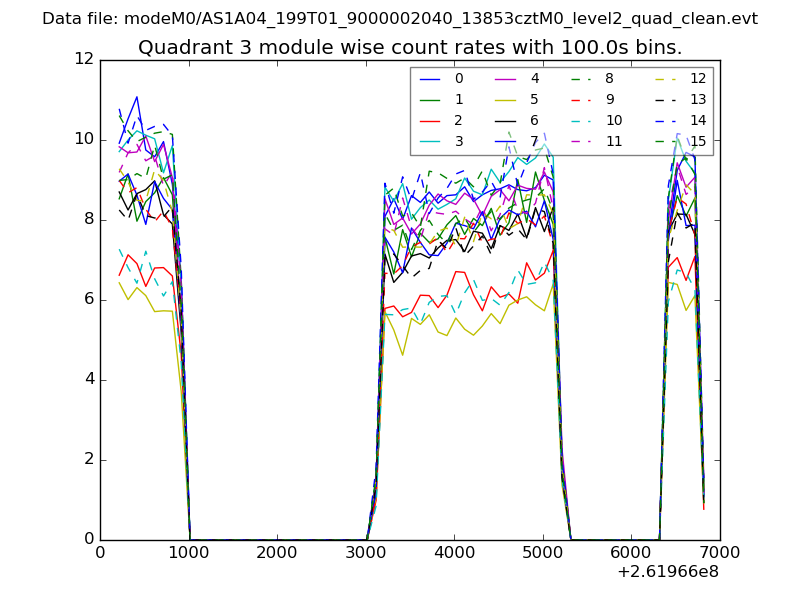
| Module-wise count rates for Quadrant C Data is divided into 100 sec bins |
 |
 |
| Module-wise count rates for Quadrant D Data is divided into 100 sec bins |
 |
 |
| Parameter | Plot |
|---|---|
| CZT HV Monitor |  |
| D_VDD | 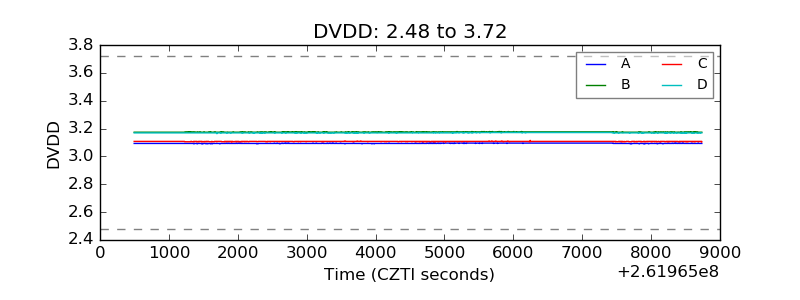 |
| Temperature 1 | 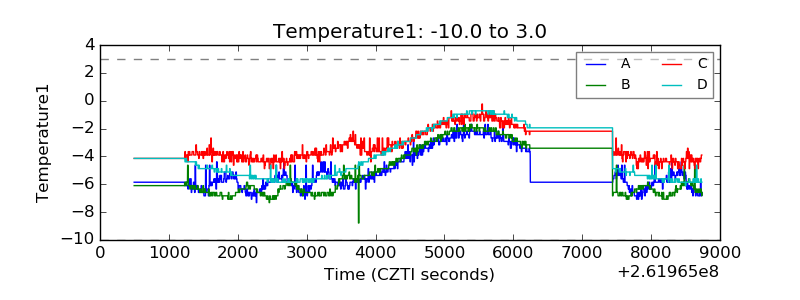 |
| Veto HV Monitor | 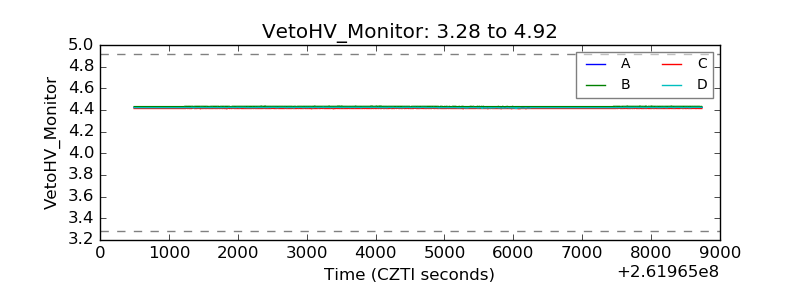 |
| Veto LLD | 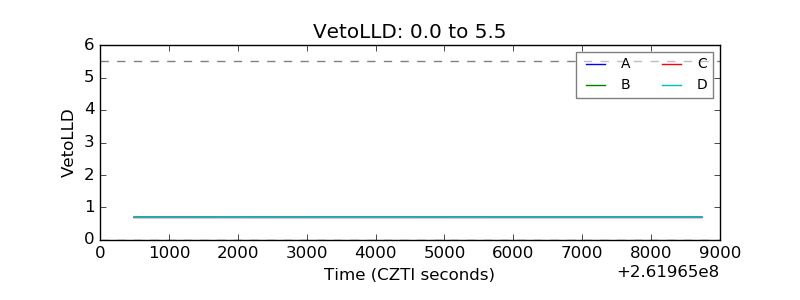 |
| Alpha Counter | 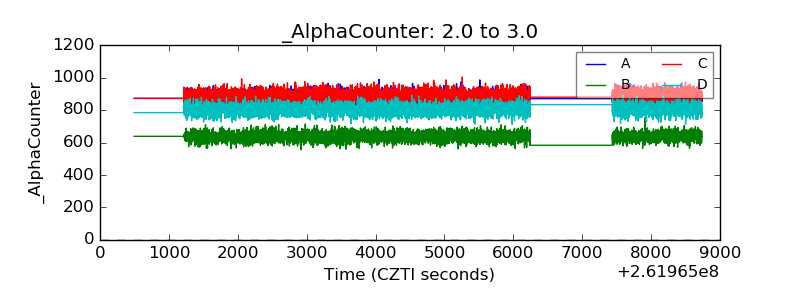 |
| _CPM_Rate | 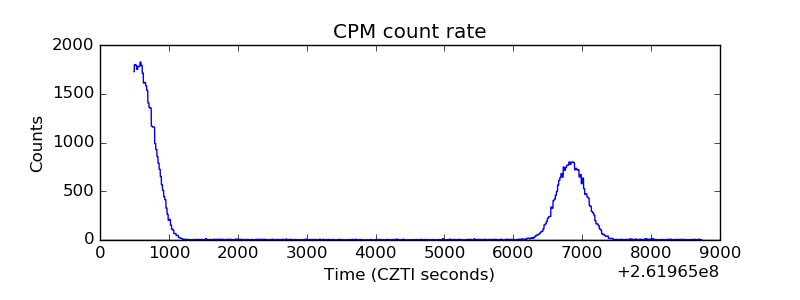 |
| CZT Counter | 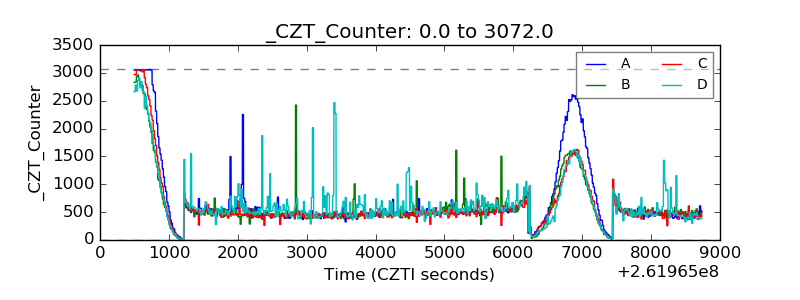 |
| +2.5 Volts monitor |  |
| +5 Volts monitor |  |
| _ROLL_ROT | 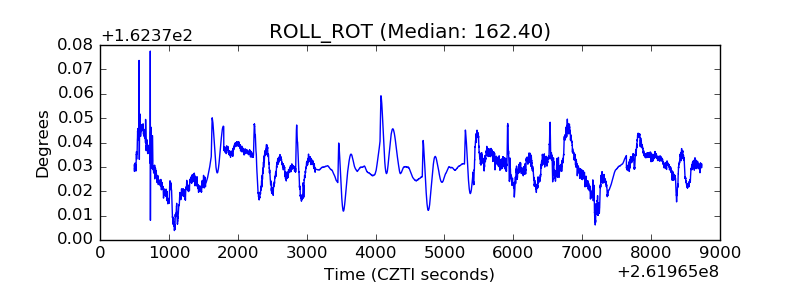 |
| _Roll_DEC |  |
| _Roll_RA | 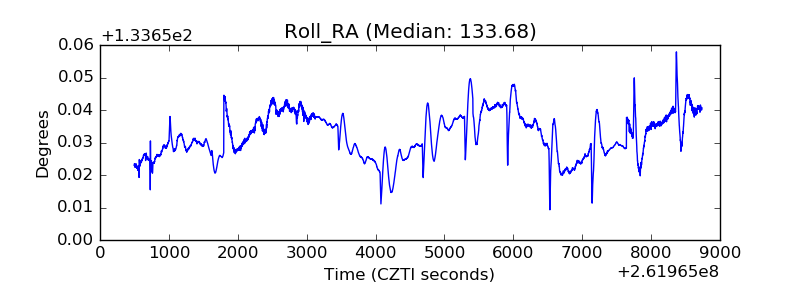 |
| Veto Counter |  |