| Param | Original file | Final file |
|---|---|---|
| Filename | modeM0/AS1A04_199T01_9000002040_13856cztM0_level2.evt | modeM0/AS1A04_199T01_9000002040_13856cztM0_level2_quad_clean.evt |
| Size (bytes) | 384,465,600 | 65,427,840 |
| Size | 366.7 MB | 62.4 MB |
| Events in quadrant A | 2,444,248 | 408,501 |
| Events in quadrant B | 2,524,190 | 411,833 |
| Events in quadrant C | 2,508,799 | 406,981 |
| Events in quadrant D | 3,809,081 | 386,151 |
| Mode M9 | |||
|---|---|---|---|
| Quadrant | BADHDUFLAG | Total packets | Discarded packets |
| A | 0 | 4 | 0 |
| B | 0 | 4 | 0 |
| C | 0 | 4 | 0 |
| D | 0 | 4 | 0 |
| Mode SS | |||
|---|---|---|---|
| Quadrant | BADHDUFLAG | Total packets | Discarded packets |
| A | 0 | 108 | 0 |
| B | 0 | 108 | 0 |
| C | 0 | 108 | 0 |
| D | 0 | 108 | 0 |
| Mode M0 | |||
|---|---|---|---|
| Quadrant | BADHDUFLAG | Total packets | Discarded packets |
| A | 0 | 10865 | 1 |
| B | 0 | 10935 | 1 |
| C | 0 | 10936 | 1 |
| D | 0 | 14855 | 1 |
| Quadrant | Total seconds | Saturated seconds | Saturation percentage |
|---|---|---|---|
| A | 5244 | 134 | 2.555301% |
| B | 5244 | 156 | 2.974828% |
| C | 5244 | 101 | 1.926011% |
| D | 5244 | 230 | 4.385965% |
Noise dominated data is calculated using 1-second bins in cleaned event files. If a bin has >2000 counts, and if more than 50% of those come from <1% of pixels, then it is considered to be noise-dominated and hence unusable.
| Quadrant | # 1 sec bins | Bins with >0 counts | Bins with >2000 counts | High rate bins dominated by noise | Noise dominated (total time) | Noise dominated (detector-on time) | Marked lightcurve |
|---|---|---|---|---|---|---|---|
| A | 5715 | 5245 | 0 | 0 | 0.00% | 0.00% | 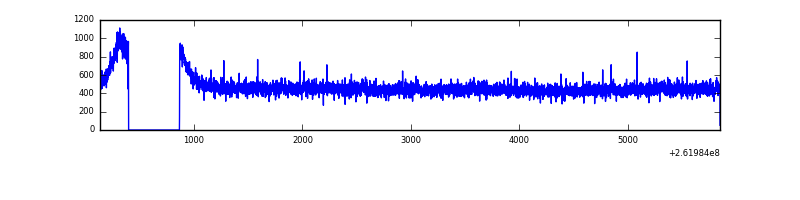 |
| B | 5715 | 5245 | 1 | 1 | 0.02% | 0.02% | 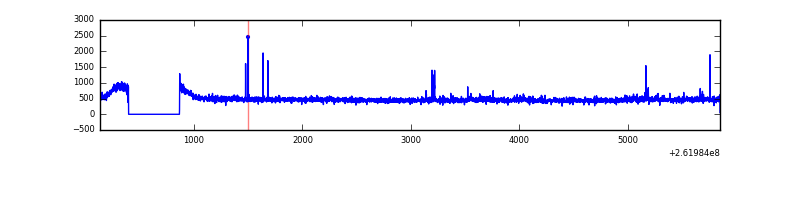 |
| C | 5715 | 5245 | 0 | 0 | 0.00% | 0.00% | 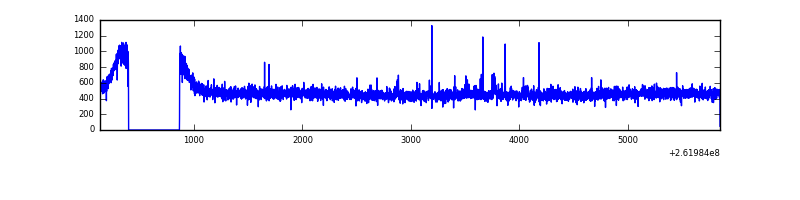 |
| D | 5715 | 5245 | 127 | 127 | 2.22% | 2.42% | 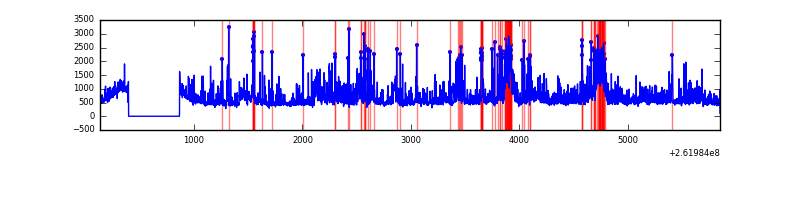 |
Top three noisy pixels from each quadrant. If the there are fewer than three noisy pixels in the level2.evt file, extra rows are filled as -1
| Pixel properties | Quadrant properties | ||||||
|---|---|---|---|---|---|---|---|
| Quadrant | DetID | PixID | Counts | Sigma | Mean | Median | Sigma |
| A | 8 | 15 | 9096 | 64.21 | 632 | 616 | 132.1 |
| A | 0 | 226 | 5772 | 39.04 | 632 | 616 | 132.1 |
| A | 1 | 162 | 5186 | 34.6 | 632 | 616 | 132.1 |
| B | 0 | 219 | 30721 | 242.88 | 628 | 612 | 124.0 |
| B | 4 | 80 | 16977 | 132.01 | 628 | 612 | 124.0 |
| B | 12 | 111 | 14903 | 115.28 | 628 | 612 | 124.0 |
| C | 3 | 233 | 116663 | 804.55 | 613 | 616 | 144.2 |
| C | 13 | 61 | 4248 | 25.18 | 613 | 616 | 144.2 |
| C | 14 | 220 | 2199 | 10.97 | 613 | 616 | 144.2 |
| D | 13 | 122 | 618230 | 4125.31 | 608 | 594 | 149.7 |
| D | 10 | 157 | 335471 | 2236.71 | 608 | 594 | 149.7 |
| D | 1 | 52 | 252313 | 1681.28 | 608 | 594 | 149.7 |
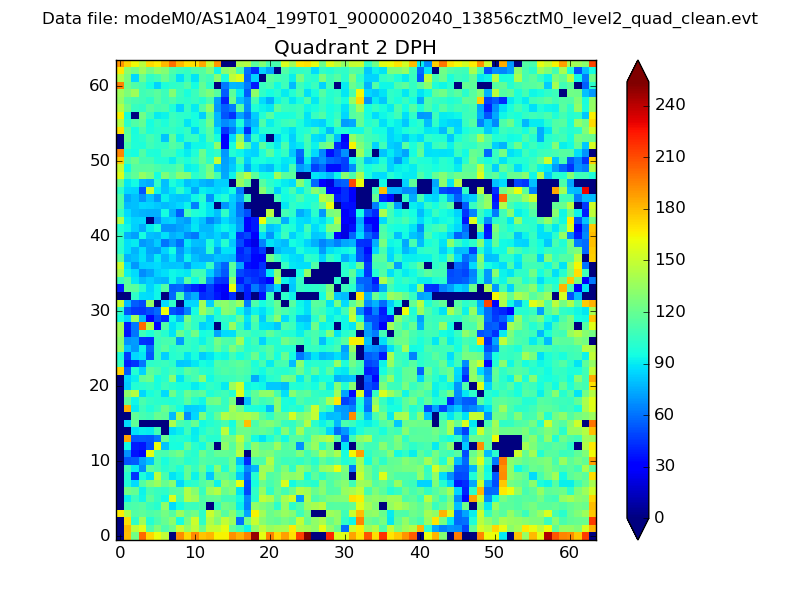
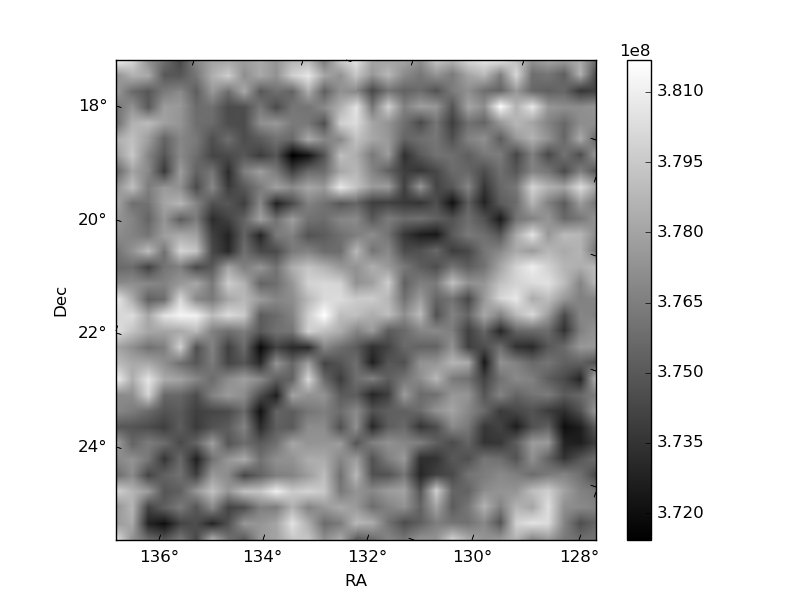
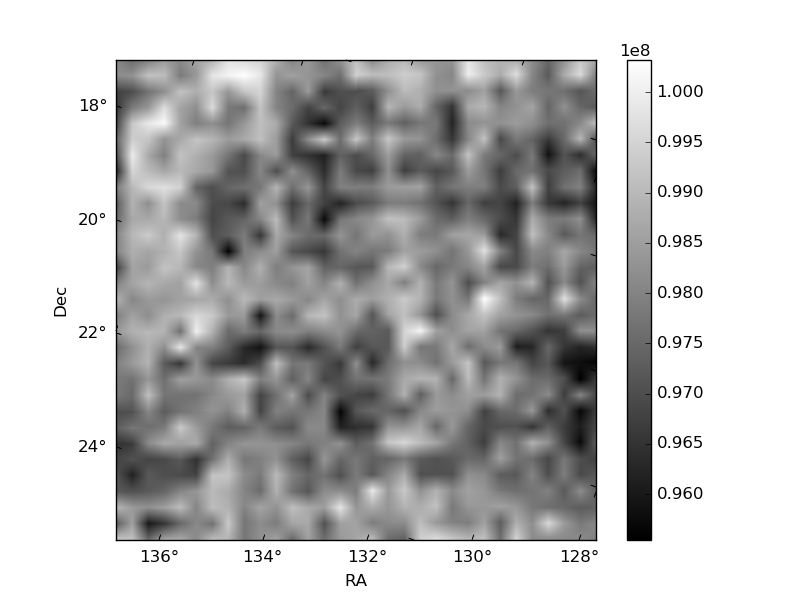
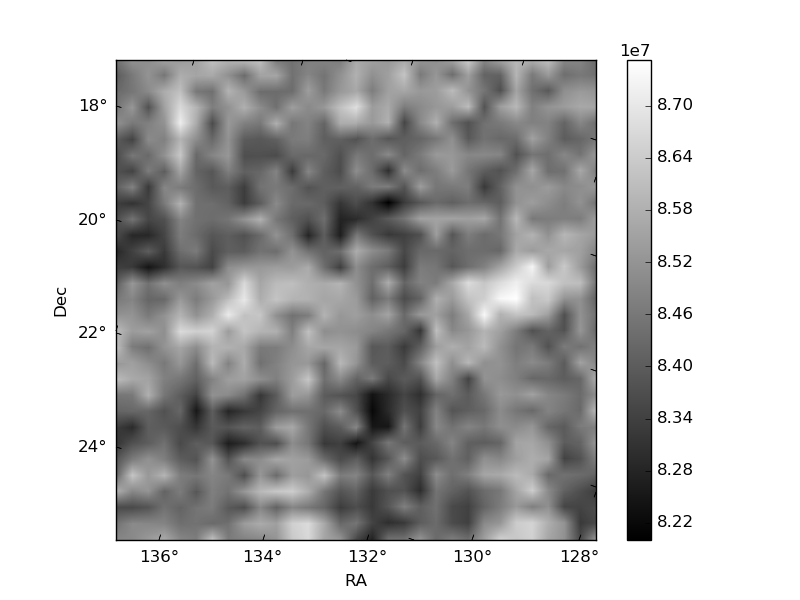
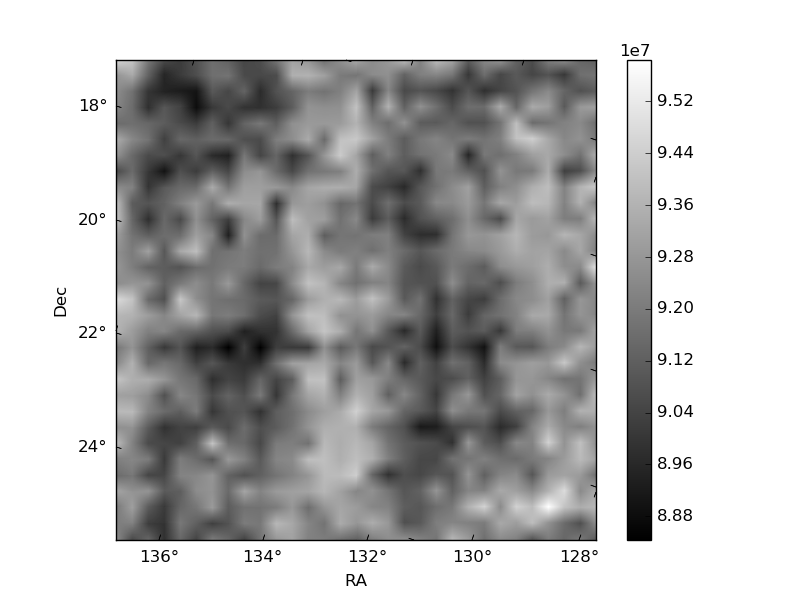
Histogram calculated using DETX and DETY for each event in the final _common_clean file
| Quadrant A | 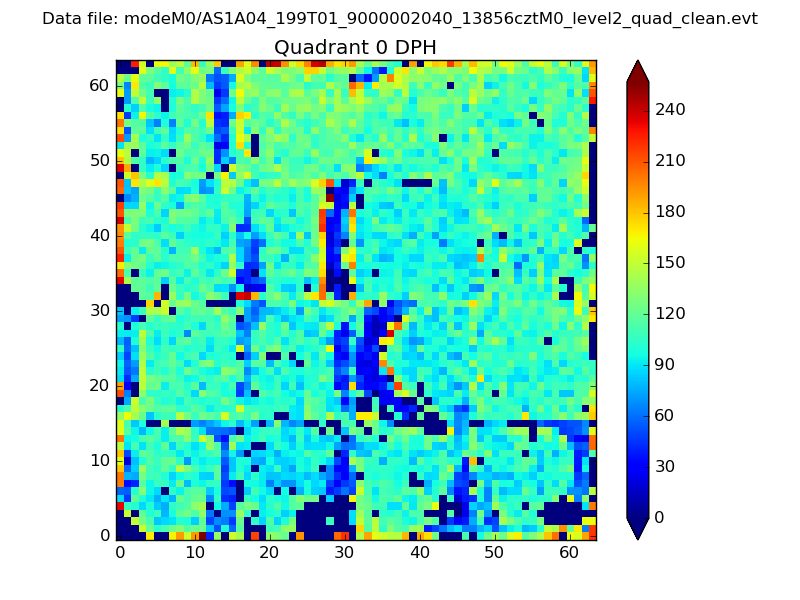 |
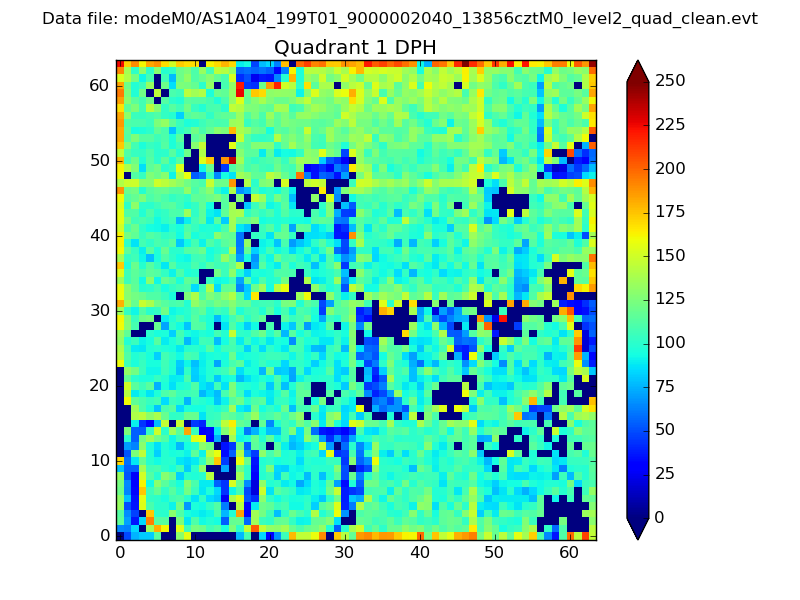 |
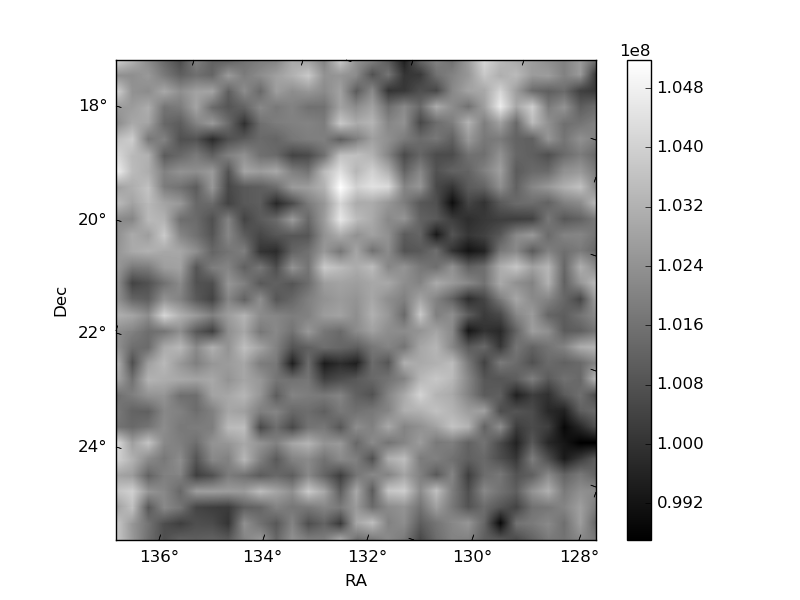
Quadrant B |
|---|---|---|---|
| Quadrant D | 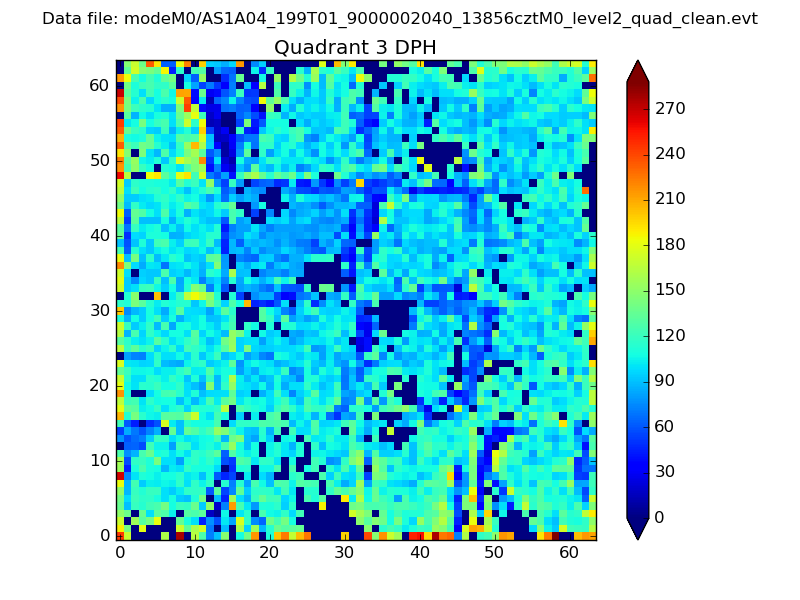 |
 |
Quadrant C |
| Plot type | Count rate plots | Images |
|---|---|---|
| Comparison with Poisson distribution Blue bars denote a histogram of data divided into 1 sec bins. Red curve is a Poisson curve with rate = median count rate of data. |
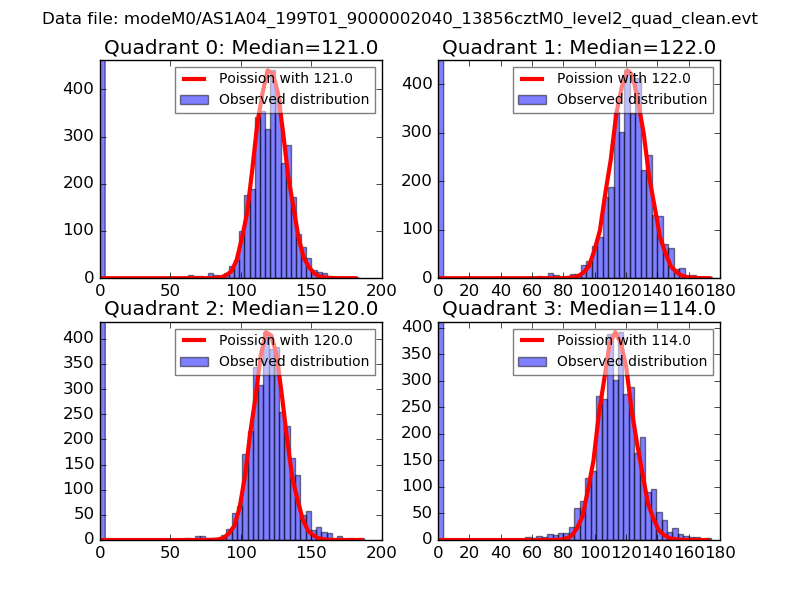 |
 |
| Quadrant-wise count rates Data is divided into 100 sec bins |
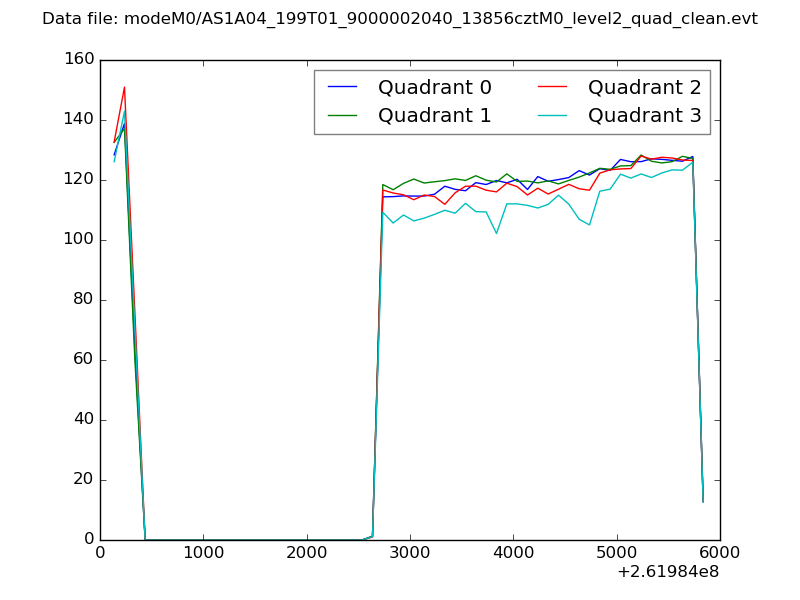 |
|
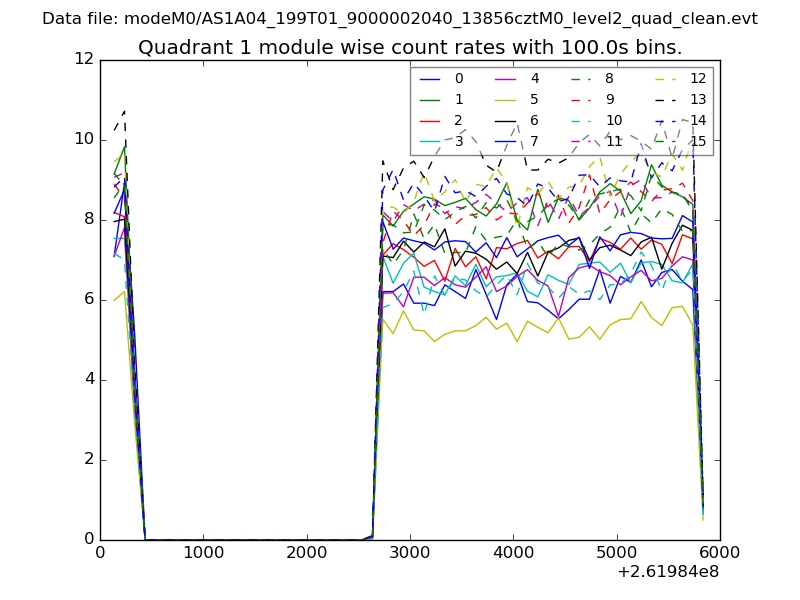
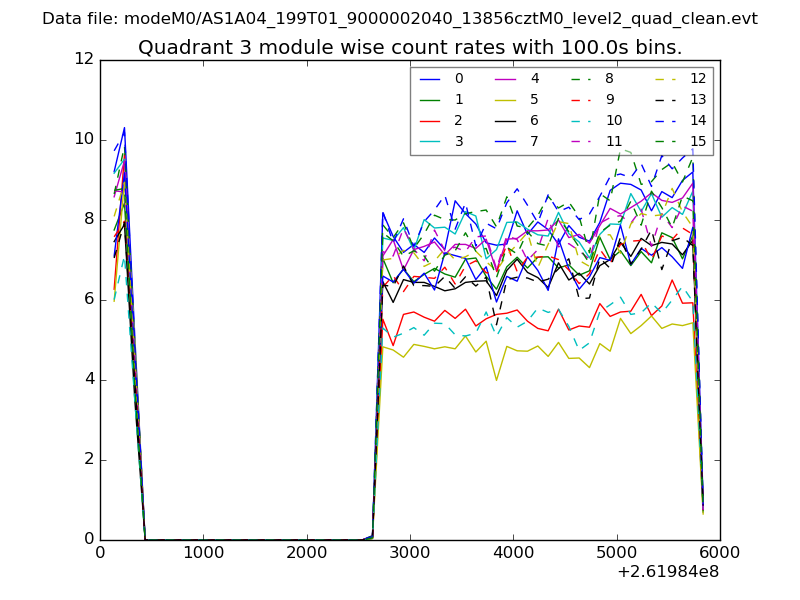
| Module-wise count rates for Quadrant A Data is divided into 100 sec bins |
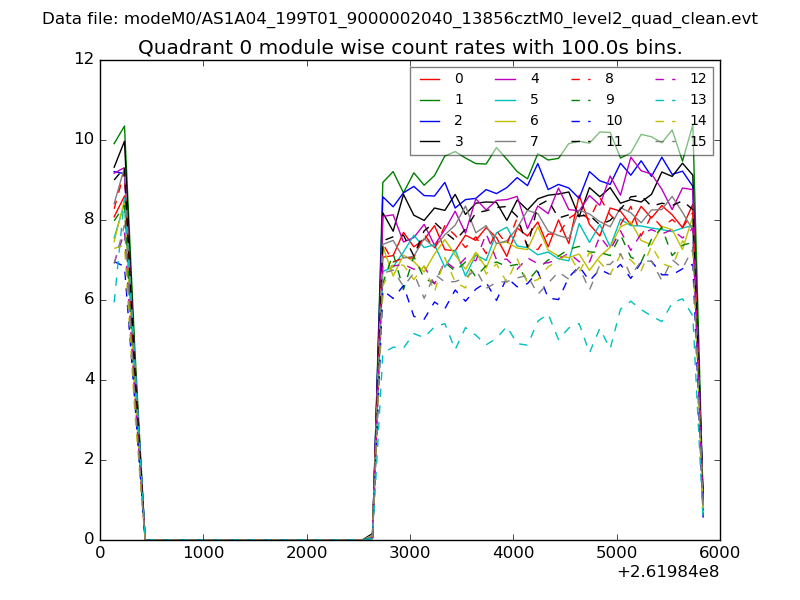 |
 |
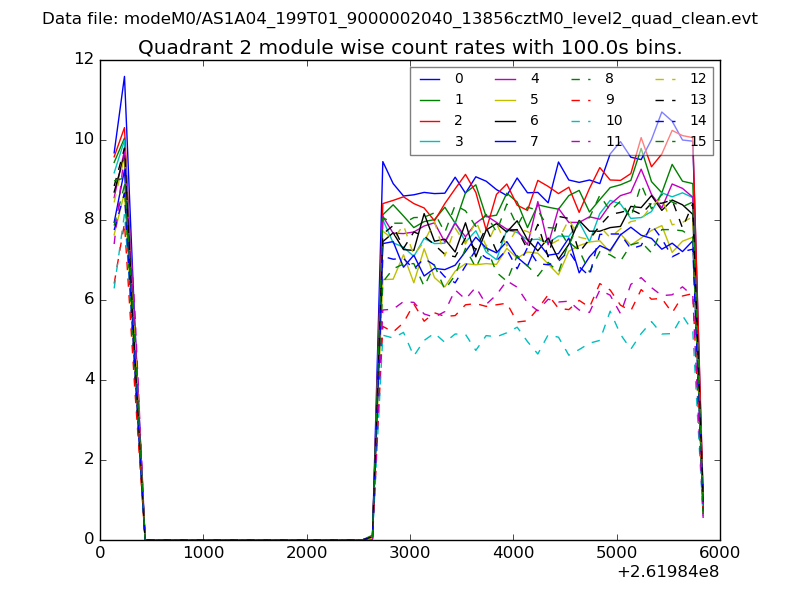
| Module-wise count rates for Quadrant B Data is divided into 100 sec bins |
 |
 |
| Module-wise count rates for Quadrant C Data is divided into 100 sec bins |
 |
 |
| Module-wise count rates for Quadrant D Data is divided into 100 sec bins |
 |
 |
| Parameter | Plot |
|---|---|
| CZT HV Monitor | 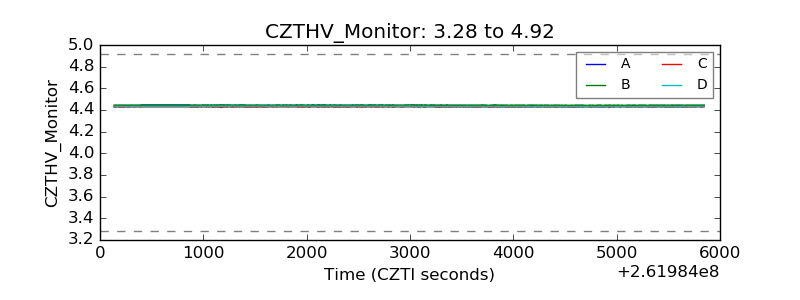 |
| D_VDD | 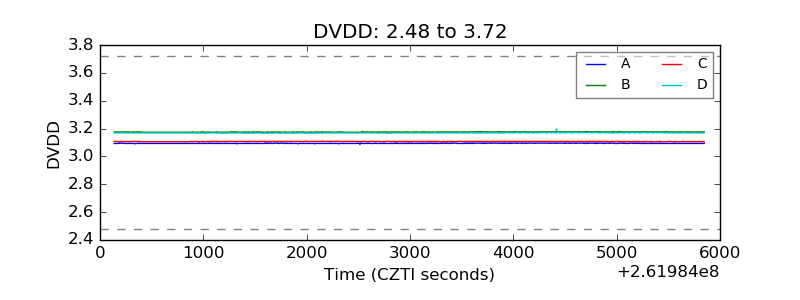 |
| Temperature 1 | 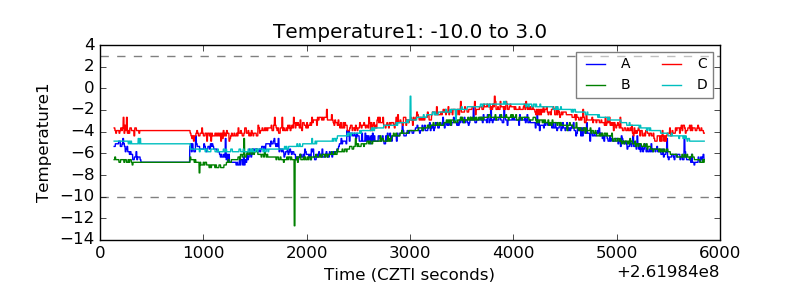 |
| Veto HV Monitor | 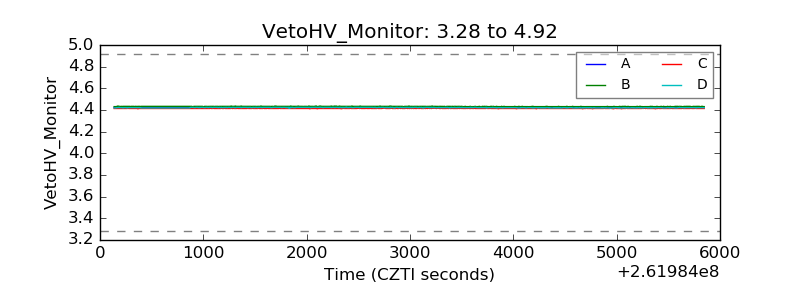 |
| Veto LLD | 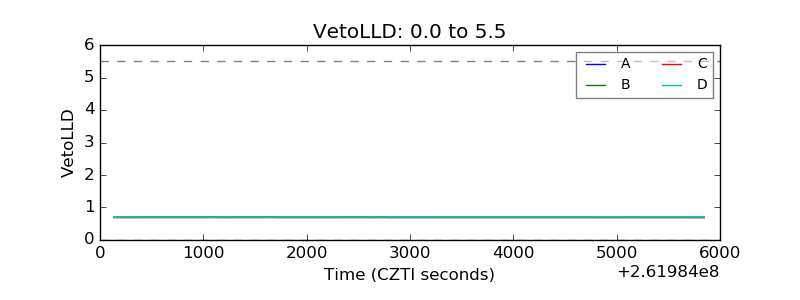 |
| Alpha Counter | 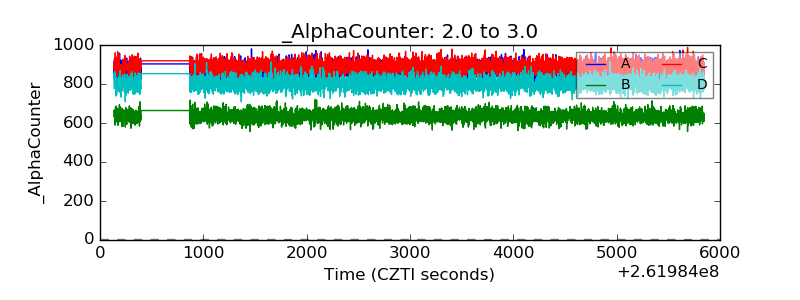 |
| _CPM_Rate | 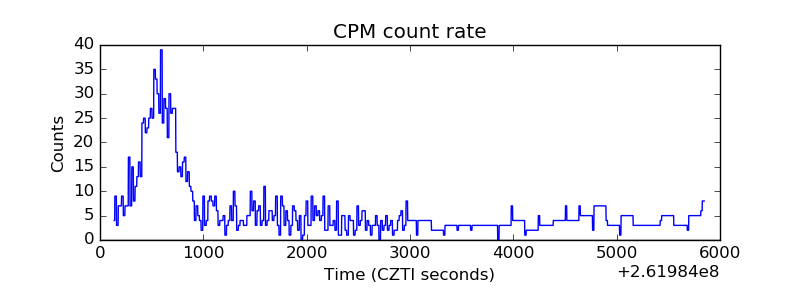 |
| CZT Counter | 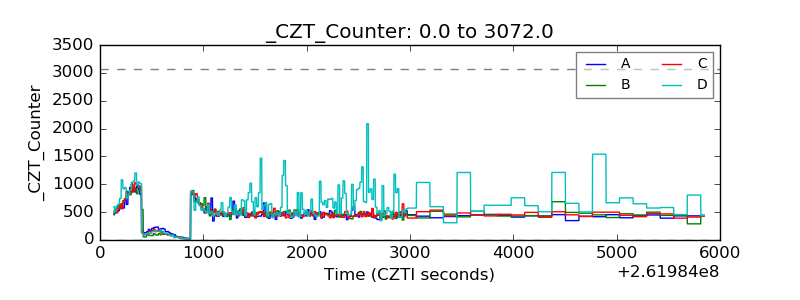 |
| +2.5 Volts monitor |  |
| +5 Volts monitor |  |
| _ROLL_ROT | 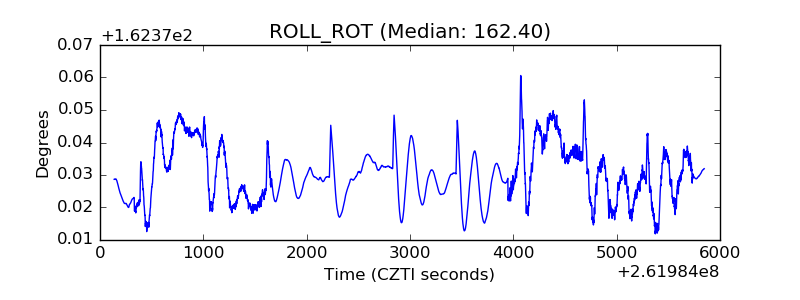 |
| _Roll_DEC | 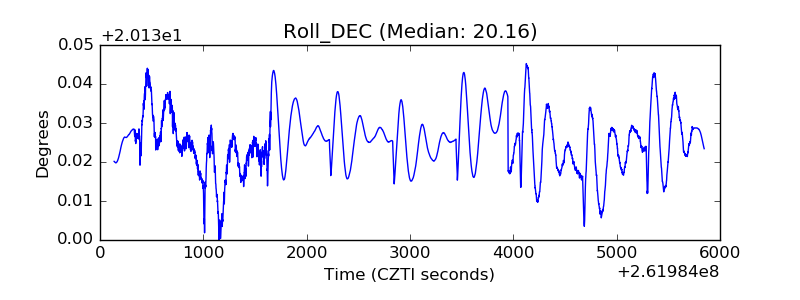 |
| _Roll_RA | 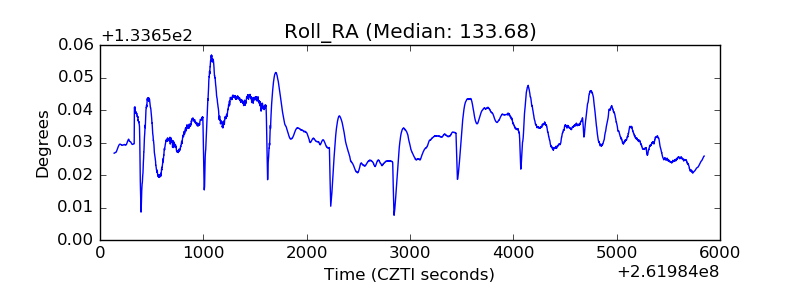 |
| Veto Counter | 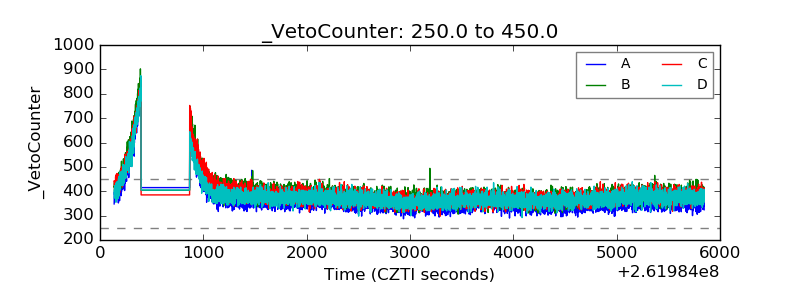 |