| Param | Original file | Final file |
|---|---|---|
| Filename | modeM0/AS1A04_115T02_9000002042cztM0_level2.fits | modeM0/AS1A04_115T02_9000002042cztM0_level2_quad_clean.evt |
| Size (bytes) | 872,441,280 | 789,120,000 |
| Size | 832.0 MB | 752.6 MB |
| Events in quadrant A | 5,312,092 | 4,590,356 |
| Events in quadrant B | 5,126,086 | 4,596,375 |
| Events in quadrant C | 5,224,344 | 4,400,724 |
| Events in quadrant D | 4,424,080 | 3,977,179 |
| Mode M9 | |||
|---|---|---|---|
| Quadrant | BADHDUFLAG | Total packets | Discarded packets |
| A | 0 | 123 | 0 |
| B | 0 | 123 | 0 |
| C | 0 | 123 | 0 |
| D | 0 | 123 | 0 |
| Mode M0 | |||
|---|---|---|---|
| Quadrant | BADHDUFLAG | Total packets | Discarded packets |
| A | 0 | 198453 | 0 |
| B | 0 | 193845 | 0 |
| C | 0 | 191146 | 0 |
| D | 0 | 247576 | 0 |
| Mode SS | |||
|---|---|---|---|
| Quadrant | BADHDUFLAG | Total packets | Discarded packets |
| A | 0 | 1888 | 0 |
| B | 0 | 1888 | 0 |
| C | 0 | 1888 | 0 |
| D | 0 | 1888 | 0 |
| Quadrant | Total seconds | Saturated seconds | Saturation percentage |
|---|---|---|---|
| A | 92392 | 1649 | 1.784787% |
| B | 92392 | 1725 | 1.867045% |
| C | 92392 | 1043 | 1.128886% |
| D | 92392 | 3683 | 3.986276% |
Noise dominated data is calculated using 1-second bins in cleaned event files. If a bin has >2000 counts, and if more than 50% of those come from <1% of pixels, then it is considered to be noise-dominated and hence unusable.
| Quadrant | # 1 sec bins | Bins with >0 counts | Bins with >2000 counts | High rate bins dominated by noise | Noise dominated (total time) | Noise dominated (detector-on time) | Marked lightcurve |
|---|---|---|---|---|---|---|---|
| A | 104788 | 92374 | 0 | 0 | 0.00% | 0.00% |  |
| B | 104788 | 92357 | 0 | 0 | 0.00% | 0.00% |  |
| C | 104788 | 92377 | 0 | 0 | 0.00% | 0.00% | 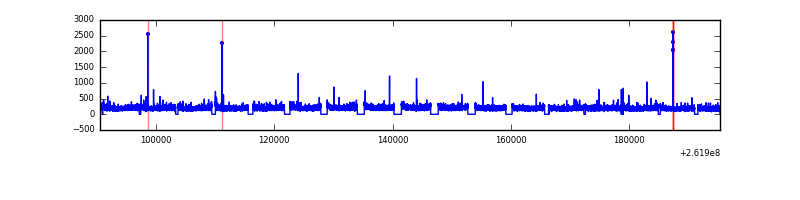 |
| D | 104788 | 92358 | 0 | 0 | 0.00% | 0.00% | 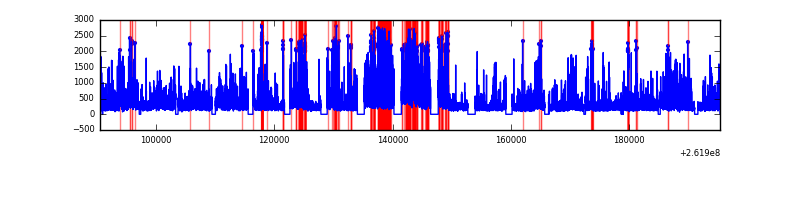 |
Top three noisy pixels from each quadrant. If the there are fewer than three noisy pixels in the level2.evt file, extra rows are filled as -1
| Pixel properties | Quadrant properties | ||||||
|---|---|---|---|---|---|---|---|
| Quadrant | DetID | PixID | Counts | Sigma | Mean | Median | Sigma |
| A | 0 | 29 | 5111 | 10.84 | 1378 | 1280 | 353.2 |
| A | 7 | 110 | 4332 | 8.64 | 1378 | 1280 | 353.2 |
| A | 9 | 19 | 3897 | 7.41 | 1378 | 1280 | 353.2 |
| B | 2 | 9 | 4579 | 12.14 | 1347 | 1275 | 272.1 |
| B | 2 | 8 | 3520 | 8.25 | 1347 | 1275 | 272.1 |
| B | 3 | 17 | 3479 | 8.1 | 1347 | 1275 | 272.1 |
| C | 1 | 80 | 3921 | 7.32 | 1379 | 1273 | 361.8 |
| C | 1 | 81 | 3855 | 7.14 | 1379 | 1273 | 361.8 |
| C | 12 | 241 | 3675 | 6.64 | 1379 | 1273 | 361.8 |
| D | 3 | 14 | 3224 | 6.12 | 1263 | 1147 | 339.6 |
| D | 6 | 231 | 3192 | 6.02 | 1263 | 1147 | 339.6 |
| D | 3 | 31 | 3119 | 5.81 | 1263 | 1147 | 339.6 |
Histogram calculated using DETX and DETY for each event in the final _common_clean file
| Quadrant A |  |
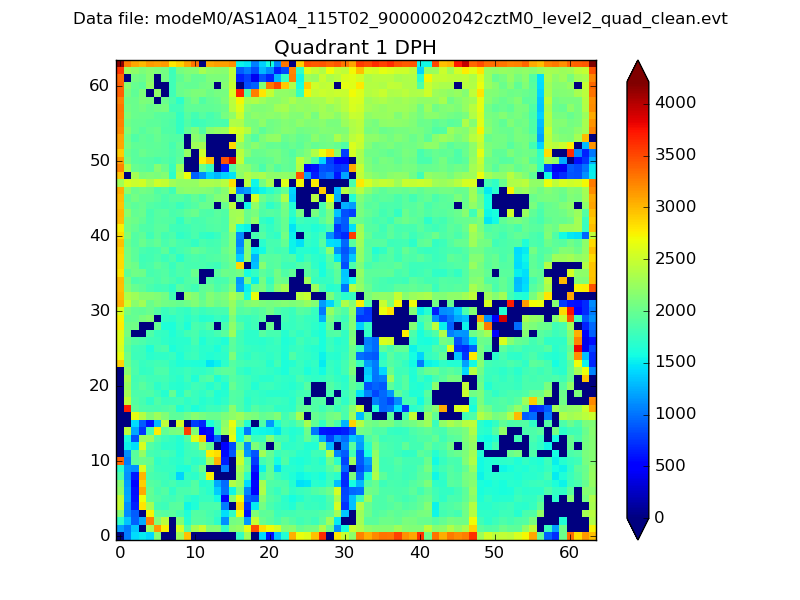 |
Quadrant B |
|---|---|---|---|
| Quadrant D |  |
 |
Quadrant C |
| Plot type | Count rate plots | Images |
|---|---|---|
| Comparison with Poisson distribution Blue bars denote a histogram of data divided into 1 sec bins. Red curve is a Poisson curve with rate = median count rate of data. |
 |
 |
| Quadrant-wise count rates Data is divided into 100 sec bins |
 |
|
| Module-wise count rates for Quadrant A Data is divided into 100 sec bins |
 |
 |
| Module-wise count rates for Quadrant B Data is divided into 100 sec bins |
 |
 |
| Module-wise count rates for Quadrant C Data is divided into 100 sec bins |
 |
 |
| Module-wise count rates for Quadrant D Data is divided into 100 sec bins |
 |
 |
| Parameter | Plot |
|---|---|
| CZT HV Monitor | 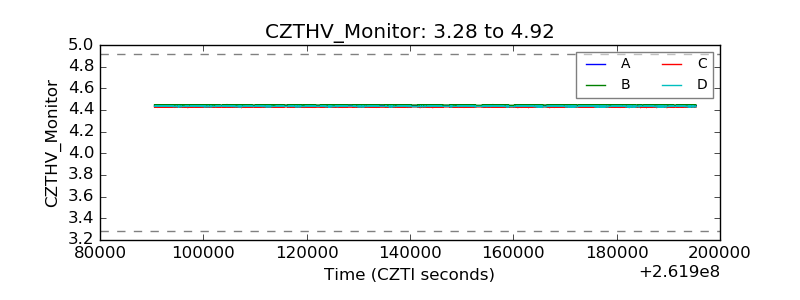 |
| D_VDD | 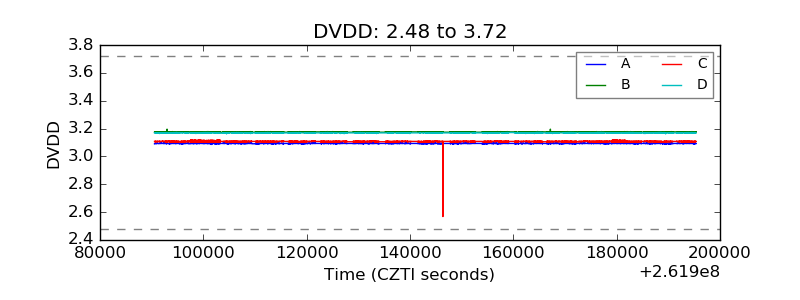 |
| Temperature 1 |  |
| Veto HV Monitor |  |
| Veto LLD | 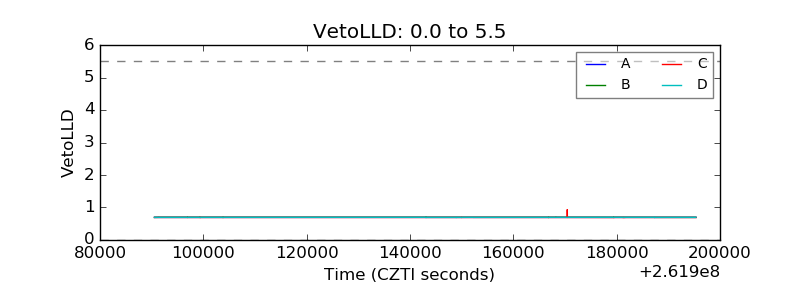 |
| Alpha Counter |  |
| _CPM_Rate |  |
| CZT Counter |  |
| +2.5 Volts monitor |  |
| +5 Volts monitor |  |
| _ROLL_ROT |  |
| _Roll_DEC |  |
| _Roll_RA |  |
| Veto Counter |  |