| Param | Original file | Final file |
|---|---|---|
| Filename | modeM0/AS1A04_115T02_9000002042_13856cztM0_level2.evt | modeM0/AS1A04_115T02_9000002042_13856cztM0_level2_quad_clean.evt |
| Size (bytes) | 157,875,840 | 15,033,600 |
| Size | 150.6 MB | 14.3 MB |
| Events in quadrant A | 1,085,664 | 75,837 |
| Events in quadrant B | 1,143,606 | 76,376 |
| Events in quadrant C | 1,119,255 | 80,875 |
| Events in quadrant D | 1,294,749 | 76,311 |
| Mode M9 | |||
|---|---|---|---|
| Quadrant | BADHDUFLAG | Total packets | Discarded packets |
| A | 0 | 1 | 0 |
| B | 0 | 1 | 0 |
| C | 0 | 1 | 0 |
| D | 0 | 1 | 0 |
| Mode M0 | |||
|---|---|---|---|
| Quadrant | BADHDUFLAG | Total packets | Discarded packets |
| A | 0 | 4599 | 2 |
| B | 0 | 4672 | 1 |
| C | 0 | 4650 | 1 |
| D | 0 | 5226 | 1 |
| Mode SS | |||
|---|---|---|---|
| Quadrant | BADHDUFLAG | Total packets | Discarded packets |
| A | 0 | 42 | 0 |
| B | 0 | 42 | 0 |
| C | 0 | 42 | 0 |
| D | 0 | 42 | 0 |
| Quadrant | Total seconds | Saturated seconds | Saturation percentage |
|---|---|---|---|
| A | 1991 | 211 | 10.597690% |
| B | 1991 | 254 | 12.757408% |
| C | 1991 | 164 | 8.237067% |
| D | 1991 | 197 | 9.894525% |
Noise dominated data is calculated using 1-second bins in cleaned event files. If a bin has >2000 counts, and if more than 50% of those come from <1% of pixels, then it is considered to be noise-dominated and hence unusable.
| Quadrant | # 1 sec bins | Bins with >0 counts | Bins with >2000 counts | High rate bins dominated by noise | Noise dominated (total time) | Noise dominated (detector-on time) | Marked lightcurve |
|---|---|---|---|---|---|---|---|
| A | 2102 | 1992 | 0 | 0 | 0.00% | 0.00% | 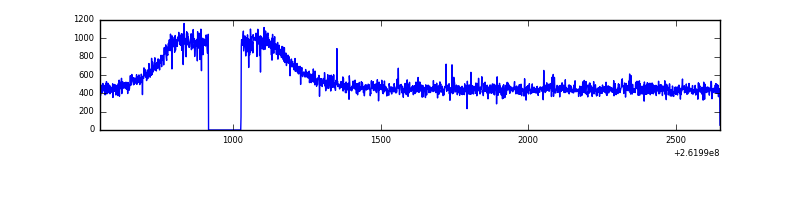 |
| B | 2102 | 1992 | 2 | 2 | 0.10% | 0.10% | 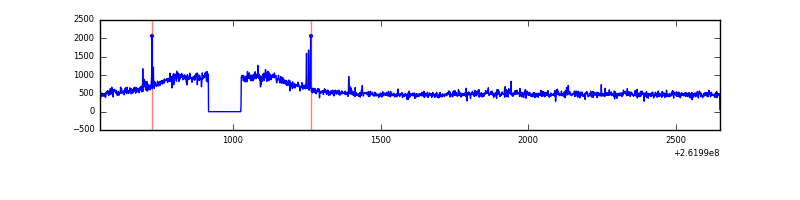 |
| C | 2102 | 1992 | 0 | 0 | 0.00% | 0.00% | 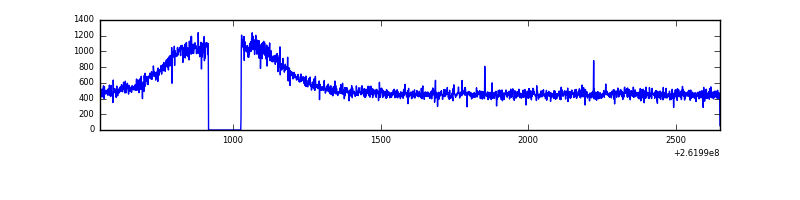 |
| D | 2102 | 1992 | 14 | 14 | 0.67% | 0.70% | 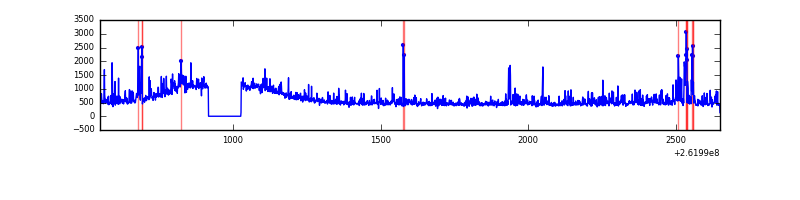 |
Top three noisy pixels from each quadrant. If the there are fewer than three noisy pixels in the level2.evt file, extra rows are filled as -1
| Pixel properties | Quadrant properties | ||||||
|---|---|---|---|---|---|---|---|
| Quadrant | DetID | PixID | Counts | Sigma | Mean | Median | Sigma |
| A | 1 | 162 | 3558 | 54.05 | 280 | 273 | 60.8 |
| A | 0 | 226 | 2520 | 36.97 | 280 | 273 | 60.8 |
| A | 12 | 194 | 2042 | 29.11 | 280 | 273 | 60.8 |
| B | 0 | 214 | 43880 | 740.93 | 276 | 268 | 58.9 |
| B | 0 | 219 | 10510 | 174.0 | 276 | 268 | 58.9 |
| B | 4 | 80 | 9667 | 159.68 | 276 | 268 | 58.9 |
| C | 3 | 233 | 52842 | 774.36 | 273 | 274 | 67.9 |
| C | 13 | 61 | 2018 | 25.69 | 273 | 274 | 67.9 |
| C | 14 | 220 | 1624 | 19.89 | 273 | 274 | 67.9 |
| D | 10 | 157 | 123424 | 1808.2 | 268 | 260 | 68.1 |
| D | 13 | 104 | 41550 | 606.19 | 268 | 260 | 68.1 |
| D | 5 | 222 | 34992 | 509.91 | 268 | 260 | 68.1 |
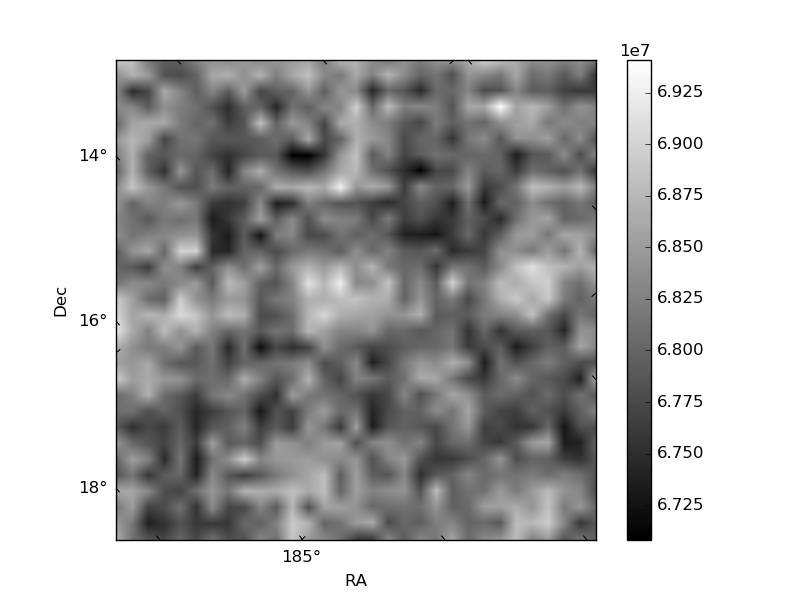
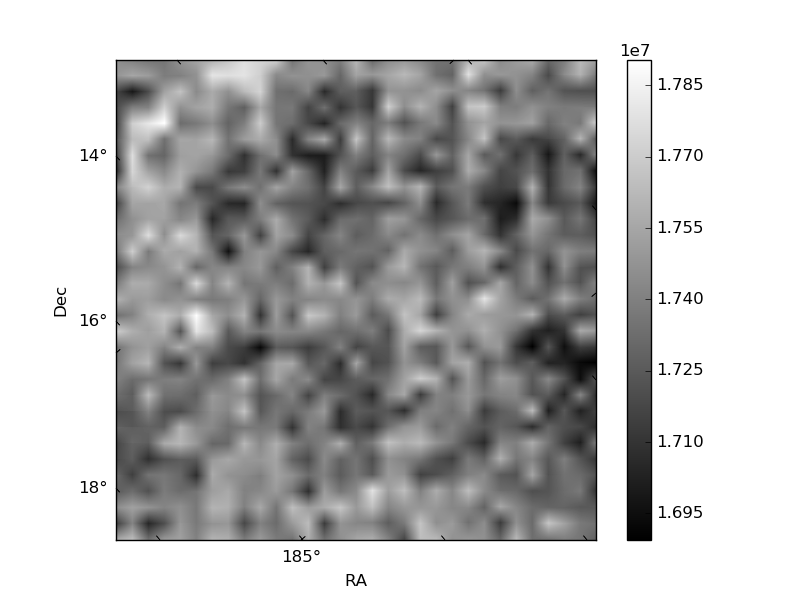
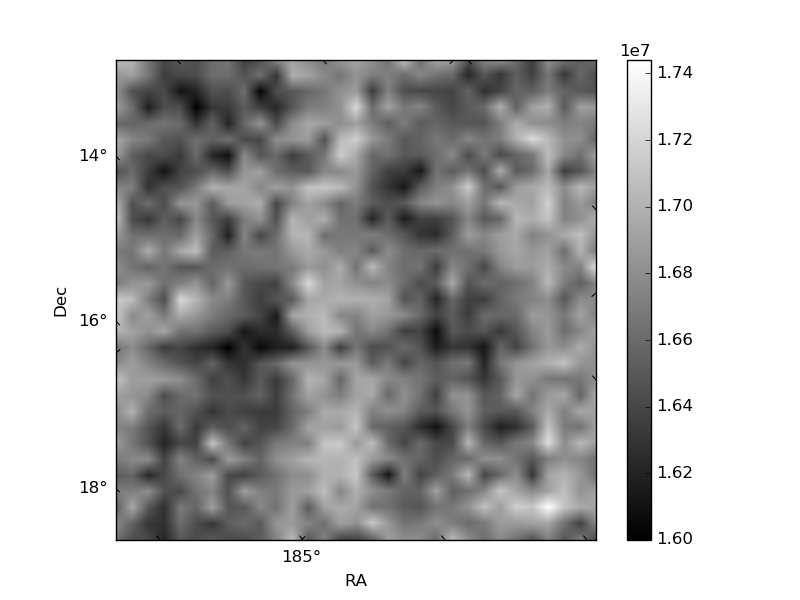
Histogram calculated using DETX and DETY for each event in the final _common_clean file
| Quadrant A | 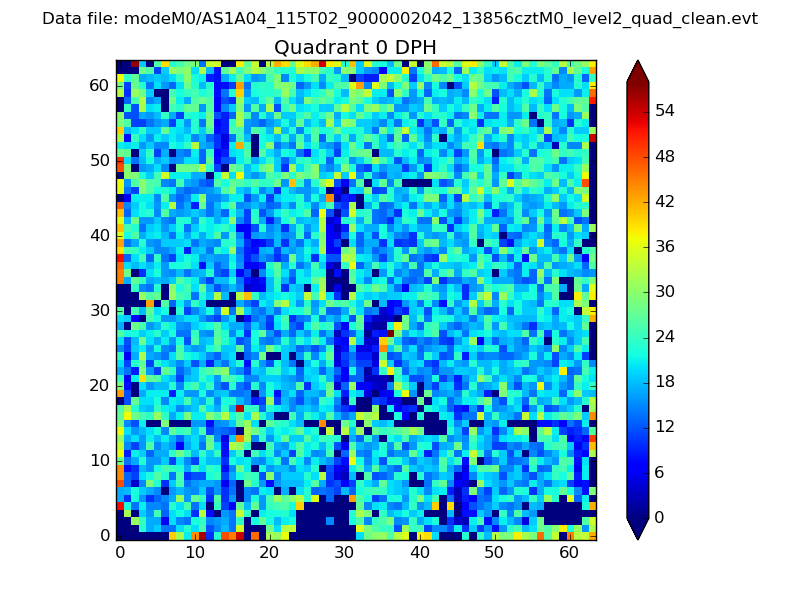 |
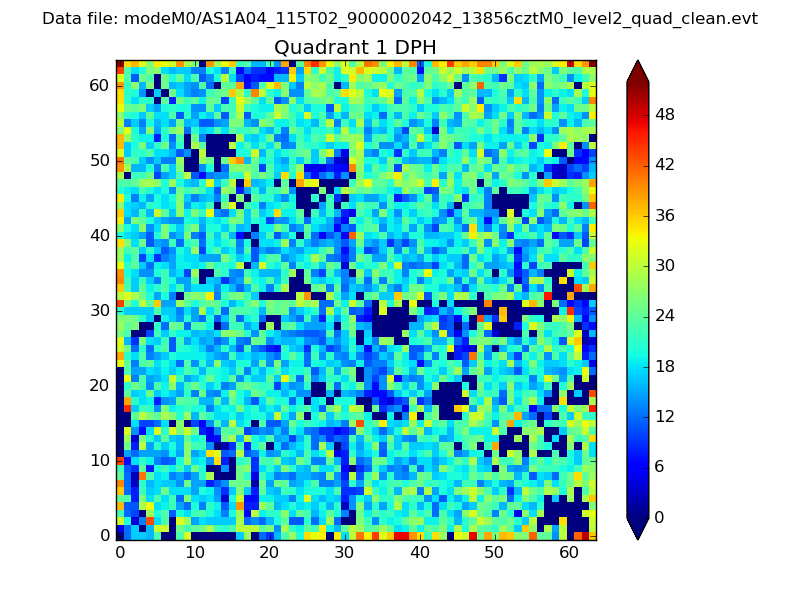 |
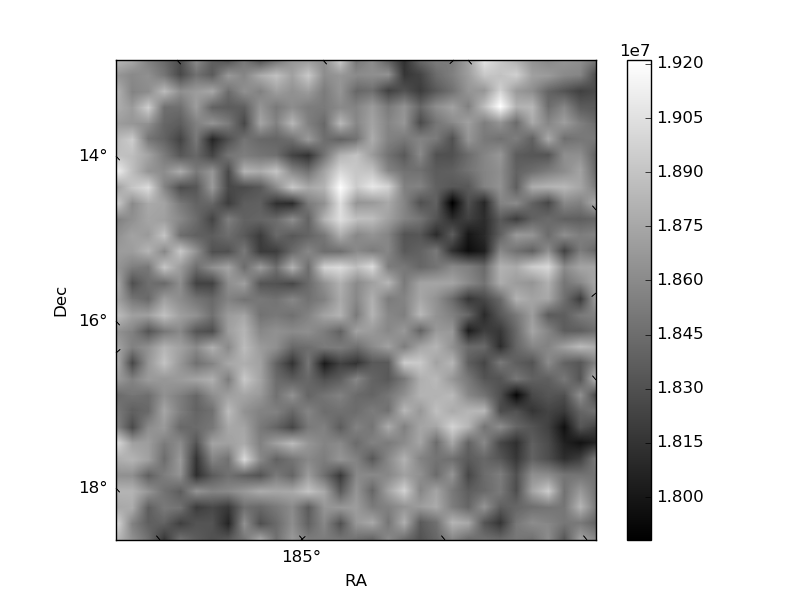
Quadrant B |
|---|---|---|---|
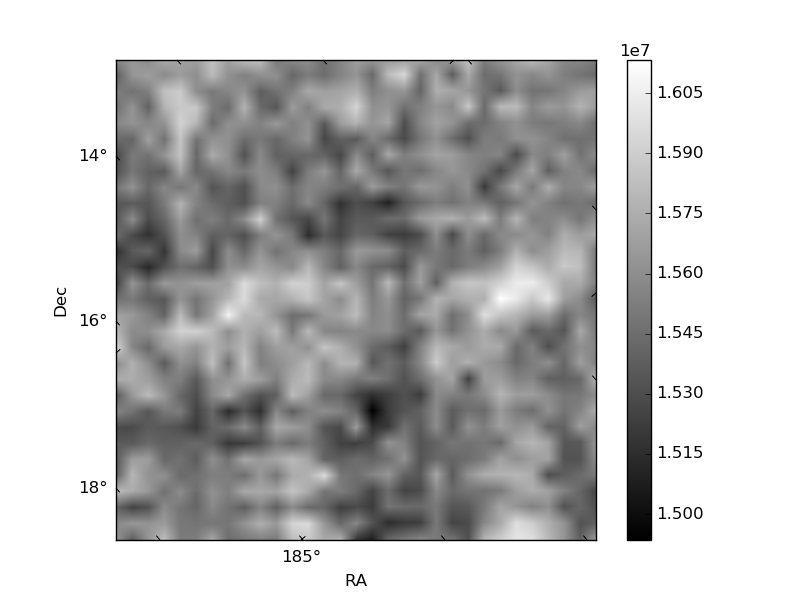
| Quadrant D | 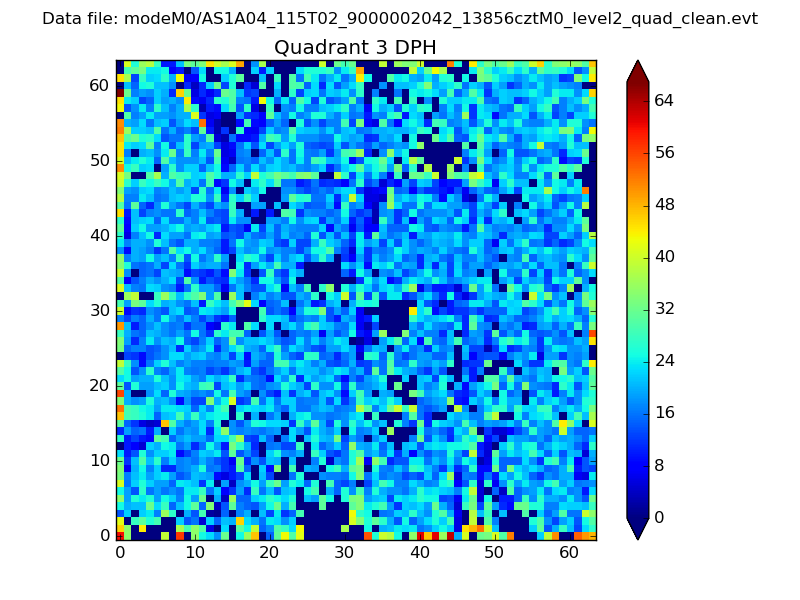 |
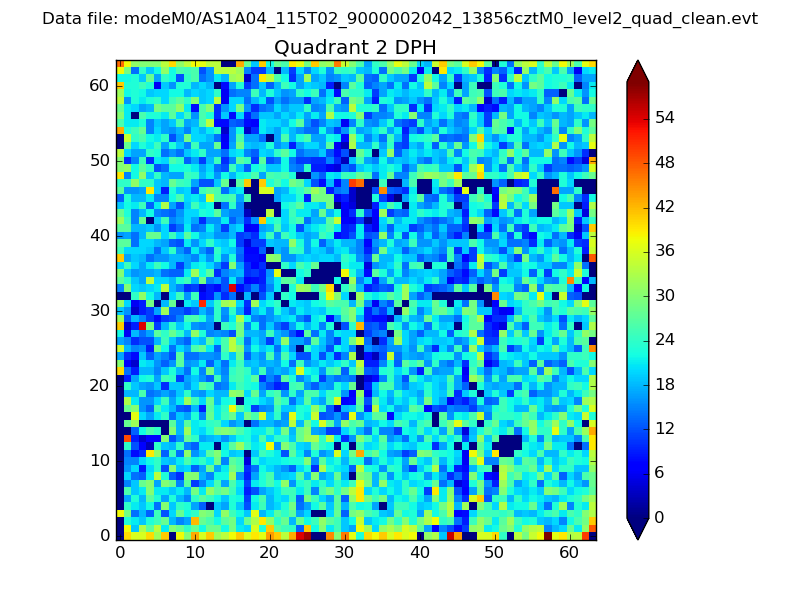 |
Quadrant C |
| Plot type | Count rate plots | Images |
|---|---|---|
| Comparison with Poisson distribution Blue bars denote a histogram of data divided into 1 sec bins. Red curve is a Poisson curve with rate = median count rate of data. |
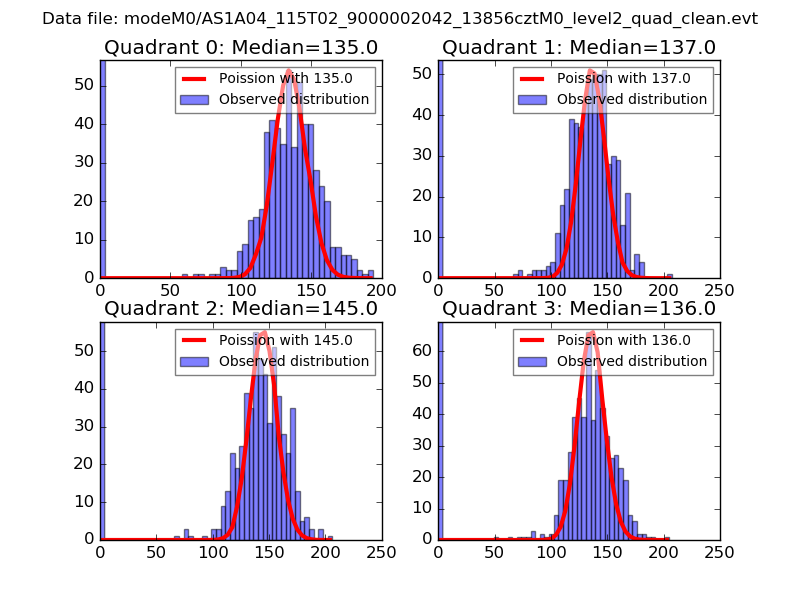 |
 |
| Quadrant-wise count rates Data is divided into 100 sec bins |
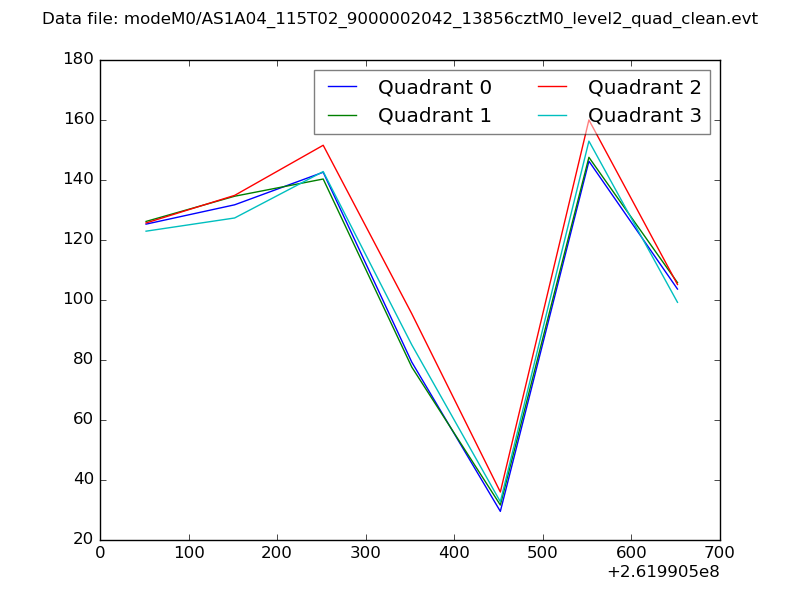 |
|
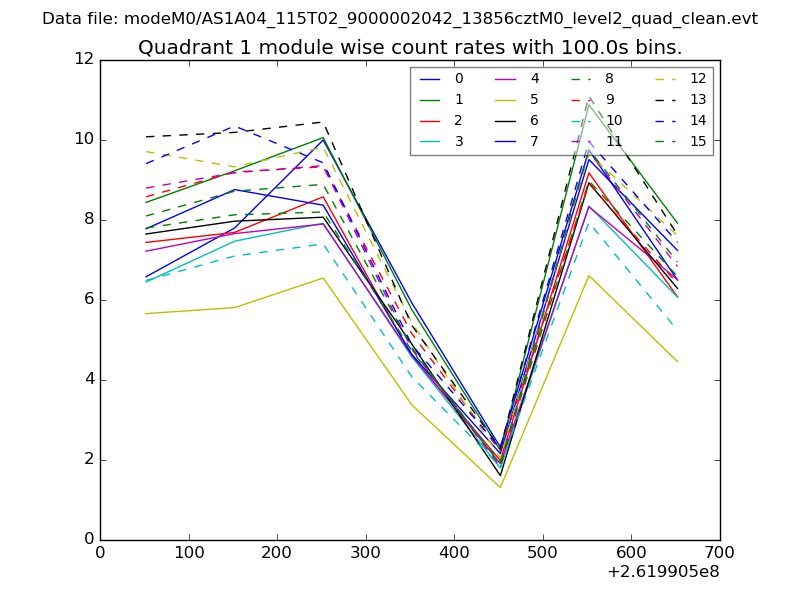
| Module-wise count rates for Quadrant A Data is divided into 100 sec bins |
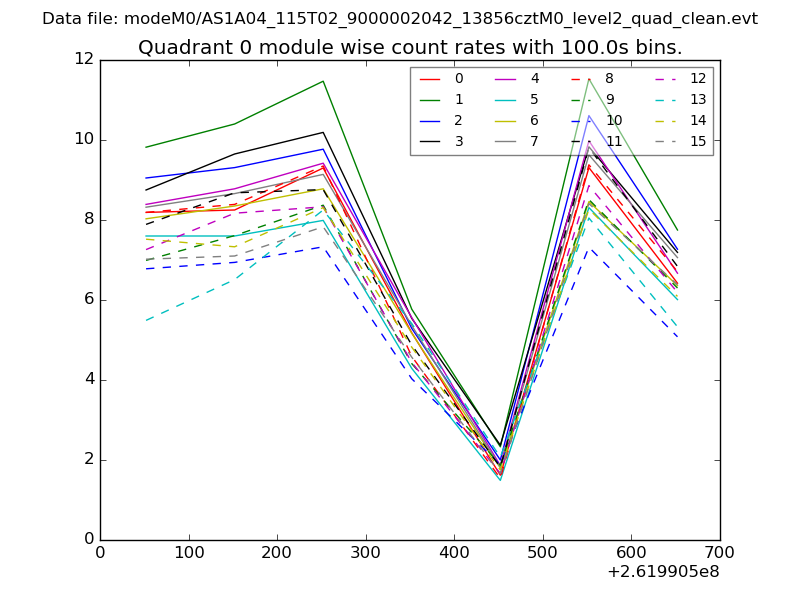 |
 |
| Module-wise count rates for Quadrant B Data is divided into 100 sec bins |
 |
 |
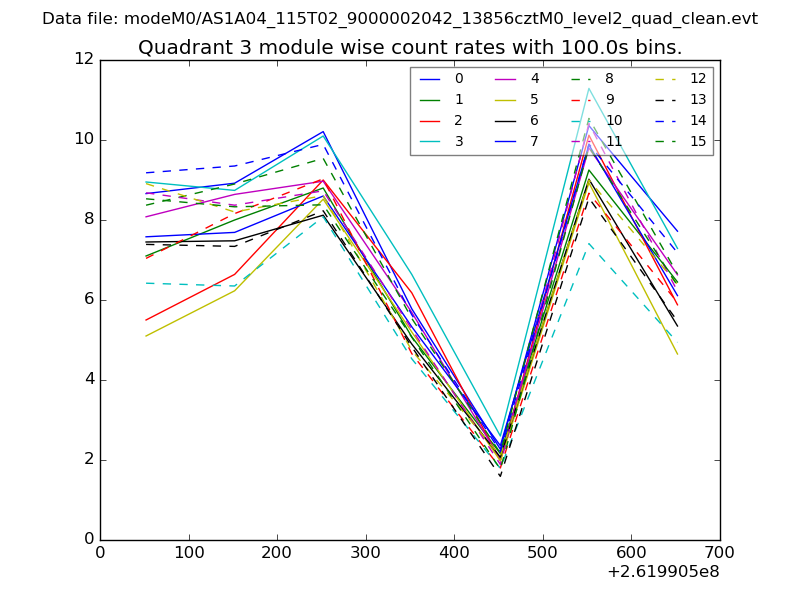
| Module-wise count rates for Quadrant C Data is divided into 100 sec bins |
 |
 |
| Module-wise count rates for Quadrant D Data is divided into 100 sec bins |
 |
 |
| Parameter | Plot |
|---|---|
| CZT HV Monitor | 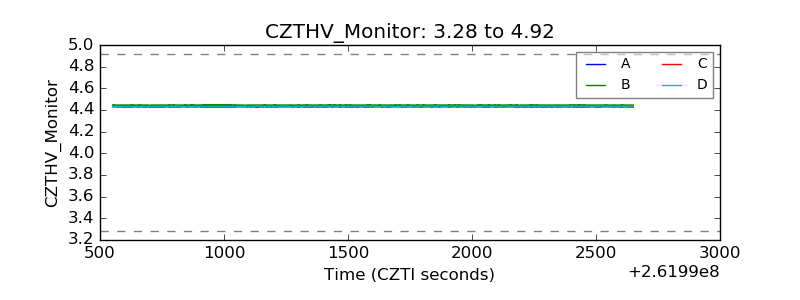 |
| D_VDD | 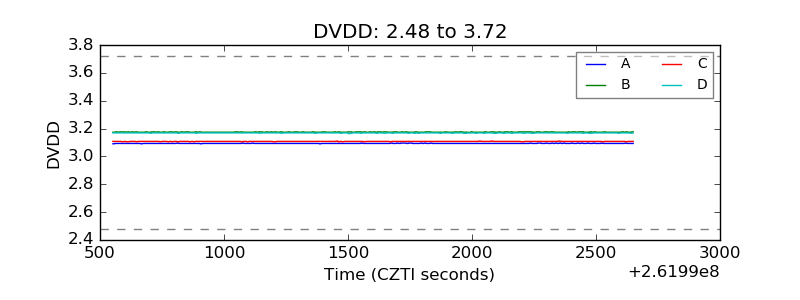 |
| Temperature 1 | 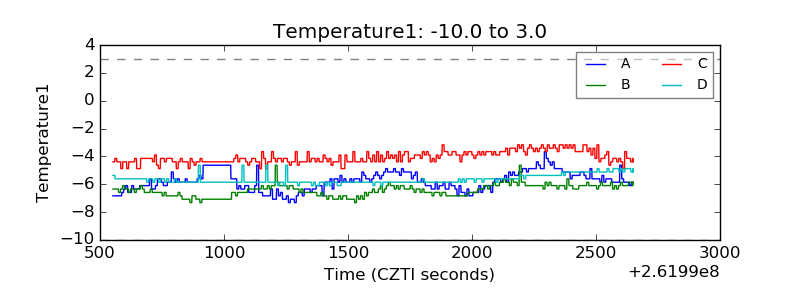 |
| Veto HV Monitor | 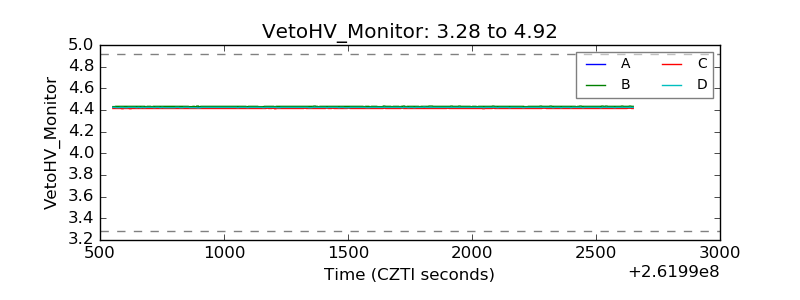 |
| Veto LLD | 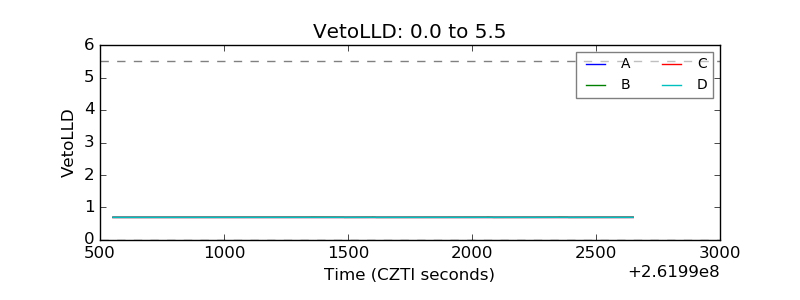 |
| Alpha Counter | 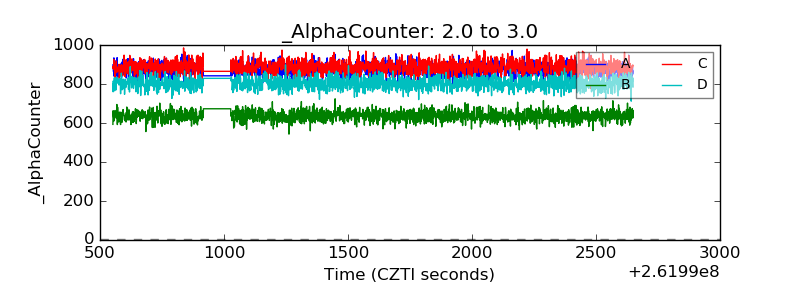 |
| _CPM_Rate | 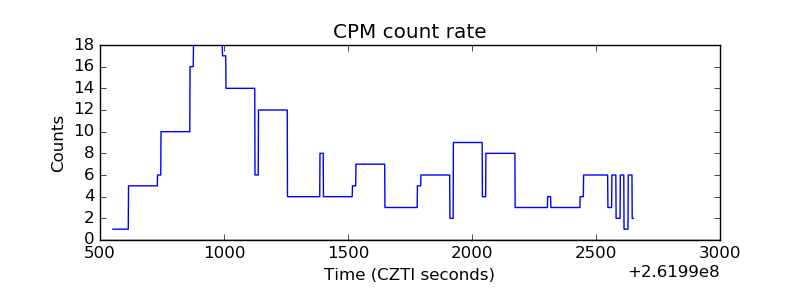 |
| CZT Counter | 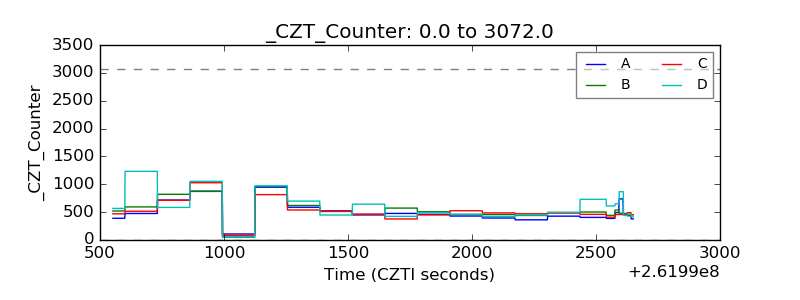 |
| +2.5 Volts monitor | 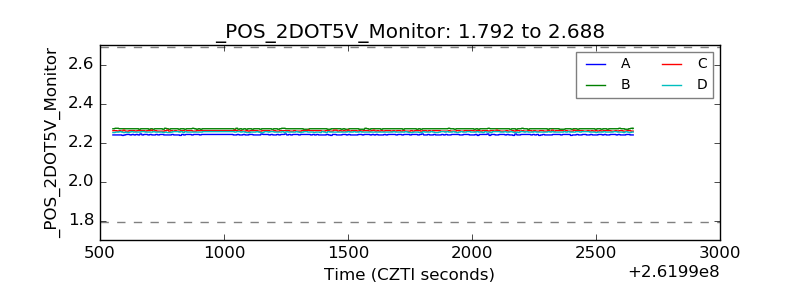 |
| +5 Volts monitor | 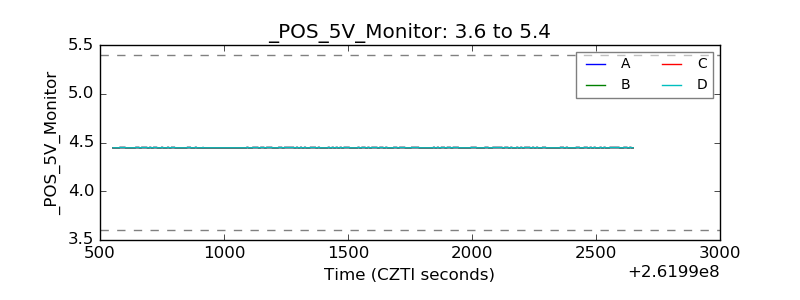 |
| _ROLL_ROT |  |
| _Roll_DEC | 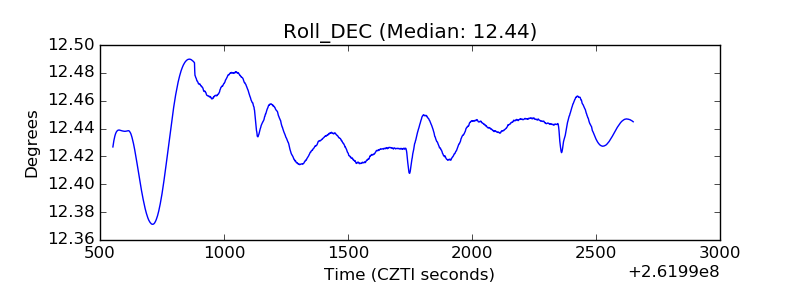 |
| _Roll_RA | 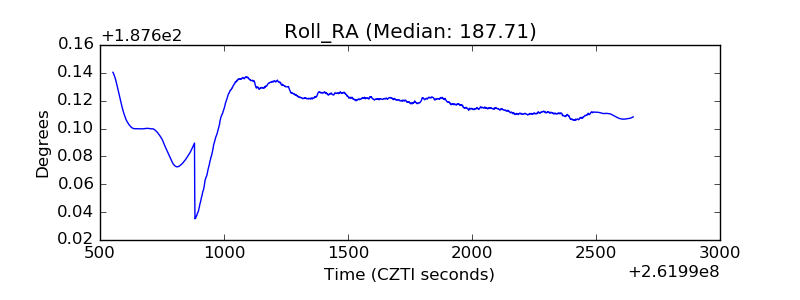 |
| Veto Counter | 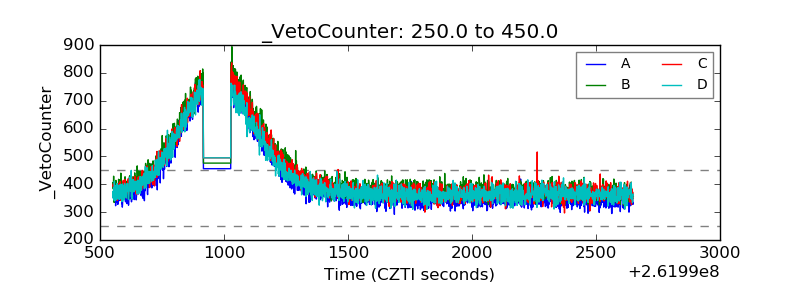 |