| Param | Original file | Final file |
|---|---|---|
| Filename | modeM0/AS1A04_115T02_9000002042_13857cztM0_level2.evt | modeM0/AS1A04_115T02_9000002042_13857cztM0_level2_quad_clean.evt |
| Size (bytes) | 568,949,760 | 79,027,200 |
| Size | 542.6 MB | 75.4 MB |
| Events in quadrant A | 3,656,433 | 471,743 |
| Events in quadrant B | 3,914,265 | 476,731 |
| Events in quadrant C | 3,748,368 | 472,474 |
| Events in quadrant D | 5,390,427 | 437,827 |
| Mode M9 | |||
|---|---|---|---|
| Quadrant | BADHDUFLAG | Total packets | Discarded packets |
| A | 0 | 4 | 0 |
| B | 0 | 4 | 0 |
| C | 0 | 4 | 0 |
| D | 0 | 4 | 0 |
| Mode M0 | |||
|---|---|---|---|
| Quadrant | BADHDUFLAG | Total packets | Discarded packets |
| A | 0 | 16022 | 3 |
| B | 0 | 16419 | 2 |
| C | 0 | 16095 | 2 |
| D | 0 | 21155 | 2 |
| Mode SS | |||
|---|---|---|---|
| Quadrant | BADHDUFLAG | Total packets | Discarded packets |
| A | 0 | 156 | 0 |
| B | 0 | 156 | 0 |
| C | 0 | 156 | 0 |
| D | 0 | 156 | 0 |
| Quadrant | Total seconds | Saturated seconds | Saturation percentage |
|---|---|---|---|
| A | 7683 | 235 | 3.058701% |
| B | 7683 | 324 | 4.217103% |
| C | 7683 | 166 | 2.160614% |
| D | 7683 | 515 | 6.703111% |
Noise dominated data is calculated using 1-second bins in cleaned event files. If a bin has >2000 counts, and if more than 50% of those come from <1% of pixels, then it is considered to be noise-dominated and hence unusable.
| Quadrant | # 1 sec bins | Bins with >0 counts | Bins with >2000 counts | High rate bins dominated by noise | Noise dominated (total time) | Noise dominated (detector-on time) | Marked lightcurve |
|---|---|---|---|---|---|---|---|
| A | 8054 | 7684 | 0 | 0 | 0.00% | 0.00% | 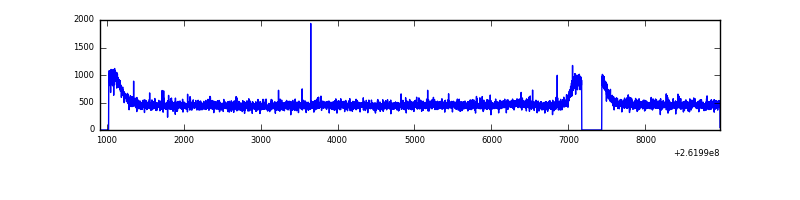 |
| B | 8054 | 7684 | 27 | 27 | 0.34% | 0.35% | 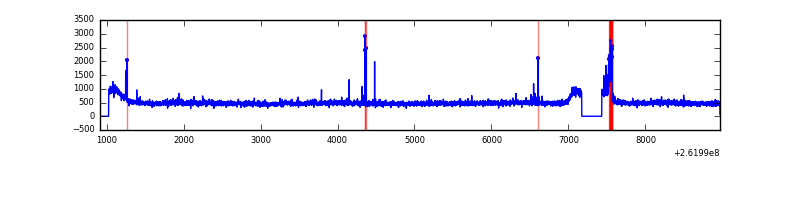 |
| C | 8054 | 7684 | 1 | 1 | 0.01% | 0.01% | 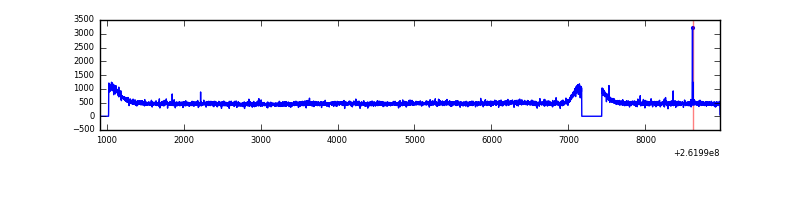 |
| D | 8054 | 7684 | 325 | 325 | 4.04% | 4.23% | 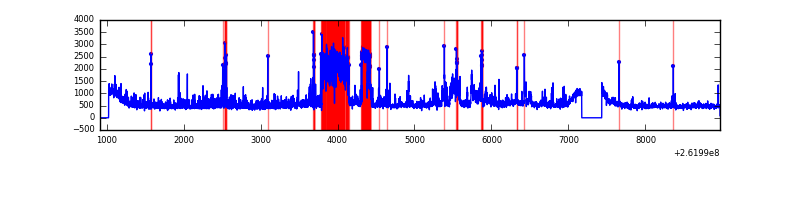 |
Top three noisy pixels from each quadrant. If the there are fewer than three noisy pixels in the level2.evt file, extra rows are filled as -1
| Pixel properties | Quadrant properties | ||||||
|---|---|---|---|---|---|---|---|
| Quadrant | DetID | PixID | Counts | Sigma | Mean | Median | Sigma |
| A | 1 | 162 | 11704 | 55.15 | 946 | 923 | 195.5 |
| A | 0 | 226 | 8230 | 37.38 | 946 | 923 | 195.5 |
| A | 12 | 194 | 6914 | 30.65 | 946 | 923 | 195.5 |
| B | 3 | 64 | 97481 | 522.2 | 936 | 911 | 184.9 |
| B | 0 | 214 | 92807 | 496.92 | 936 | 911 | 184.9 |
| B | 0 | 219 | 39211 | 207.11 | 936 | 911 | 184.9 |
| C | 3 | 233 | 147156 | 675.75 | 919 | 923 | 216.4 |
| C | 14 | 225 | 7759 | 31.59 | 919 | 923 | 216.4 |
| C | 13 | 61 | 6614 | 26.3 | 919 | 923 | 216.4 |
| D | 5 | 222 | 827634 | 3814.79 | 896 | 873 | 216.7 |
| D | 10 | 157 | 425081 | 1957.35 | 896 | 873 | 216.7 |
| D | 1 | 52 | 411882 | 1896.45 | 896 | 873 | 216.7 |
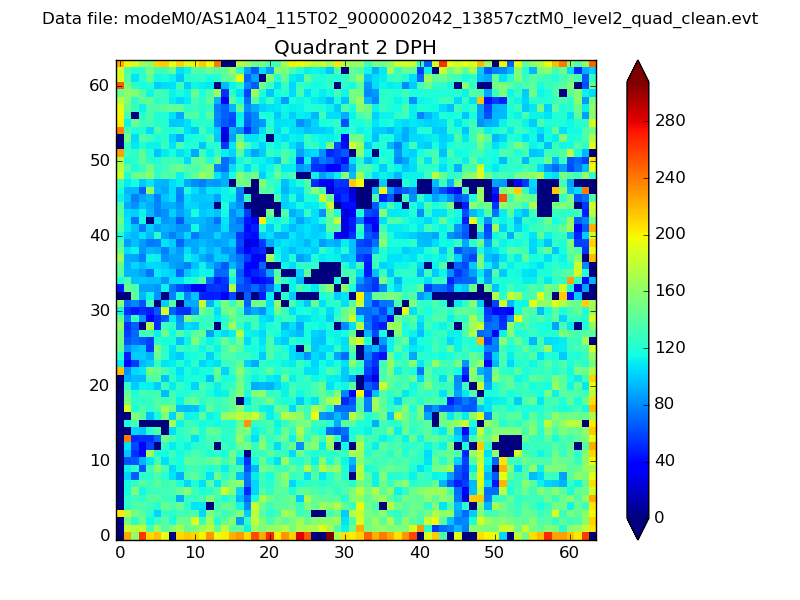
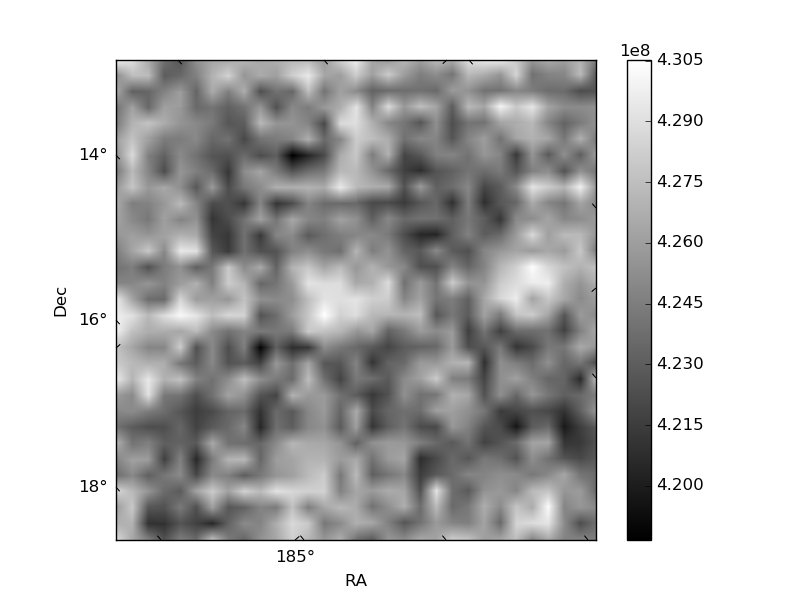
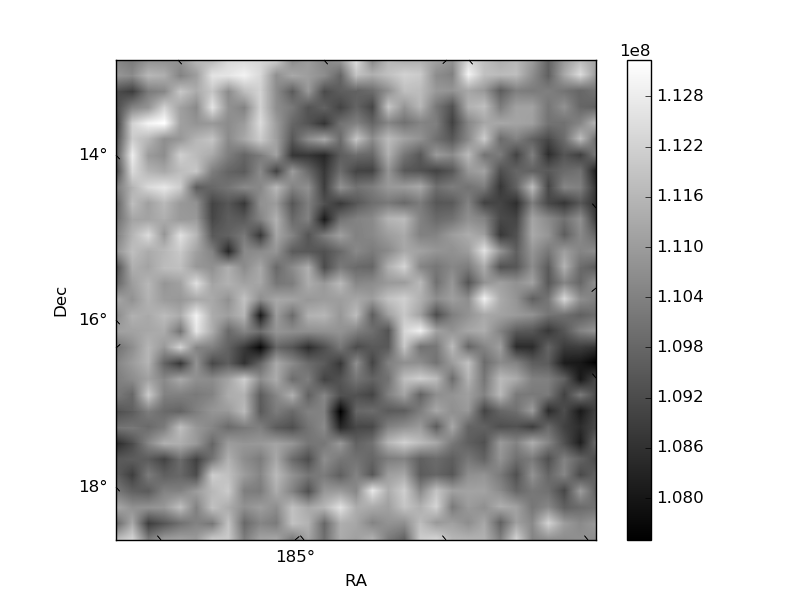
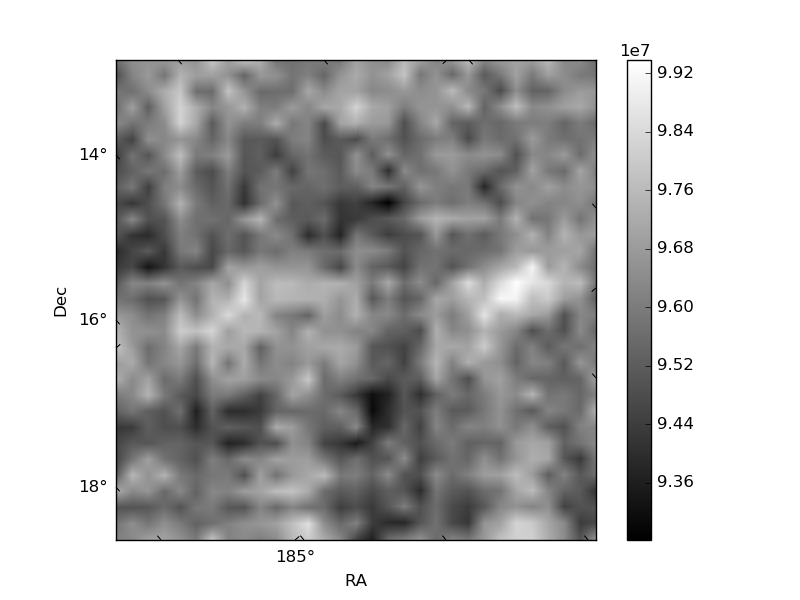
Histogram calculated using DETX and DETY for each event in the final _common_clean file
| Quadrant A | 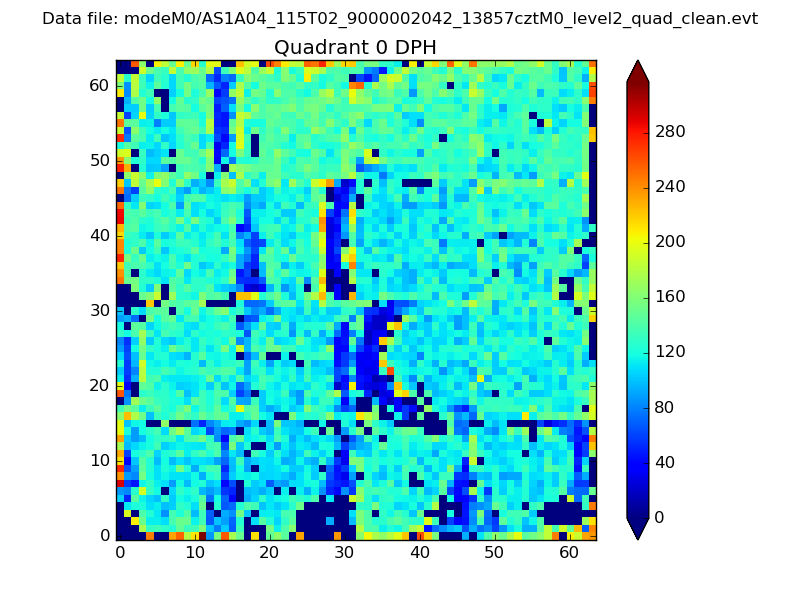 |
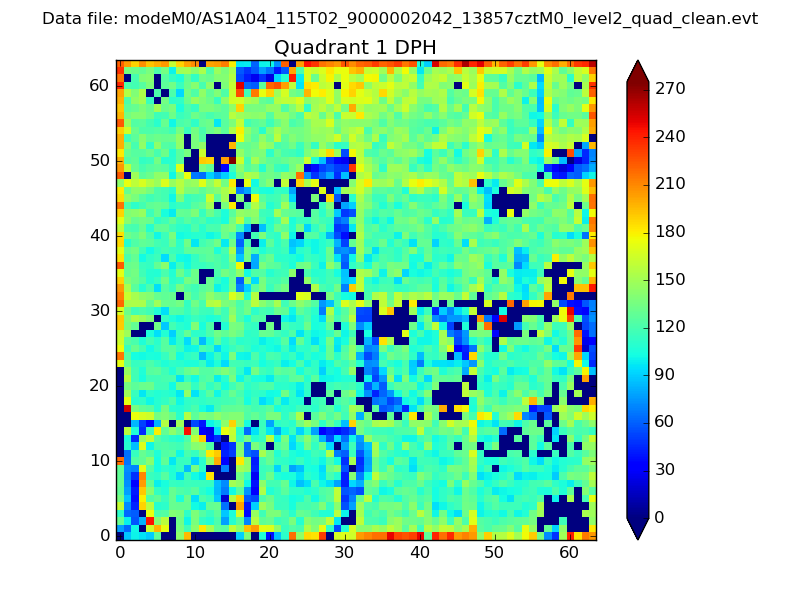 |
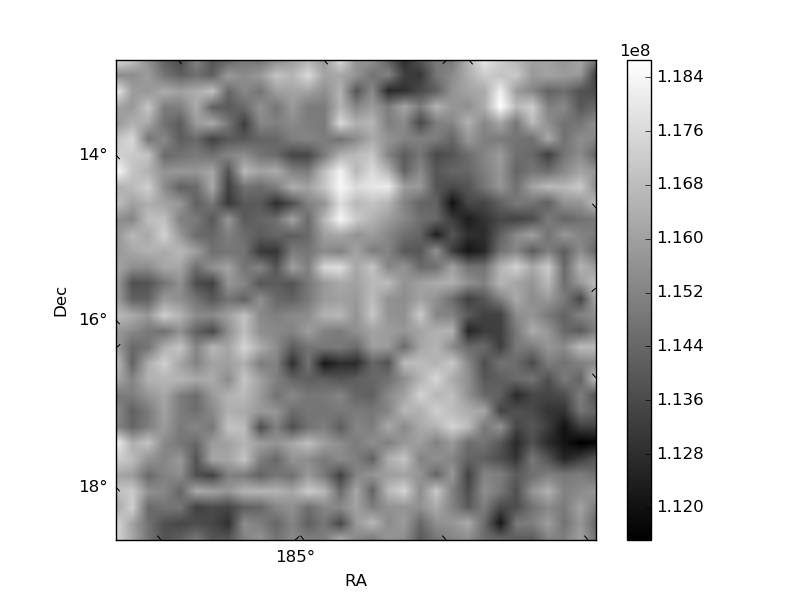
Quadrant B |
|---|---|---|---|
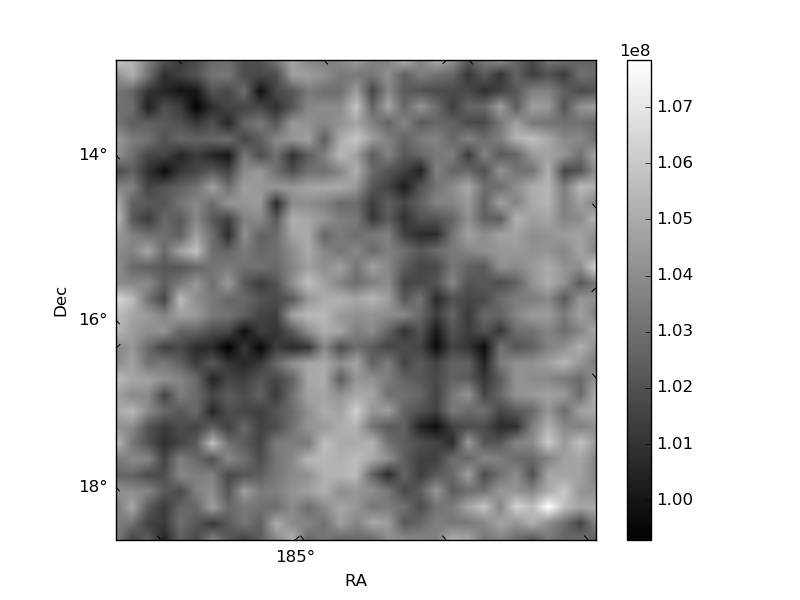
| Quadrant D | 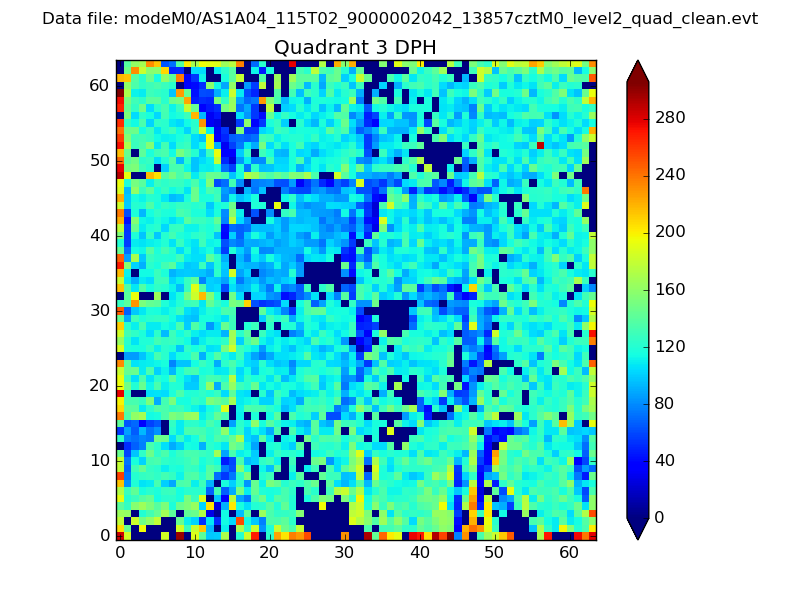 |
 |
Quadrant C |
| Plot type | Count rate plots | Images |
|---|---|---|
| Comparison with Poisson distribution Blue bars denote a histogram of data divided into 1 sec bins. Red curve is a Poisson curve with rate = median count rate of data. |
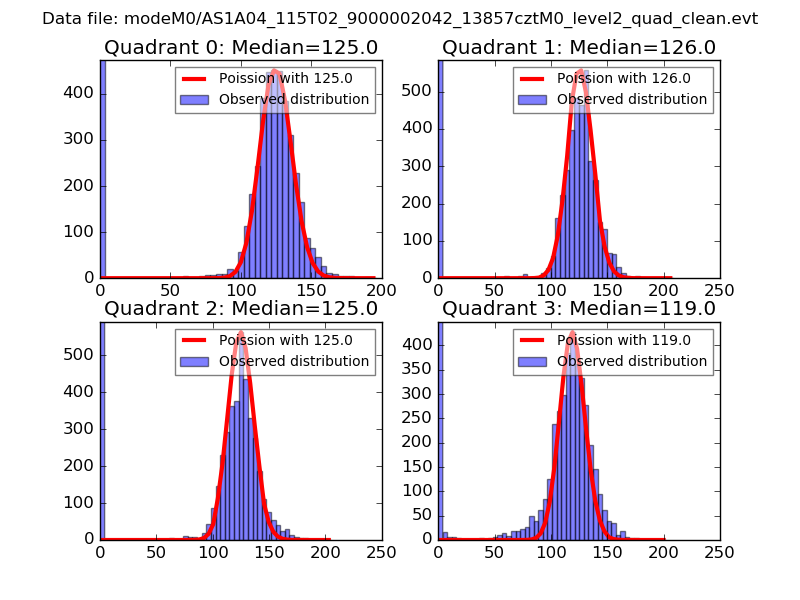 |
 |
| Quadrant-wise count rates Data is divided into 100 sec bins |
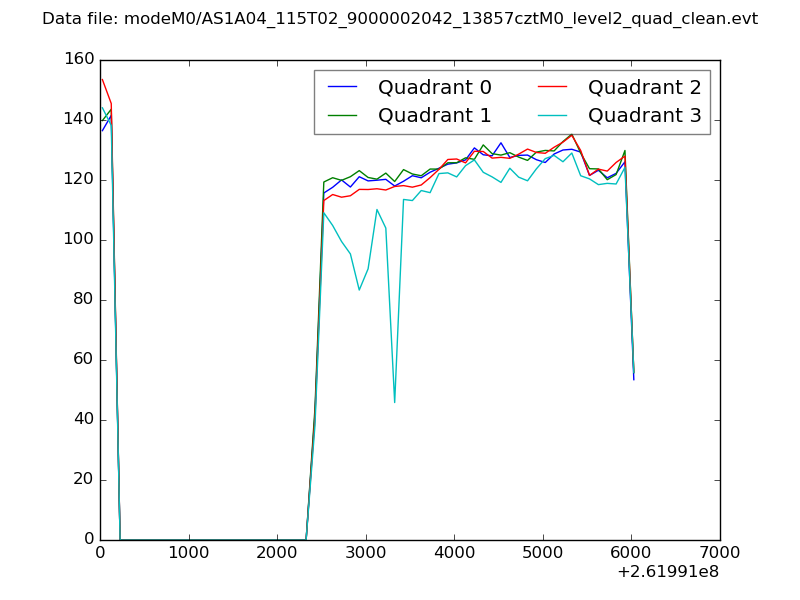 |
|
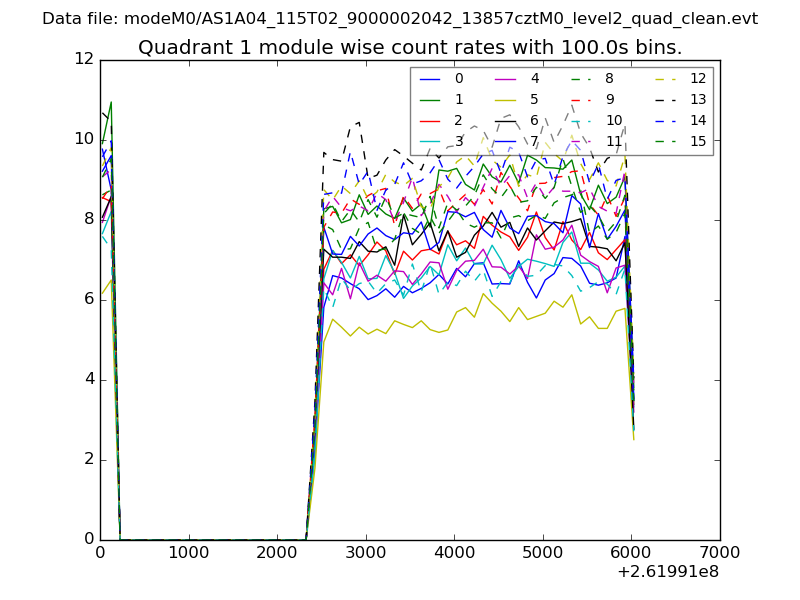
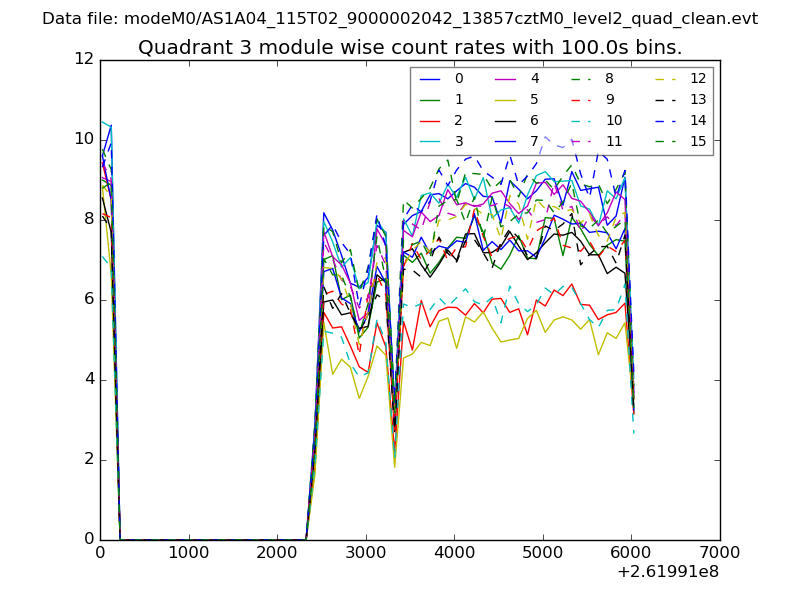
| Module-wise count rates for Quadrant A Data is divided into 100 sec bins |
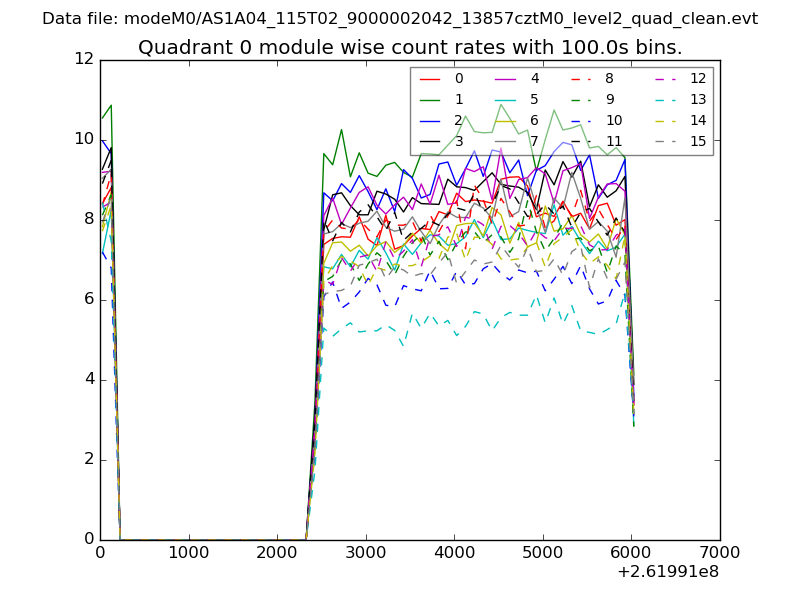 |
 |
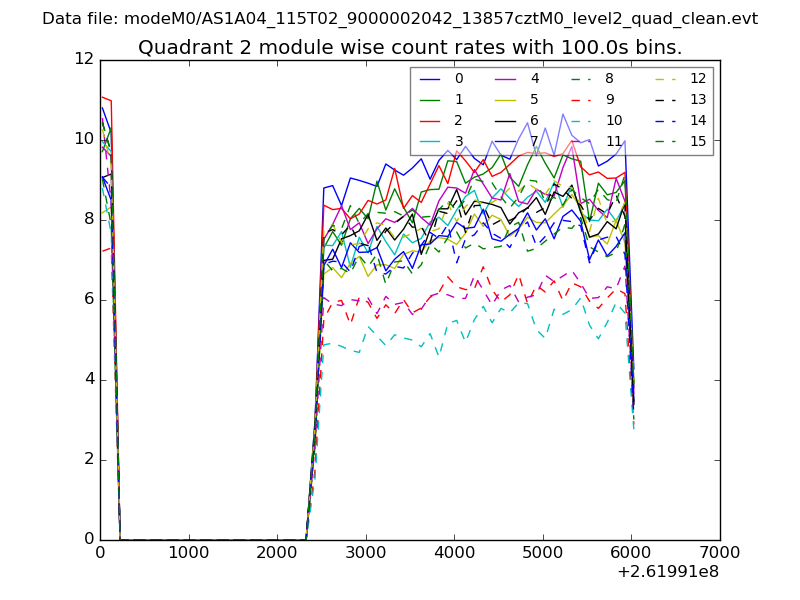
| Module-wise count rates for Quadrant B Data is divided into 100 sec bins |
 |
 |
| Module-wise count rates for Quadrant C Data is divided into 100 sec bins |
 |
 |
| Module-wise count rates for Quadrant D Data is divided into 100 sec bins |
 |
 |
| Parameter | Plot |
|---|---|
| CZT HV Monitor | 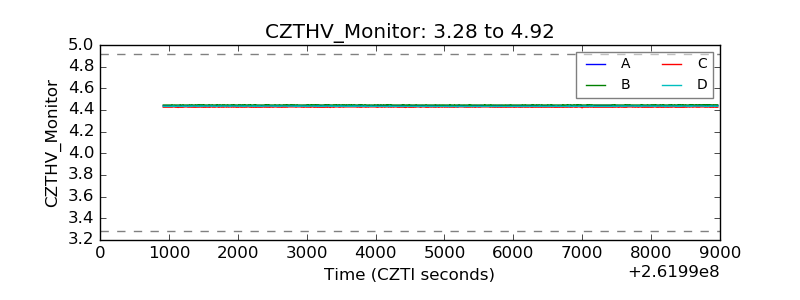 |
| D_VDD | 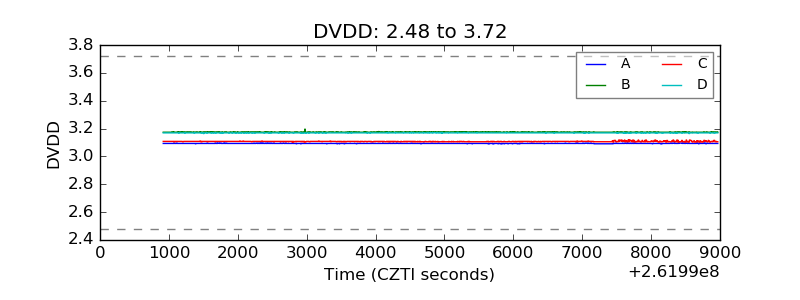 |
| Temperature 1 | 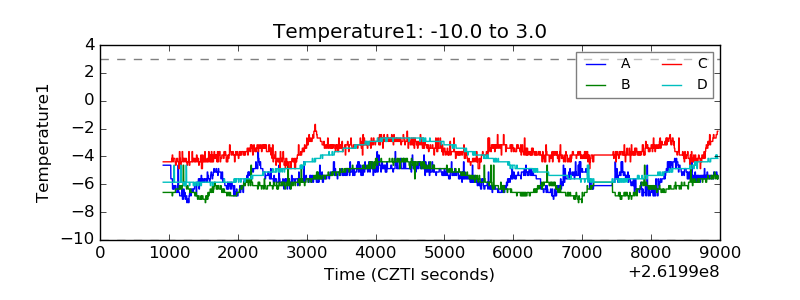 |
| Veto HV Monitor | 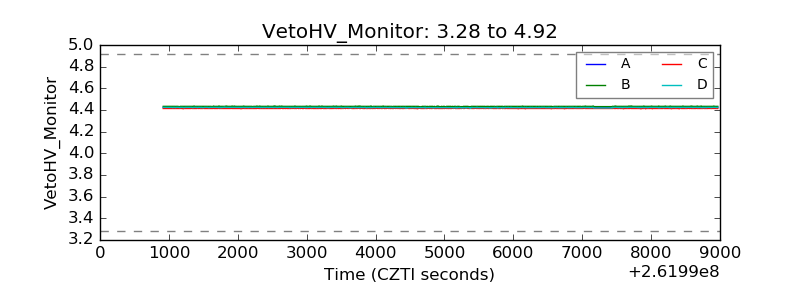 |
| Veto LLD | 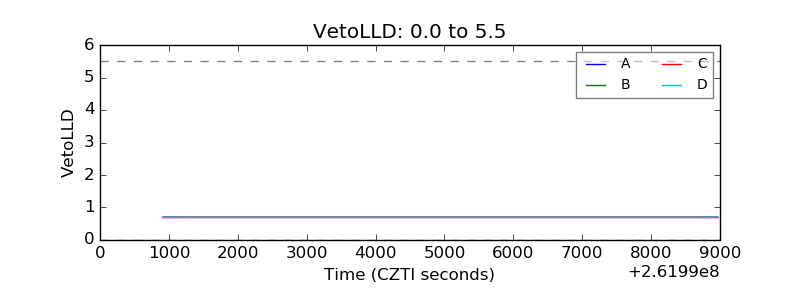 |
| Alpha Counter | 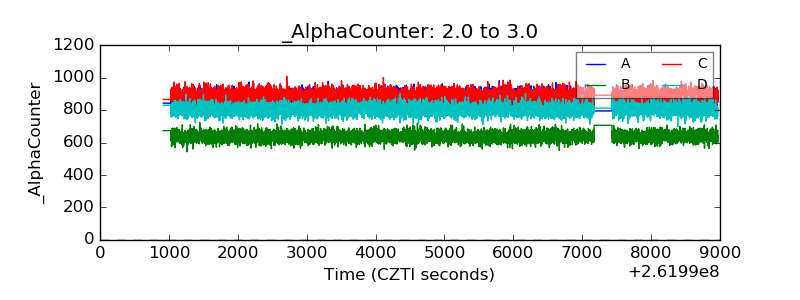 |
| _CPM_Rate | 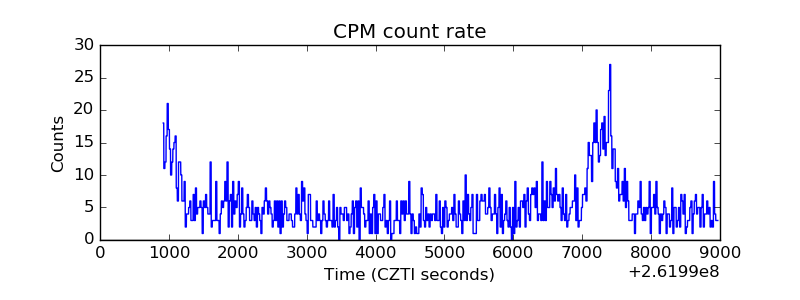 |
| CZT Counter | 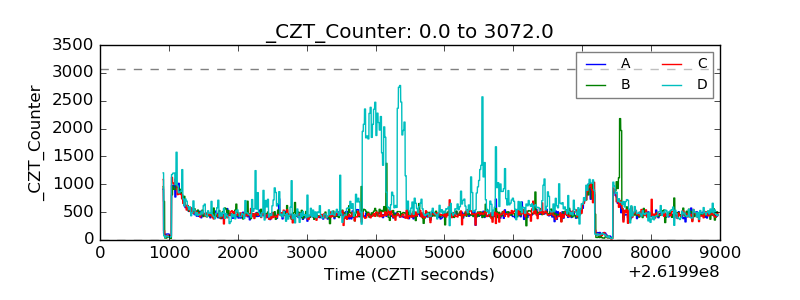 |
| +2.5 Volts monitor |  |
| +5 Volts monitor |  |
| _ROLL_ROT | 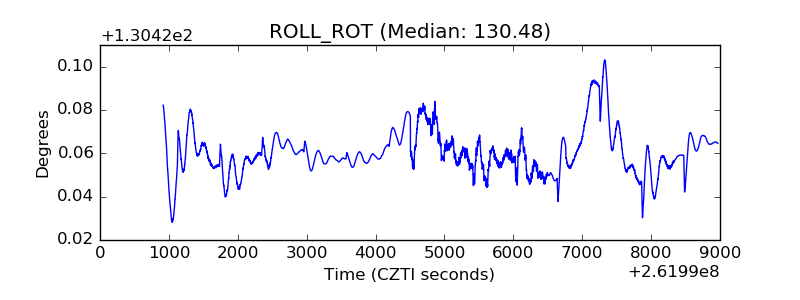 |
| _Roll_DEC | 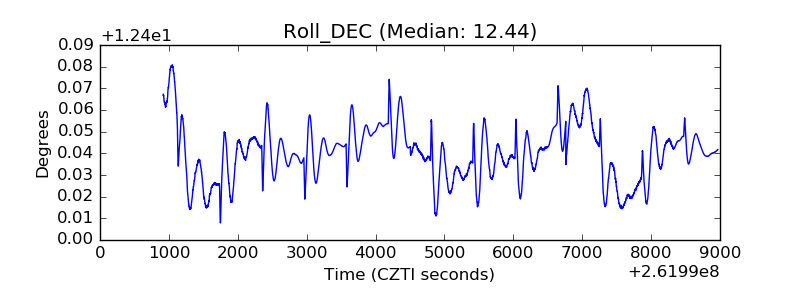 |
| _Roll_RA | 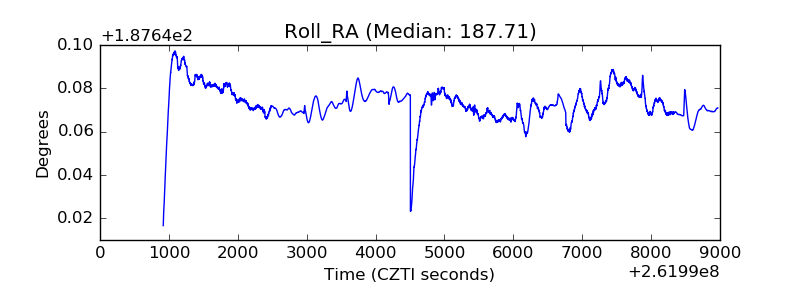 |
| Veto Counter | 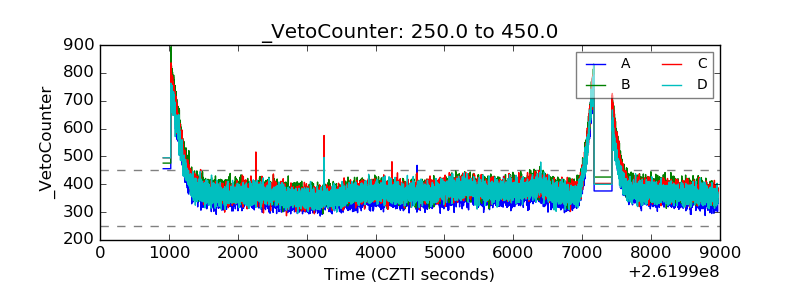 |