| Param | Original file | Final file |
|---|---|---|
| Filename | modeM0/AS1A04_115T02_9000002042_13863cztM0_level2.evt | modeM0/AS1A04_115T02_9000002042_13863cztM0_level2_quad_clean.evt |
| Size (bytes) | 563,806,080 | 103,357,440 |
| Size | 537.7 MB | 98.6 MB |
| Events in quadrant A | 3,956,993 | 667,260 |
| Events in quadrant B | 3,567,671 | 679,409 |
| Events in quadrant C | 3,526,625 | 668,112 |
| Events in quadrant D | 5,541,855 | 620,454 |
| Mode M9 | |||
|---|---|---|---|
| Quadrant | BADHDUFLAG | Total packets | Discarded packets |
| A | 0 | 20 | 0 |
| B | 0 | 20 | 0 |
| C | 0 | 20 | 0 |
| D | 0 | 20 | 0 |
| Mode M0 | |||
|---|---|---|---|
| Quadrant | BADHDUFLAG | Total packets | Discarded packets |
| A | 0 | 16429 | 3 |
| B | 0 | 15257 | 2 |
| C | 0 | 15066 | 2 |
| D | 0 | 21467 | 2 |
| Mode SS | |||
|---|---|---|---|
| Quadrant | BADHDUFLAG | Total packets | Discarded packets |
| A | 0 | 146 | 0 |
| B | 0 | 146 | 0 |
| C | 0 | 146 | 0 |
| D | 0 | 146 | 0 |
| Quadrant | Total seconds | Saturated seconds | Saturation percentage |
|---|---|---|---|
| A | 7107 | 111 | 1.561840% |
| B | 7107 | 100 | 1.407063% |
| C | 7107 | 84 | 1.181933% |
| D | 7107 | 565 | 7.949909% |
Noise dominated data is calculated using 1-second bins in cleaned event files. If a bin has >2000 counts, and if more than 50% of those come from <1% of pixels, then it is considered to be noise-dominated and hence unusable.
| Quadrant | # 1 sec bins | Bins with >0 counts | Bins with >2000 counts | High rate bins dominated by noise | Noise dominated (total time) | Noise dominated (detector-on time) | Marked lightcurve |
|---|---|---|---|---|---|---|---|
| A | 9113 | 7108 | 0 | 0 | 0.00% | 0.00% | 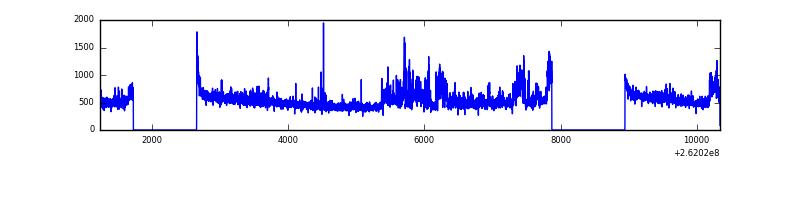 |
| B | 9113 | 7108 | 7 | 7 | 0.08% | 0.10% | 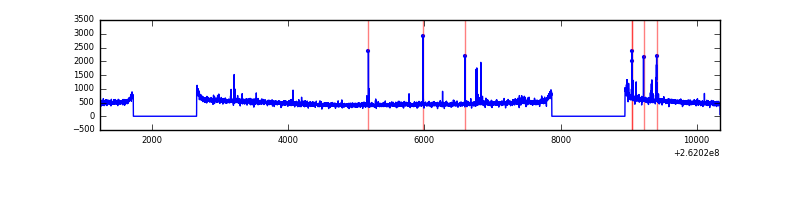 |
| C | 9113 | 7108 | 3 | 3 | 0.03% | 0.04% | 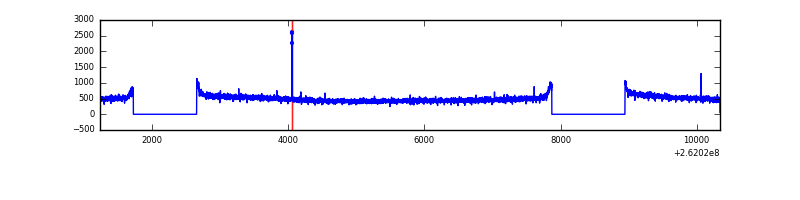 |
| D | 9113 | 7108 | 486 | 486 | 5.33% | 6.84% | 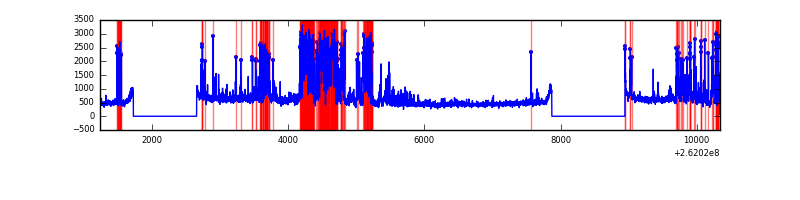 |
Top three noisy pixels from each quadrant. If the there are fewer than three noisy pixels in the level2.evt file, extra rows are filled as -1
| Pixel properties | Quadrant properties | ||||||
|---|---|---|---|---|---|---|---|
| Quadrant | DetID | PixID | Counts | Sigma | Mean | Median | Sigma |
| A | 0 | 23 | 474004 | 2609.34 | 894 | 874 | 181.3 |
| A | 0 | 226 | 37849 | 203.92 | 894 | 874 | 181.3 |
| A | 1 | 162 | 11342 | 57.73 | 894 | 874 | 181.3 |
| B | 4 | 80 | 47012 | 271.23 | 888 | 866 | 170.1 |
| B | 0 | 214 | 29365 | 167.5 | 888 | 866 | 170.1 |
| B | 12 | 111 | 20570 | 115.81 | 888 | 866 | 170.1 |
| C | 3 | 233 | 105498 | 518.51 | 875 | 878 | 201.8 |
| C | 14 | 234 | 11261 | 51.46 | 875 | 878 | 201.8 |
| C | 13 | 61 | 6117 | 25.97 | 875 | 878 | 201.8 |
| D | 10 | 157 | 1552073 | 7660.42 | 853 | 836 | 202.5 |
| D | 13 | 189 | 296152 | 1458.35 | 853 | 836 | 202.5 |
| D | 5 | 222 | 195763 | 962.6 | 853 | 836 | 202.5 |
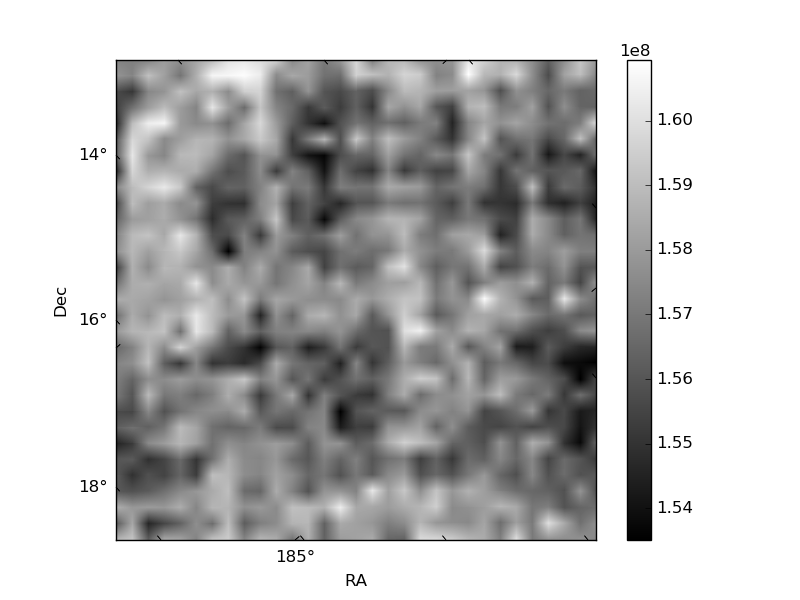
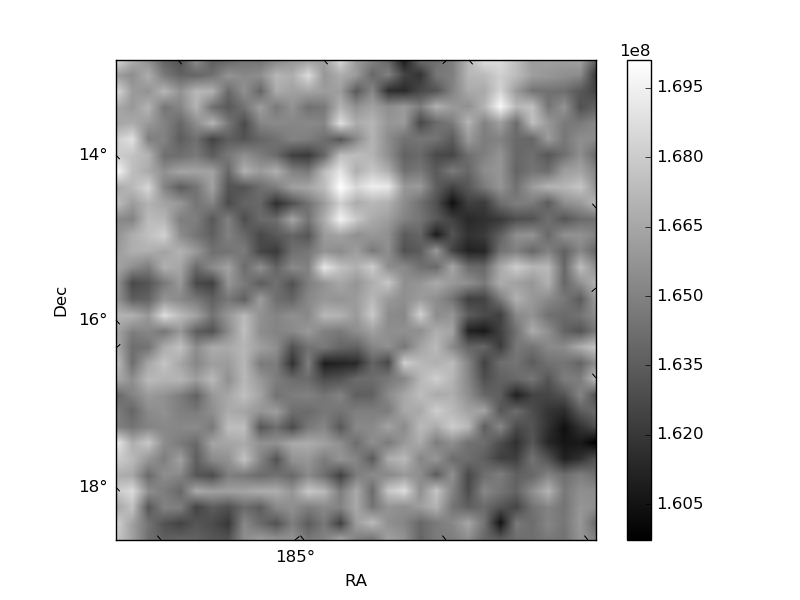
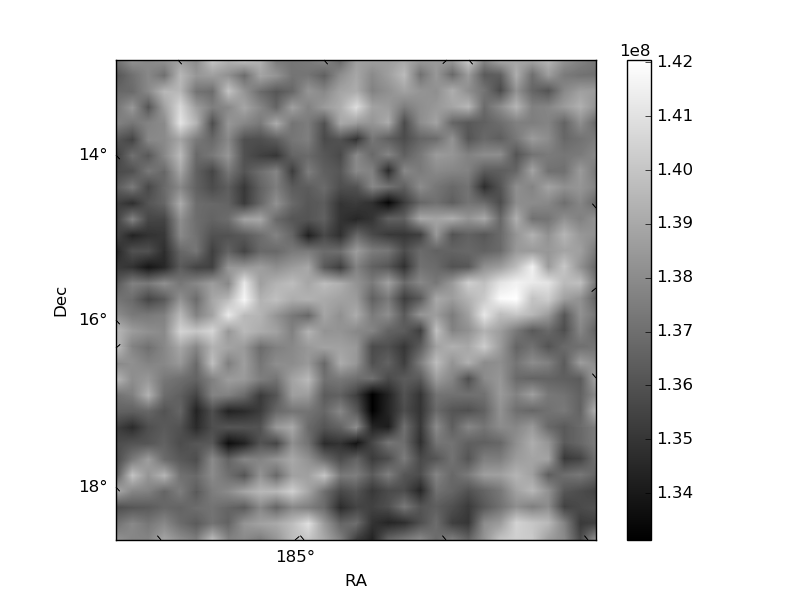
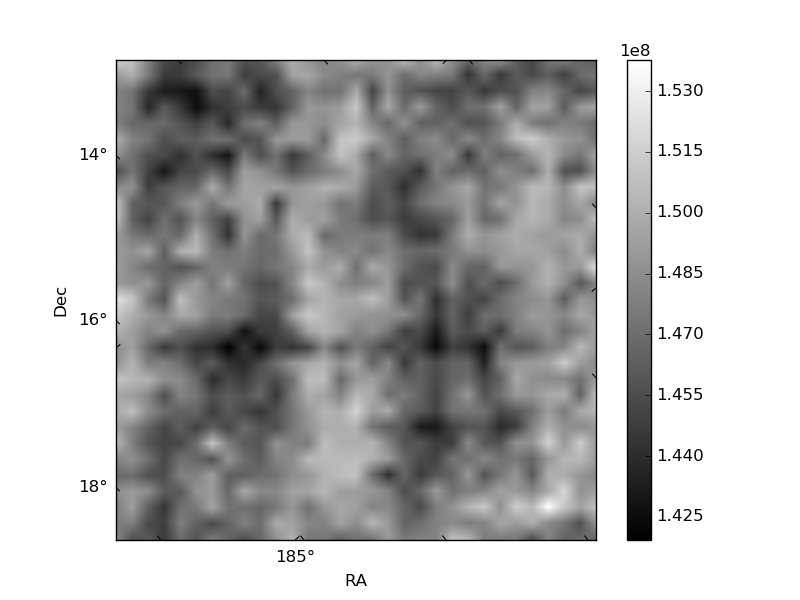
Histogram calculated using DETX and DETY for each event in the final _common_clean file
| Quadrant A | 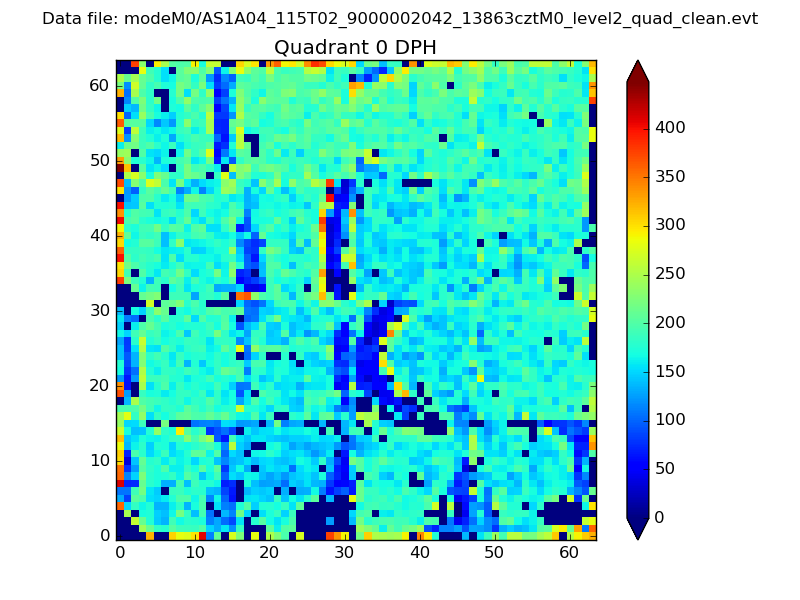 |
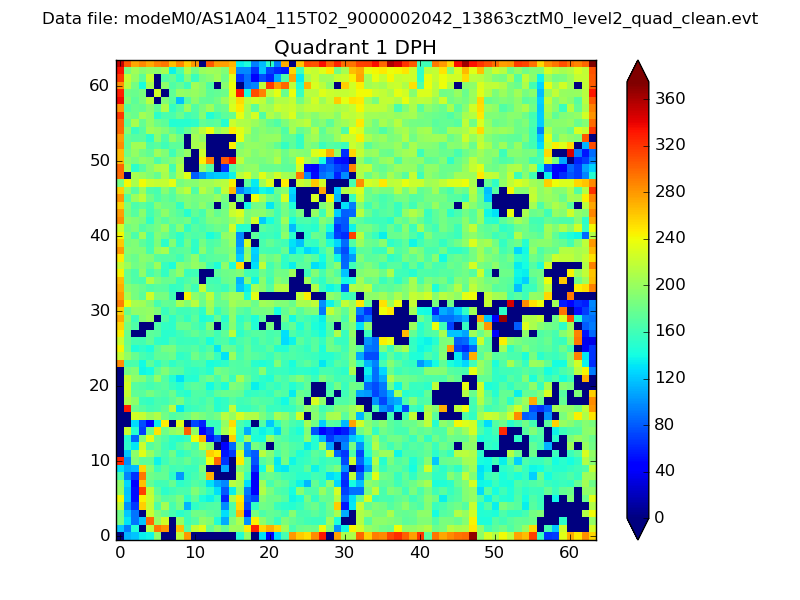 |
Quadrant B |
|---|---|---|---|
| Quadrant D | 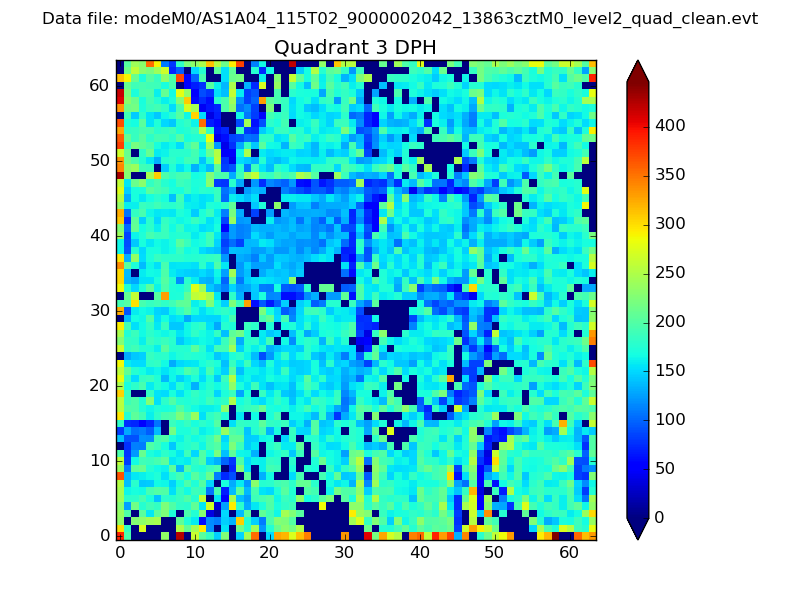 |
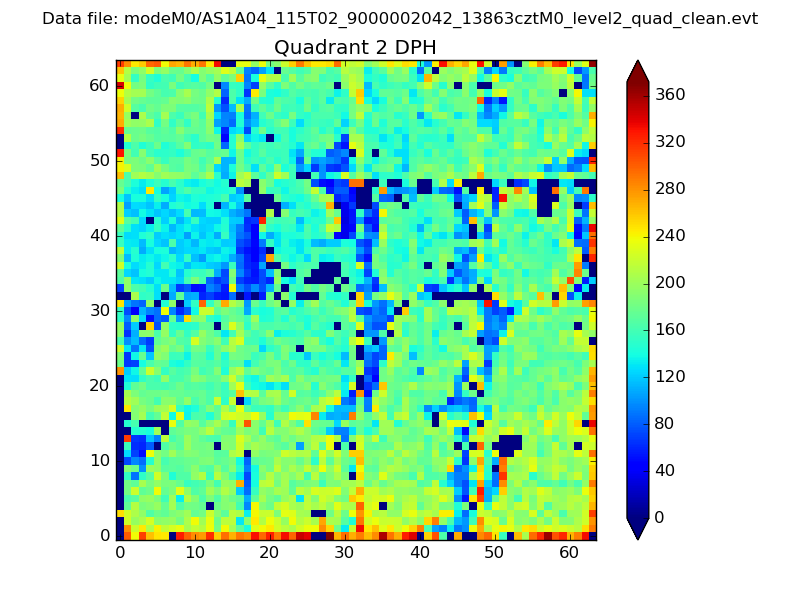 |
Quadrant C |
| Plot type | Count rate plots | Images |
|---|---|---|
| Comparison with Poisson distribution Blue bars denote a histogram of data divided into 1 sec bins. Red curve is a Poisson curve with rate = median count rate of data. |
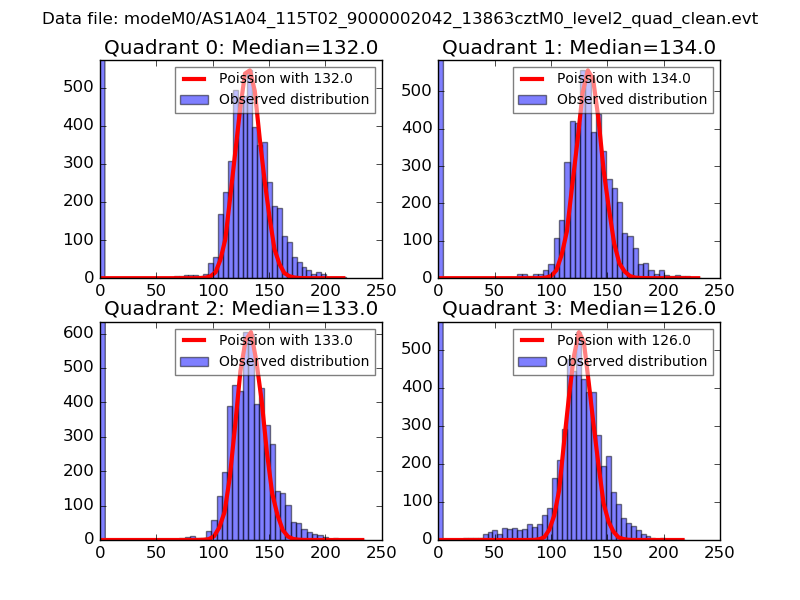 |
 |
| Quadrant-wise count rates Data is divided into 100 sec bins |
 |
|
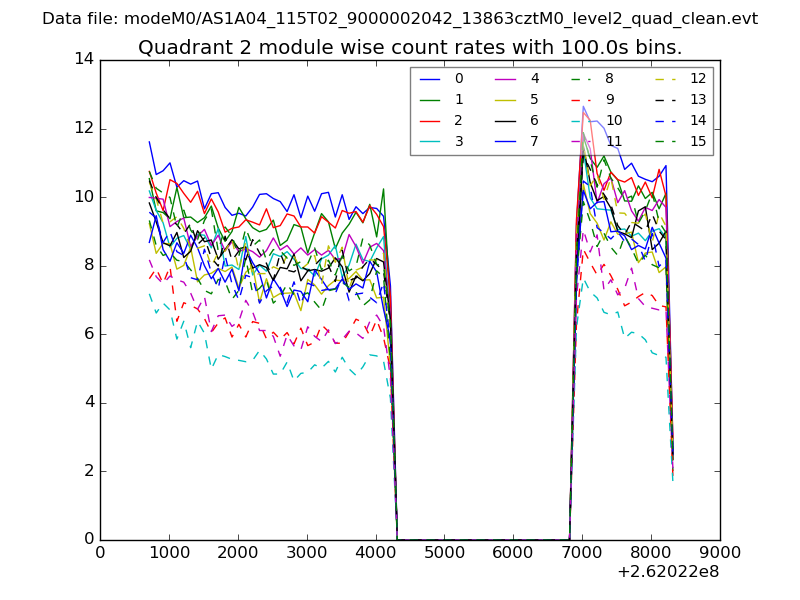
| Module-wise count rates for Quadrant A Data is divided into 100 sec bins |
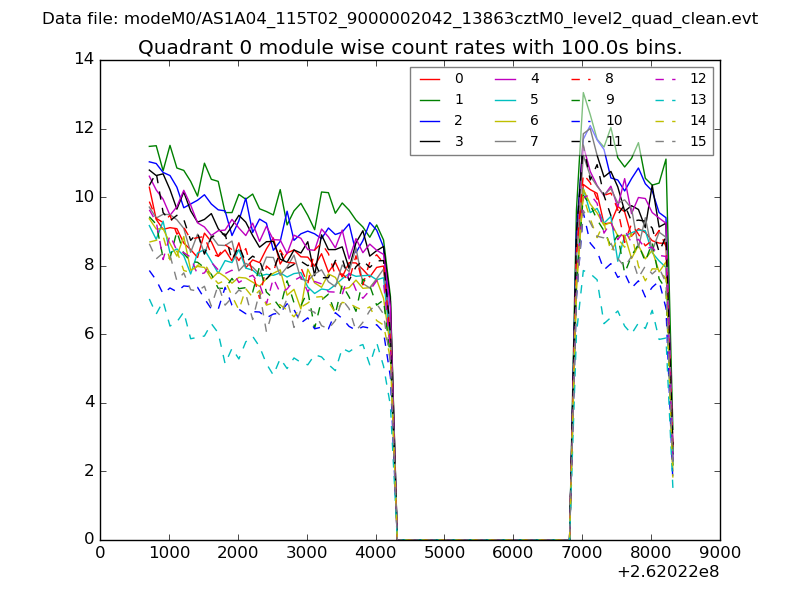 |
 |
| Module-wise count rates for Quadrant B Data is divided into 100 sec bins |
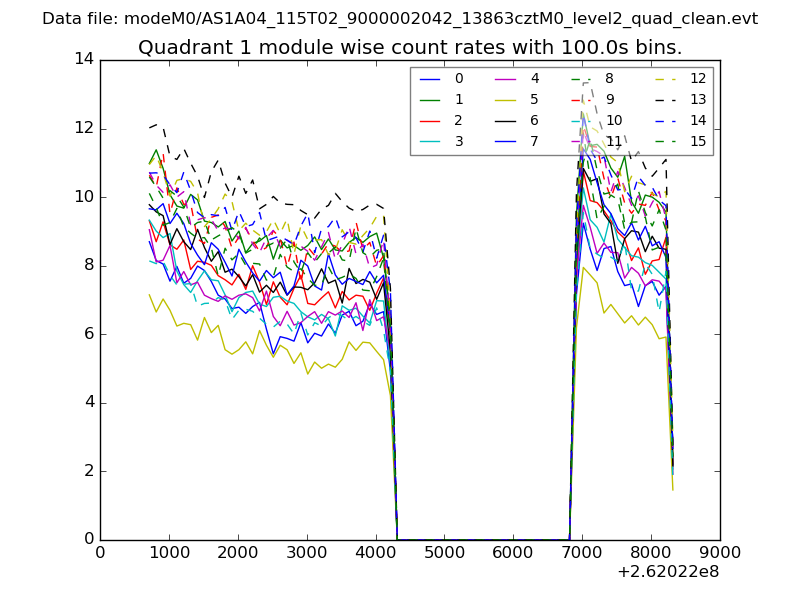 |
 |
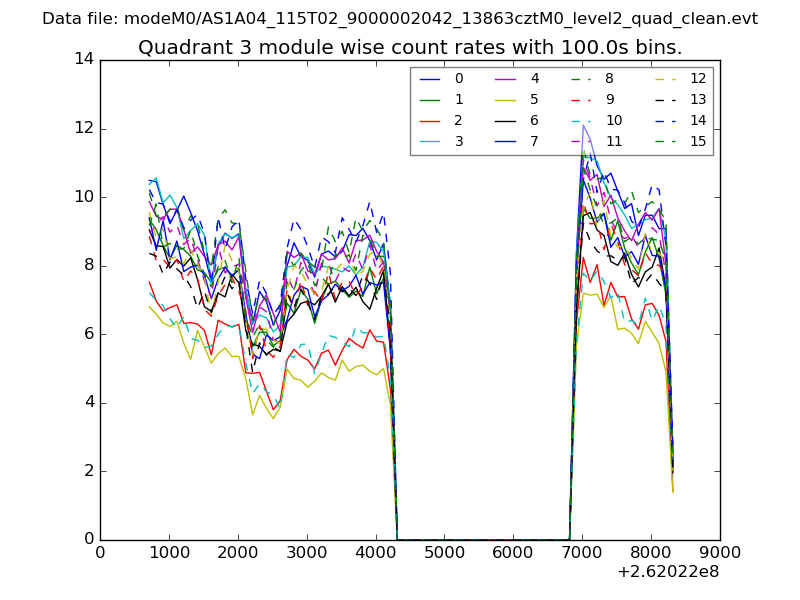
| Module-wise count rates for Quadrant C Data is divided into 100 sec bins |
 |
 |
| Module-wise count rates for Quadrant D Data is divided into 100 sec bins |
 |
 |
| Parameter | Plot |
|---|---|
| CZT HV Monitor | 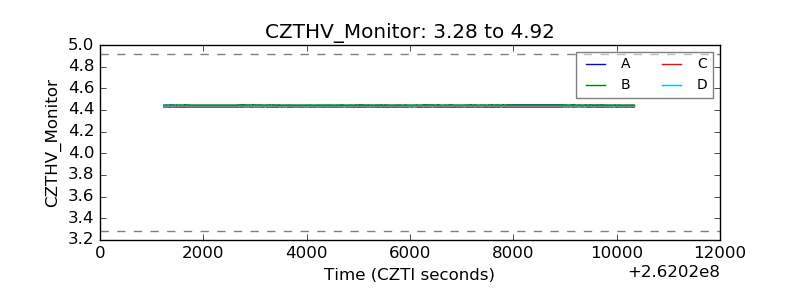 |
| D_VDD | 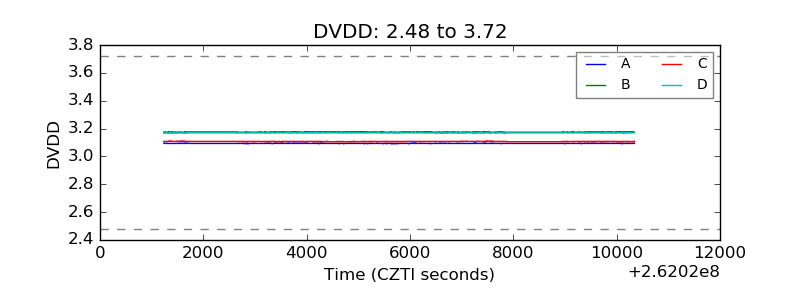 |
| Temperature 1 | 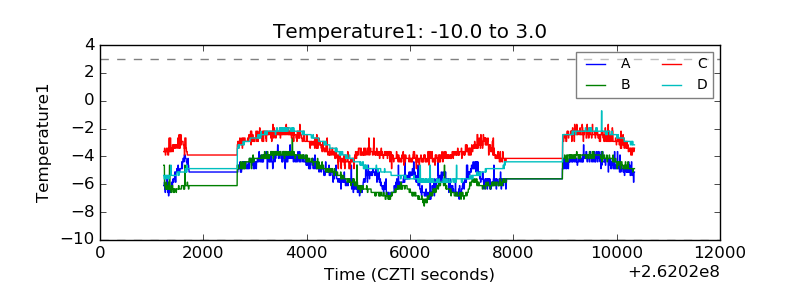 |
| Veto HV Monitor | 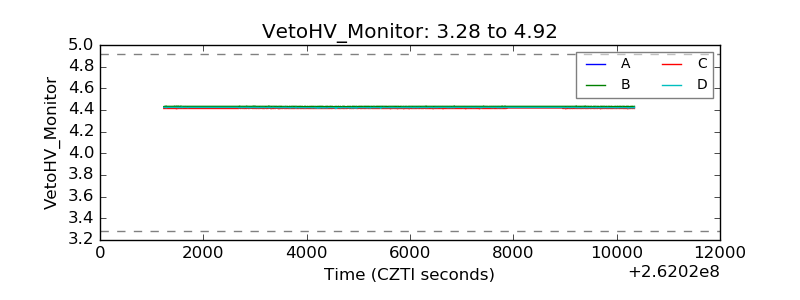 |
| Veto LLD | 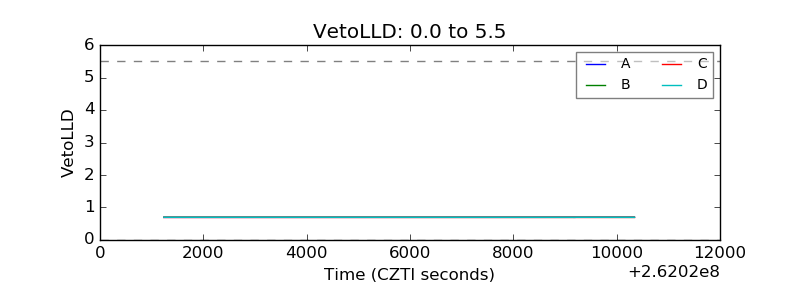 |
| Alpha Counter | 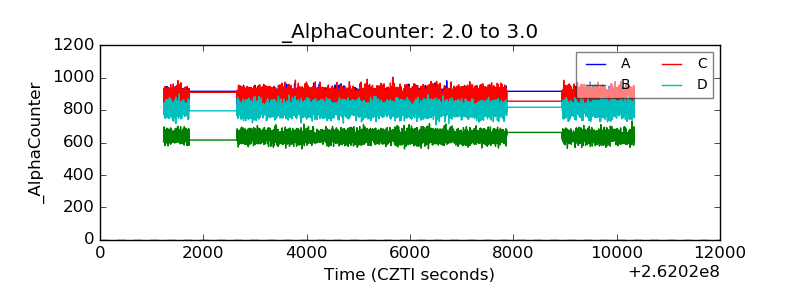 |
| _CPM_Rate | 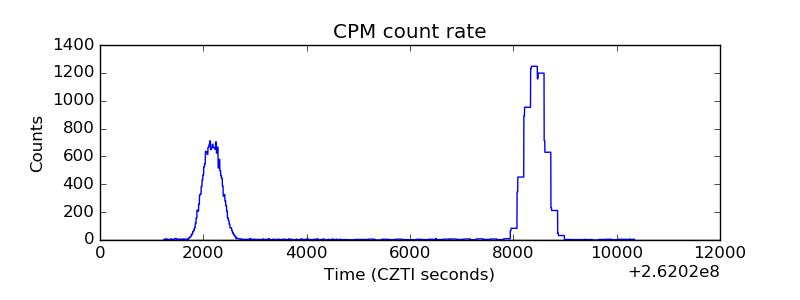 |
| CZT Counter |  |
| +2.5 Volts monitor |  |
| +5 Volts monitor |  |
| _ROLL_ROT | 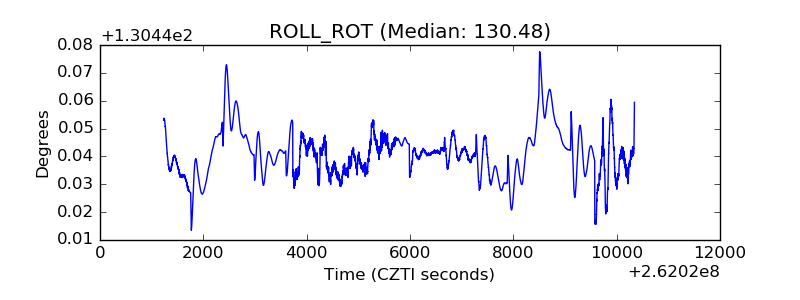 |
| _Roll_DEC | 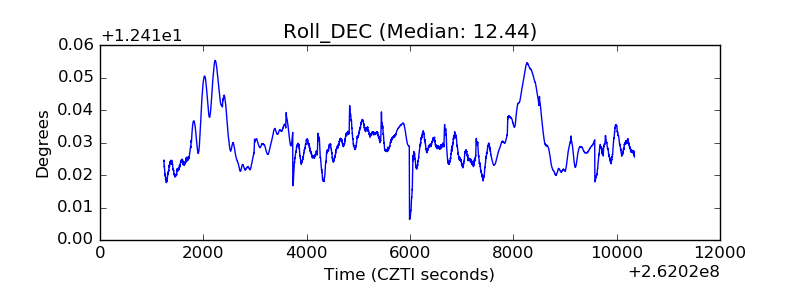 |
| _Roll_RA | 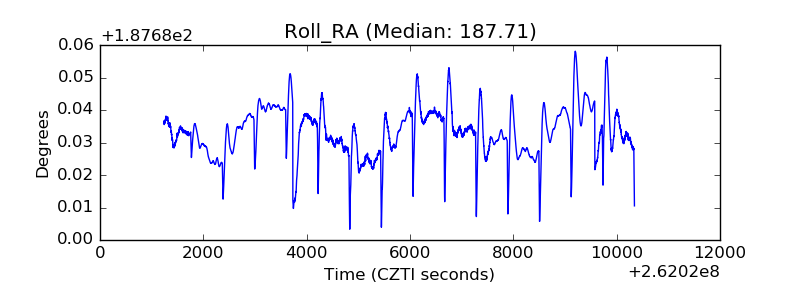 |
| Veto Counter | 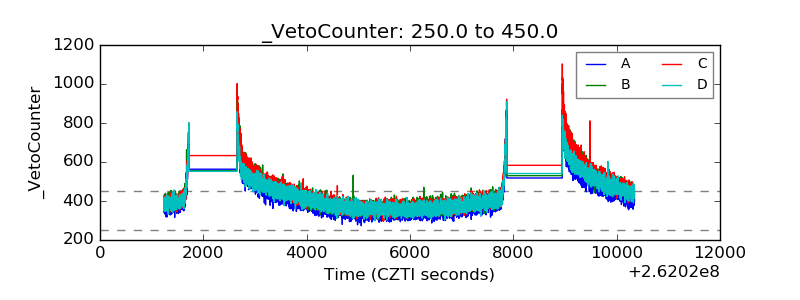 |