| Param | Original file | Final file |
|---|---|---|
| Filename | modeM0/AS1A04_115T02_9000002042_13865cztM0_level2.evt | modeM0/AS1A04_115T02_9000002042_13865cztM0_level2_quad_clean.evt |
| Size (bytes) | 620,360,640 | 92,128,320 |
| Size | 591.6 MB | 87.9 MB |
| Events in quadrant A | 3,421,396 | 591,672 |
| Events in quadrant B | 3,385,322 | 603,676 |
| Events in quadrant C | 3,312,796 | 597,305 |
| Events in quadrant D | 8,226,288 | 541,576 |
| Mode M9 | |||
|---|---|---|---|
| Quadrant | BADHDUFLAG | Total packets | Discarded packets |
| A | 0 | 24 | 0 |
| B | 0 | 24 | 0 |
| C | 0 | 24 | 0 |
| D | 0 | 24 | 0 |
| Mode M0 | |||
|---|---|---|---|
| Quadrant | BADHDUFLAG | Total packets | Discarded packets |
| A | 0 | 14377 | 3 |
| B | 0 | 14145 | 2 |
| C | 0 | 13969 | 2 |
| D | 0 | 29016 | 2 |
| Mode SS | |||
|---|---|---|---|
| Quadrant | BADHDUFLAG | Total packets | Discarded packets |
| A | 0 | 136 | 0 |
| B | 0 | 136 | 0 |
| C | 0 | 136 | 0 |
| D | 0 | 136 | 0 |
| Quadrant | Total seconds | Saturated seconds | Saturation percentage |
|---|---|---|---|
| A | 6528 | 131 | 2.006740% |
| B | 6528 | 124 | 1.899510% |
| C | 6528 | 89 | 1.363358% |
| D | 6528 | 827 | 12.668505% |
Noise dominated data is calculated using 1-second bins in cleaned event files. If a bin has >2000 counts, and if more than 50% of those come from <1% of pixels, then it is considered to be noise-dominated and hence unusable.
| Quadrant | # 1 sec bins | Bins with >0 counts | Bins with >2000 counts | High rate bins dominated by noise | Noise dominated (total time) | Noise dominated (detector-on time) | Marked lightcurve |
|---|---|---|---|---|---|---|---|
| A | 8979 | 6529 | 0 | 0 | 0.00% | 0.00% | 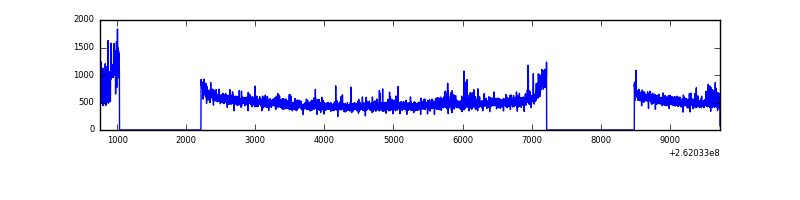 |
| B | 8979 | 6529 | 12 | 12 | 0.13% | 0.18% | 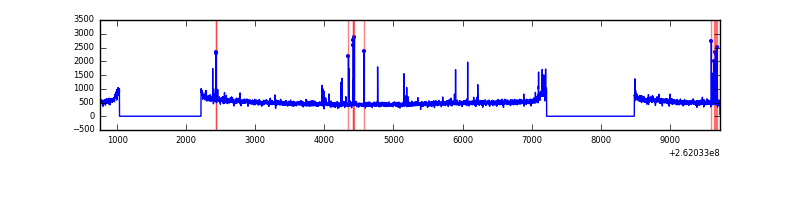 |
| C | 8979 | 6529 | 1 | 1 | 0.01% | 0.02% | 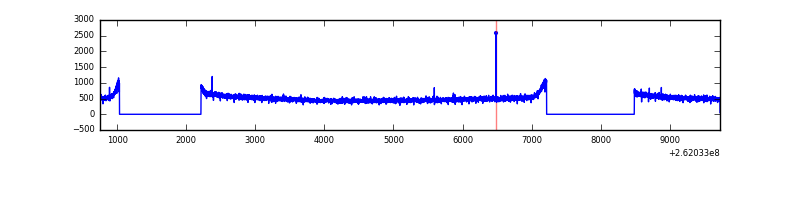 |
| D | 8979 | 6529 | 898 | 898 | 10.00% | 13.75% | 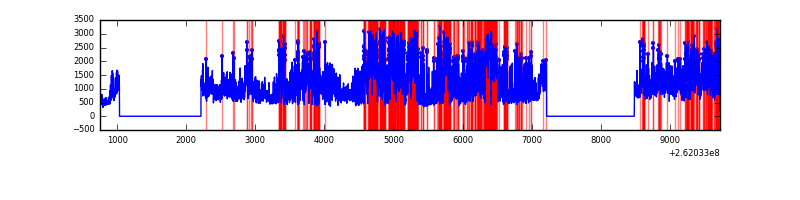 |
Top three noisy pixels from each quadrant. If the there are fewer than three noisy pixels in the level2.evt file, extra rows are filled as -1
| Pixel properties | Quadrant properties | ||||||
|---|---|---|---|---|---|---|---|
| Quadrant | DetID | PixID | Counts | Sigma | Mean | Median | Sigma |
| A | 0 | 23 | 158413 | 927.95 | 841 | 824 | 169.8 |
| A | 0 | 226 | 17045 | 95.52 | 841 | 824 | 169.8 |
| A | 1 | 162 | 12992 | 71.65 | 841 | 824 | 169.8 |
| B | 4 | 80 | 65478 | 405.64 | 840 | 821 | 159.4 |
| B | 4 | 48 | 21099 | 127.22 | 840 | 821 | 159.4 |
| B | 12 | 111 | 18761 | 112.55 | 840 | 821 | 159.4 |
| C | 3 | 233 | 77563 | 401.1 | 829 | 834 | 191.3 |
| C | 13 | 61 | 5842 | 26.18 | 829 | 834 | 191.3 |
| C | 14 | 234 | 4143 | 17.3 | 829 | 834 | 191.3 |
| D | 10 | 157 | 4994817 | 26501.01 | 794 | 778 | 188.4 |
| D | 13 | 189 | 99611 | 524.46 | 794 | 778 | 188.4 |
| D | 5 | 222 | 71739 | 376.56 | 794 | 778 | 188.4 |
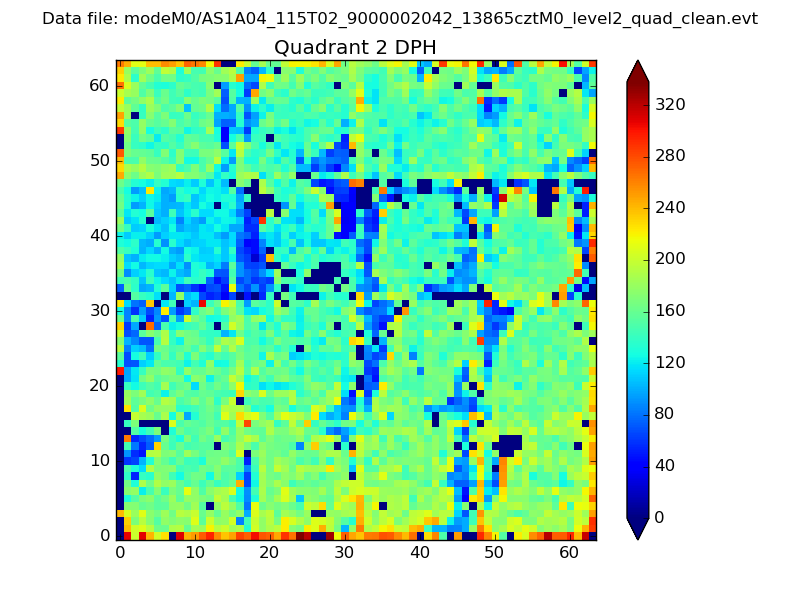
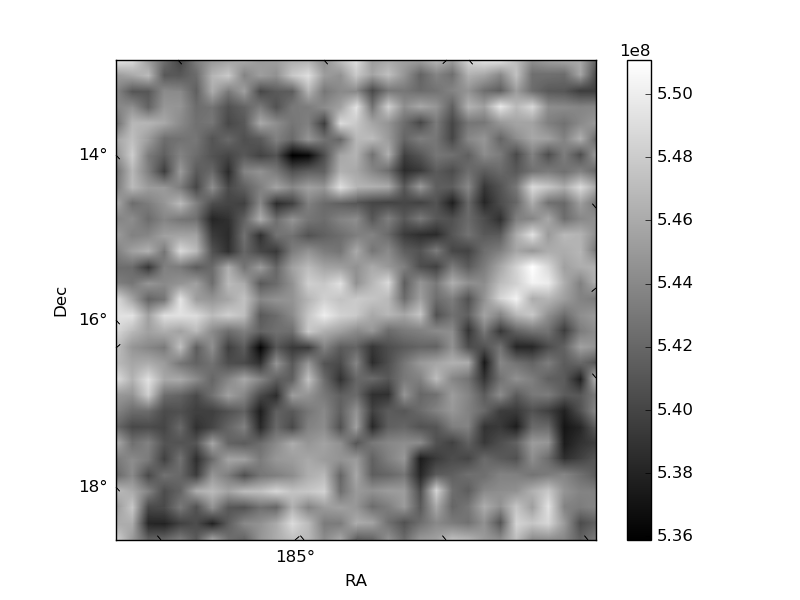
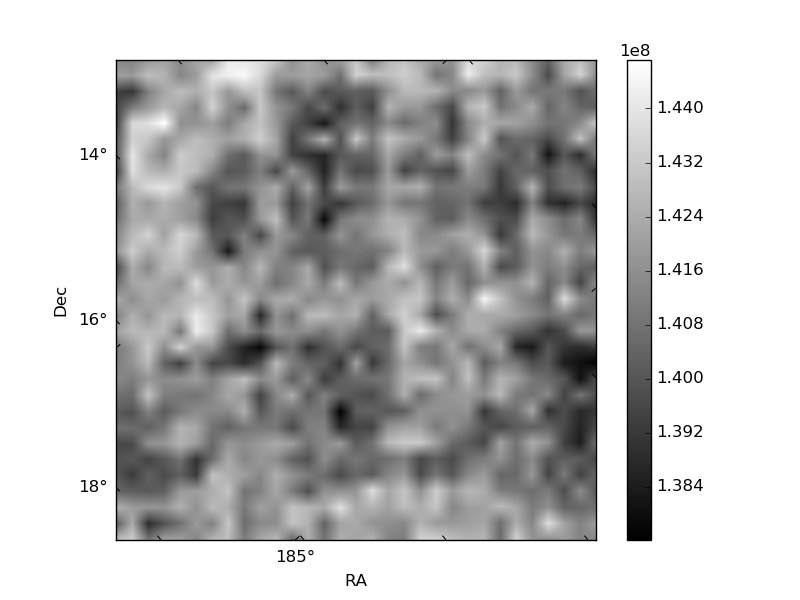
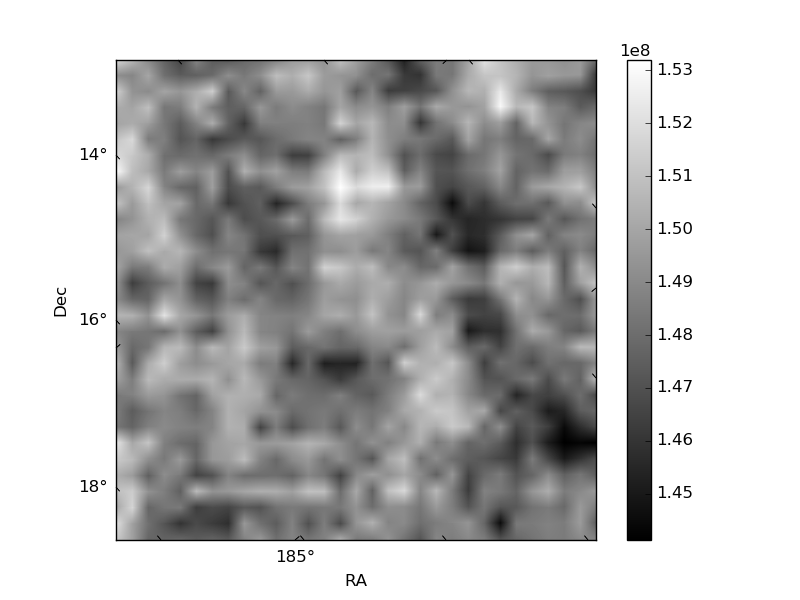
Histogram calculated using DETX and DETY for each event in the final _common_clean file
| Quadrant A | 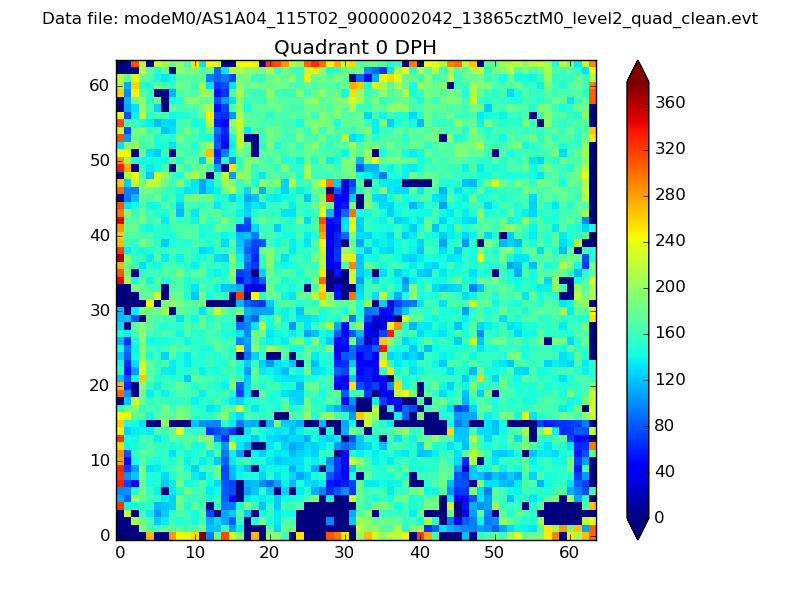 |
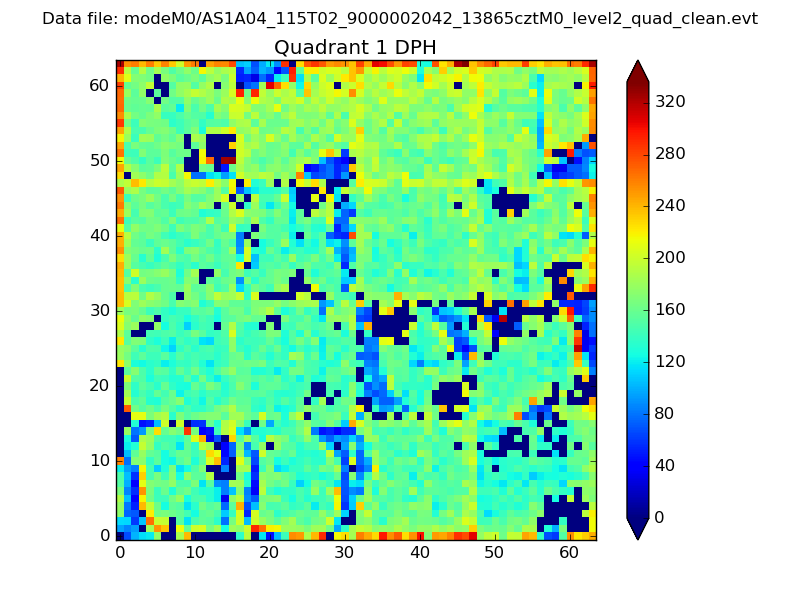 |
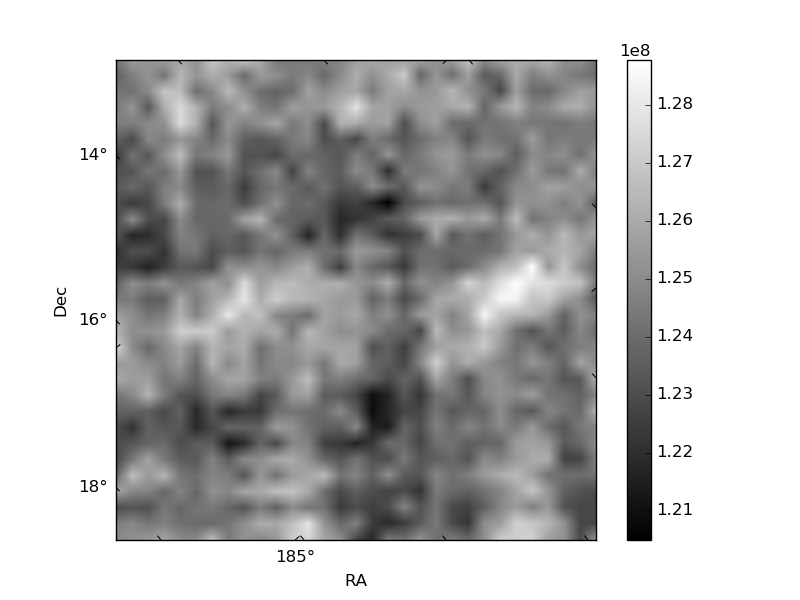
Quadrant B |
|---|---|---|---|
| Quadrant D | 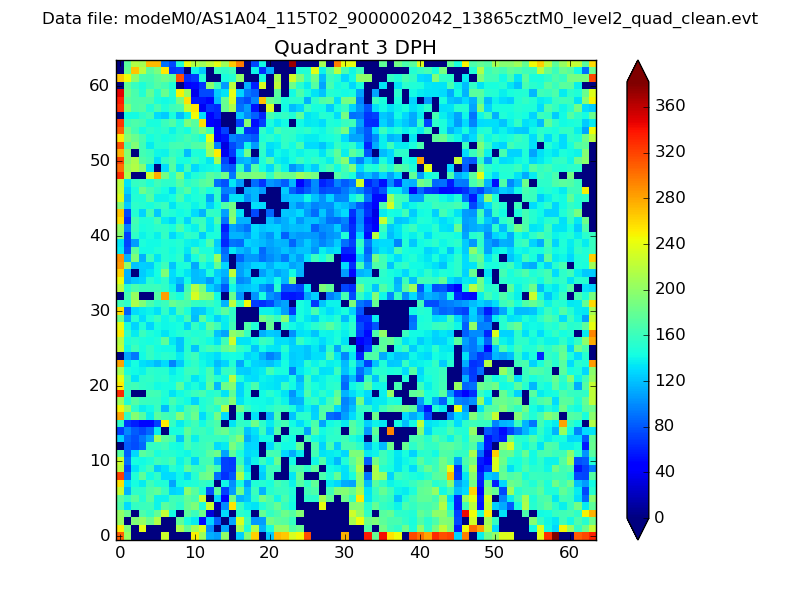 |
 |
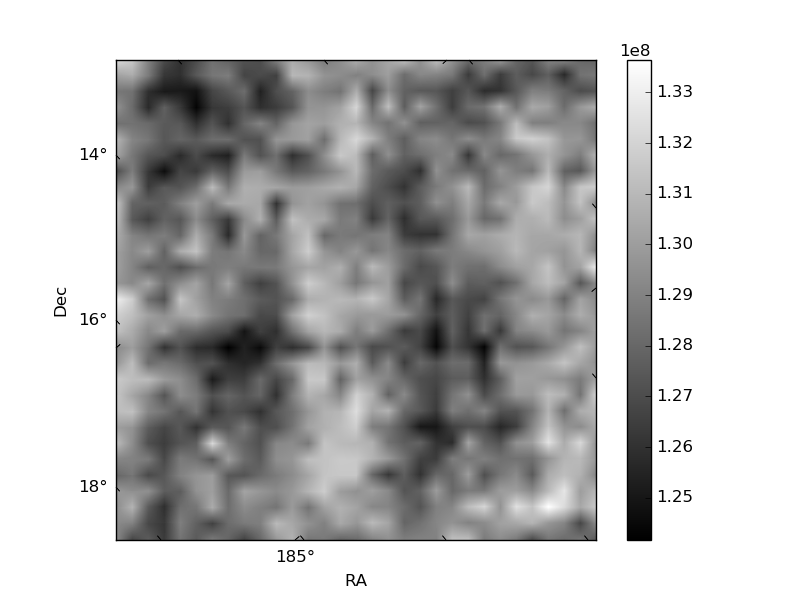
Quadrant C |
| Plot type | Count rate plots | Images |
|---|---|---|
| Comparison with Poisson distribution Blue bars denote a histogram of data divided into 1 sec bins. Red curve is a Poisson curve with rate = median count rate of data. |
 |
 |
| Quadrant-wise count rates Data is divided into 100 sec bins |
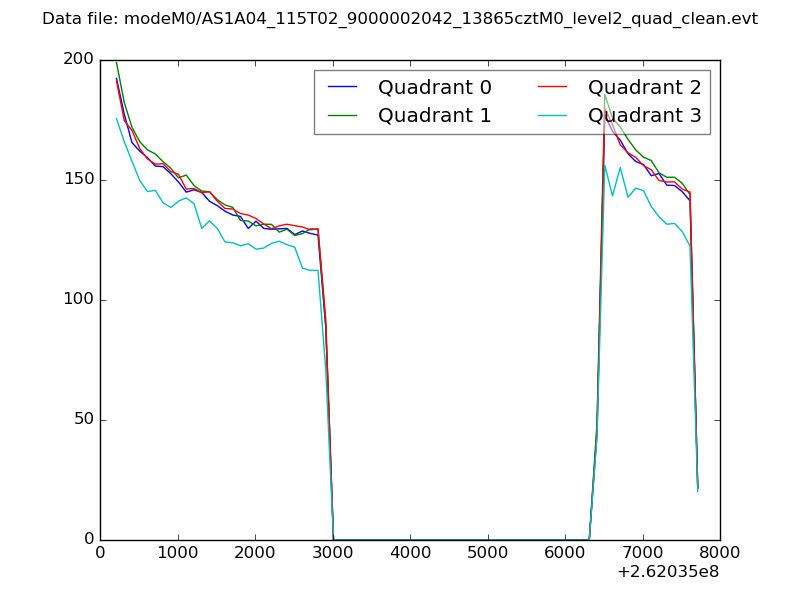 |
|
| Module-wise count rates for Quadrant A Data is divided into 100 sec bins |
 |
 |
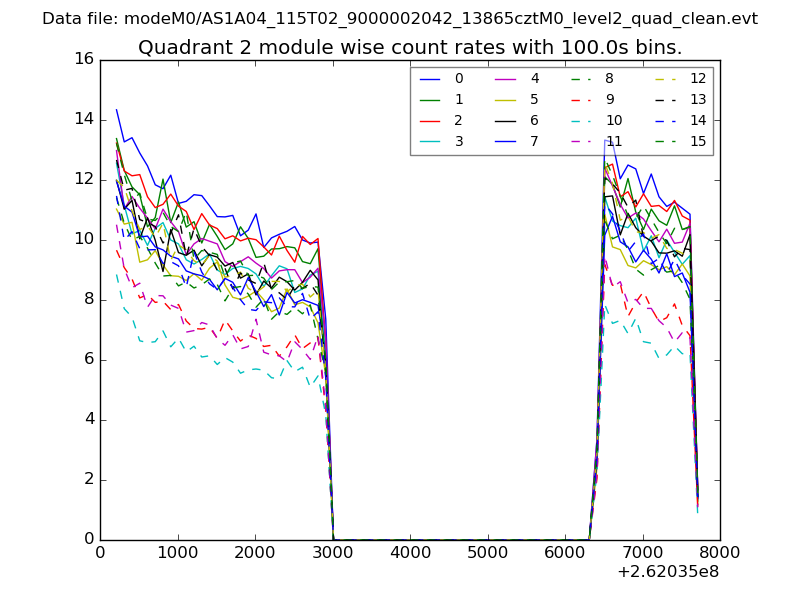
| Module-wise count rates for Quadrant B Data is divided into 100 sec bins |
 |
 |
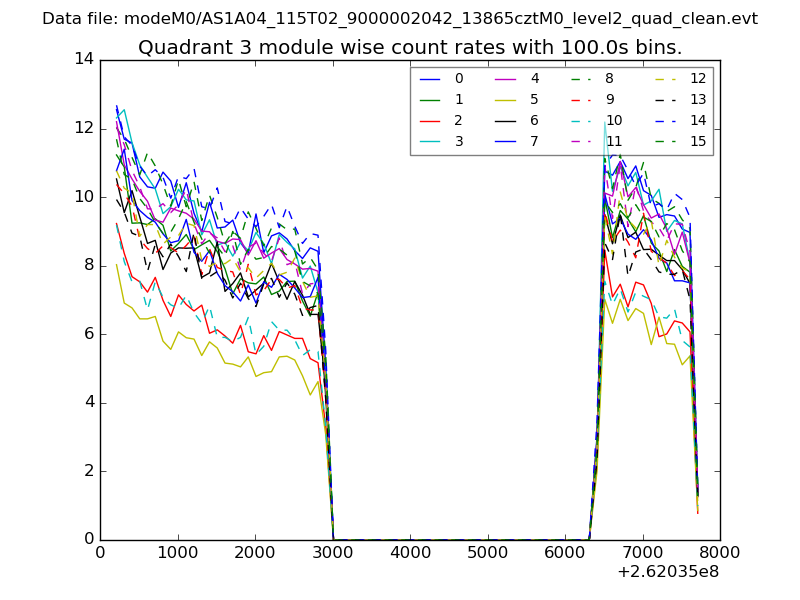
| Module-wise count rates for Quadrant C Data is divided into 100 sec bins |
 |
 |
| Module-wise count rates for Quadrant D Data is divided into 100 sec bins |
 |
 |
| Parameter | Plot |
|---|---|
| CZT HV Monitor |  |
| D_VDD | 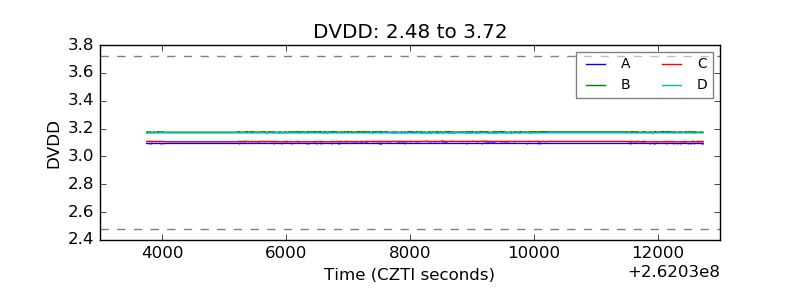 |
| Temperature 1 | 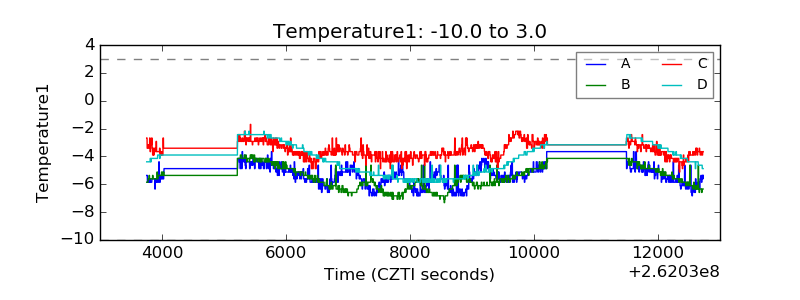 |
| Veto HV Monitor | 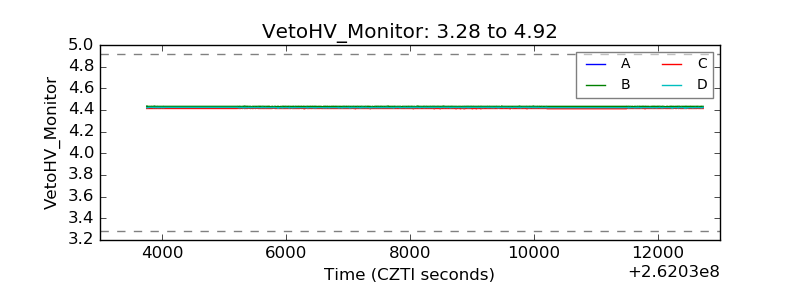 |
| Veto LLD | 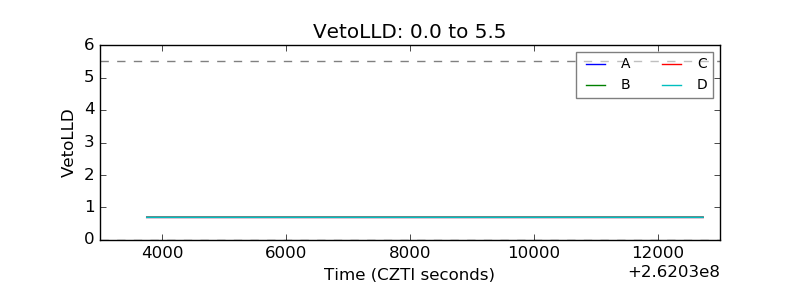 |
| Alpha Counter | 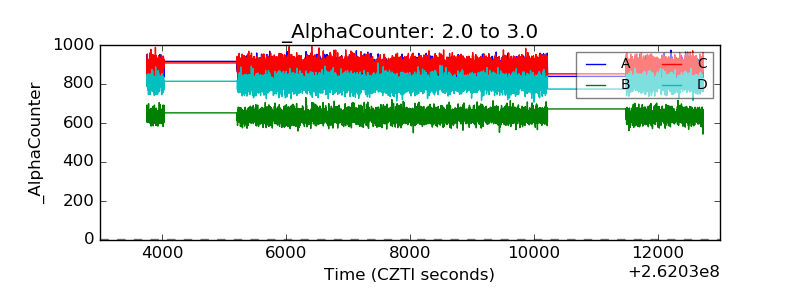 |
| _CPM_Rate | 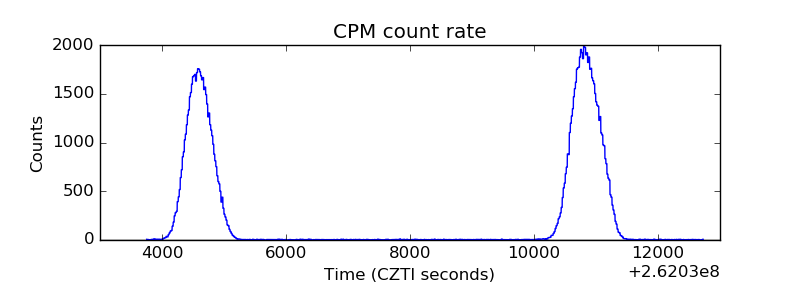 |
| CZT Counter | 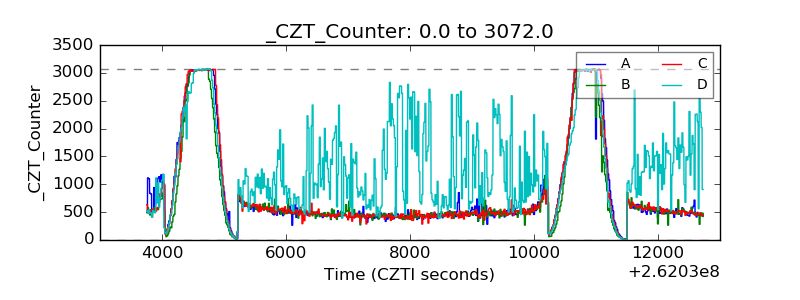 |
| +2.5 Volts monitor |  |
| +5 Volts monitor | 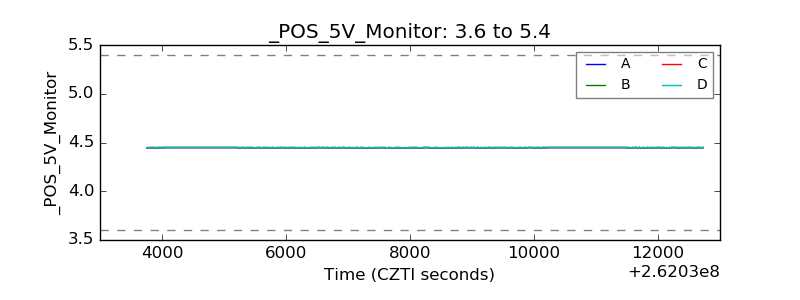 |
| _ROLL_ROT | 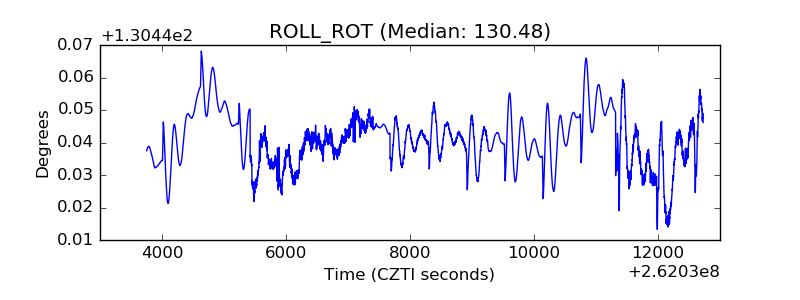 |
| _Roll_DEC | 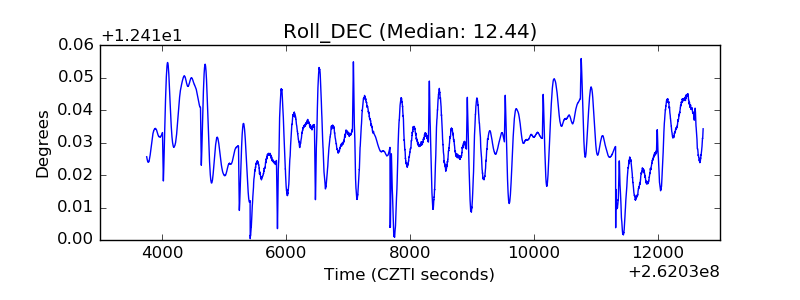 |
| _Roll_RA | 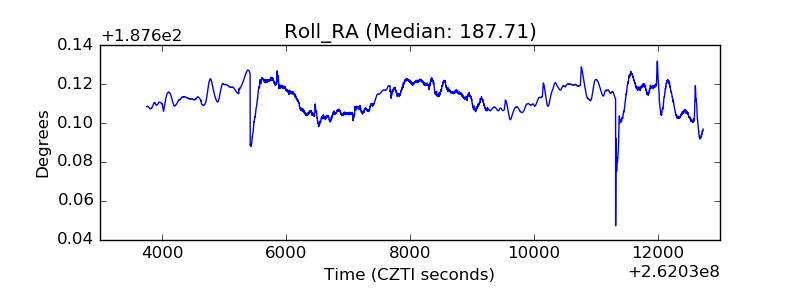 |
| Veto Counter | 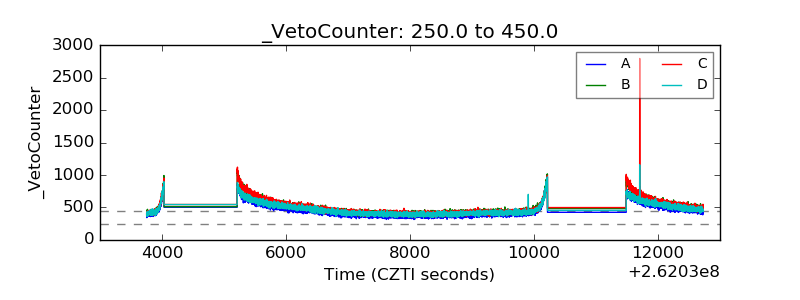 |