| Param | Original file | Final file |
|---|---|---|
| Filename | modeM0/AS1A04_115T02_9000002042_13867cztM0_level2.evt | modeM0/AS1A04_115T02_9000002042_13867cztM0_level2_quad_clean.evt |
| Size (bytes) | 483,834,240 | 87,615,360 |
| Size | 461.4 MB | 83.6 MB |
| Events in quadrant A | 4,049,201 | 550,320 |
| Events in quadrant B | 3,229,695 | 574,783 |
| Events in quadrant C | 3,038,967 | 562,601 |
| Events in quadrant D | 3,913,900 | 532,096 |
| Mode M9 | |||
|---|---|---|---|
| Quadrant | BADHDUFLAG | Total packets | Discarded packets |
| A | 0 | 25 | 0 |
| B | 0 | 25 | 0 |
| C | 0 | 25 | 0 |
| D | 0 | 25 | 0 |
| Mode M0 | |||
|---|---|---|---|
| Quadrant | BADHDUFLAG | Total packets | Discarded packets |
| A | 0 | 16117 | 3 |
| B | 0 | 13372 | 2 |
| C | 0 | 12938 | 2 |
| D | 0 | 15749 | 2 |
| Mode SS | |||
|---|---|---|---|
| Quadrant | BADHDUFLAG | Total packets | Discarded packets |
| A | 0 | 128 | 0 |
| B | 0 | 128 | 0 |
| C | 0 | 128 | 0 |
| D | 0 | 128 | 0 |
| Quadrant | Total seconds | Saturated seconds | Saturation percentage |
|---|---|---|---|
| A | 6210 | 148 | 2.383253% |
| B | 6210 | 92 | 1.481481% |
| C | 6210 | 43 | 0.692432% |
| D | 6210 | 84 | 1.352657% |
Noise dominated data is calculated using 1-second bins in cleaned event files. If a bin has >2000 counts, and if more than 50% of those come from <1% of pixels, then it is considered to be noise-dominated and hence unusable.
| Quadrant | # 1 sec bins | Bins with >0 counts | Bins with >2000 counts | High rate bins dominated by noise | Noise dominated (total time) | Noise dominated (detector-on time) | Marked lightcurve |
|---|---|---|---|---|---|---|---|
| A | 8771 | 6212 | 105 | 105 | 1.20% | 1.69% | 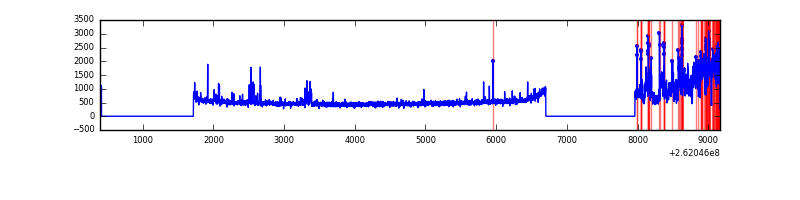 |
| B | 8771 | 6211 | 11 | 11 | 0.13% | 0.18% | 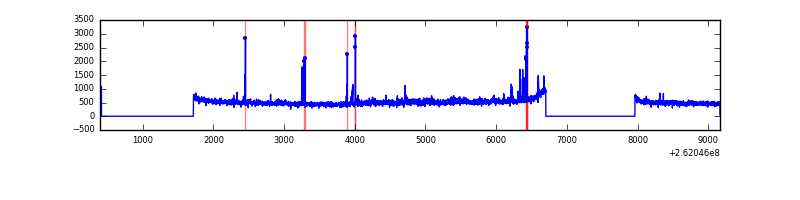 |
| C | 8771 | 6213 | 0 | 0 | 0.00% | 0.00% | 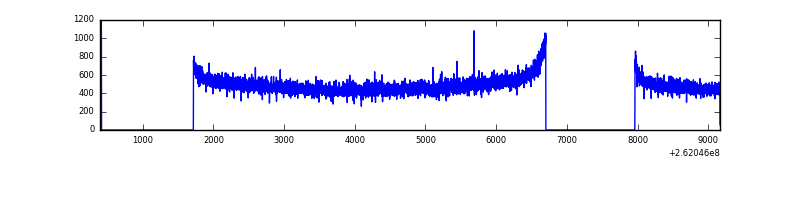 |
| D | 8771 | 6212 | 59 | 59 | 0.67% | 0.95% | 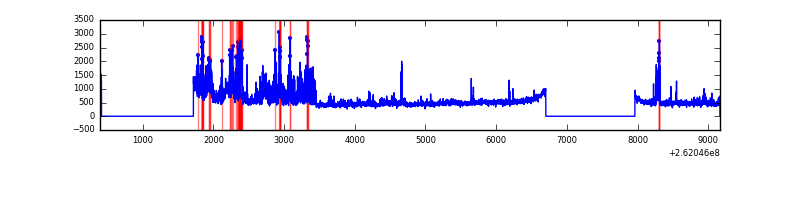 |
Top three noisy pixels from each quadrant. If the there are fewer than three noisy pixels in the level2.evt file, extra rows are filled as -1
| Pixel properties | Quadrant properties | ||||||
|---|---|---|---|---|---|---|---|
| Quadrant | DetID | PixID | Counts | Sigma | Mean | Median | Sigma |
| A | 0 | 23 | 1001128 | 6375.06 | 774 | 758 | 156.9 |
| A | 0 | 226 | 68314 | 430.51 | 774 | 758 | 156.9 |
| A | 1 | 162 | 8967 | 52.31 | 774 | 758 | 156.9 |
| B | 0 | 214 | 119633 | 804.37 | 778 | 761 | 147.8 |
| B | 4 | 80 | 60462 | 403.98 | 778 | 761 | 147.8 |
| B | 12 | 111 | 17694 | 114.58 | 778 | 761 | 147.8 |
| C | 3 | 233 | 90483 | 509.24 | 756 | 761 | 176.2 |
| C | 13 | 61 | 5389 | 26.26 | 756 | 761 | 176.2 |
| C | 3 | 202 | 1705 | 5.36 | 756 | 761 | 176.2 |
| D | 10 | 157 | 753763 | 4258.21 | 745 | 729 | 176.8 |
| D | 5 | 222 | 125244 | 704.1 | 745 | 729 | 176.8 |
| D | 5 | 223 | 45458 | 252.93 | 745 | 729 | 176.8 |
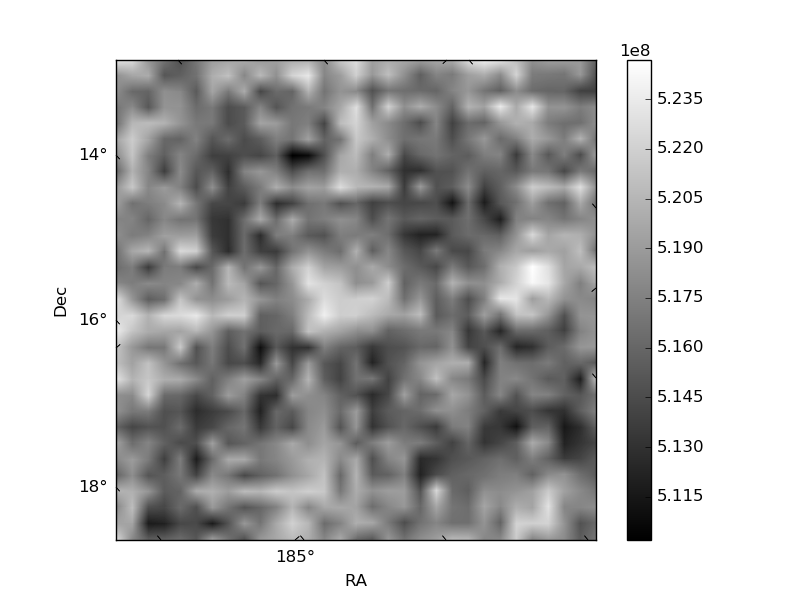
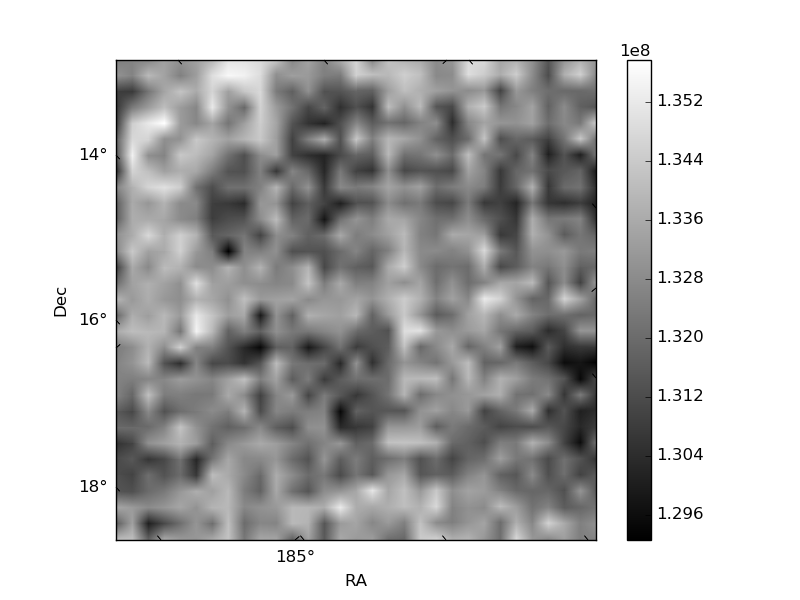
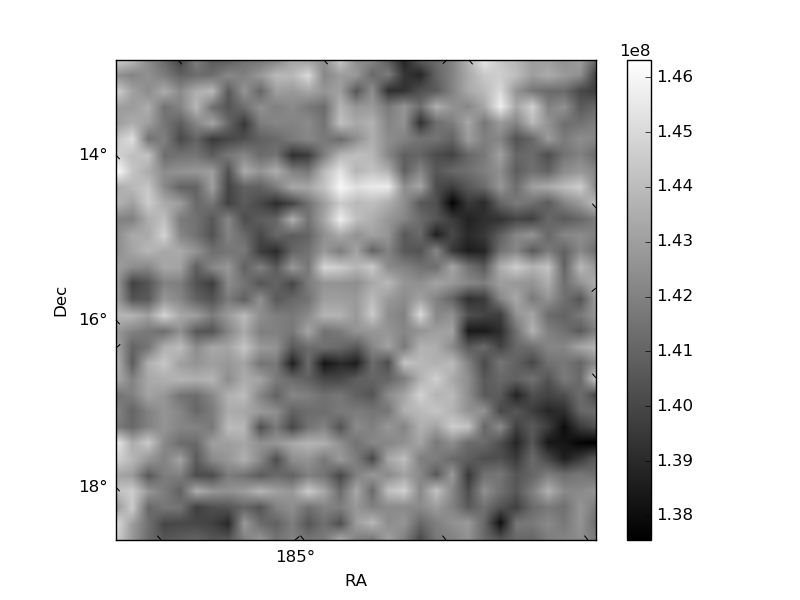
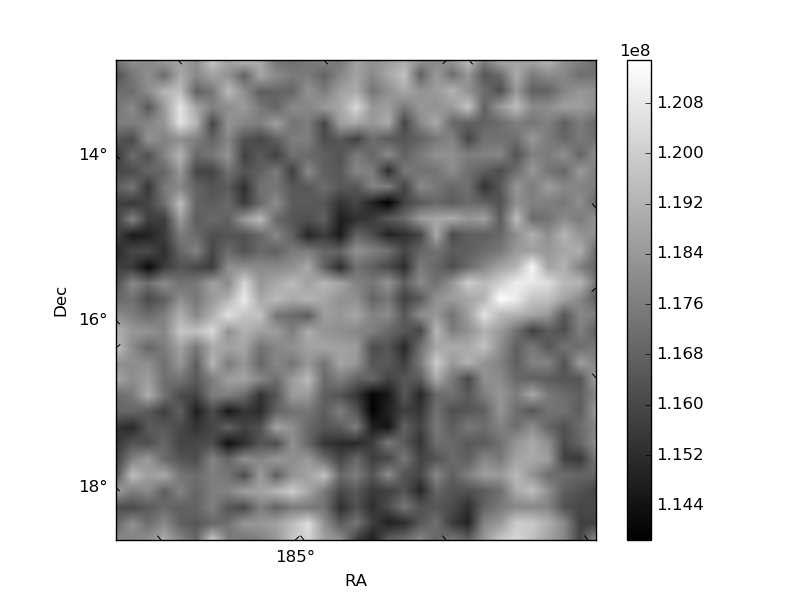
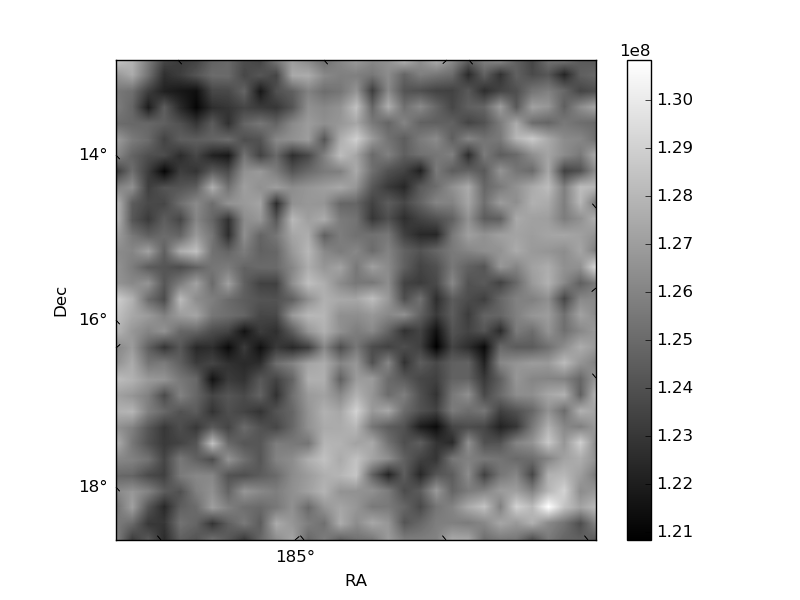
Histogram calculated using DETX and DETY for each event in the final _common_clean file
| Quadrant A | 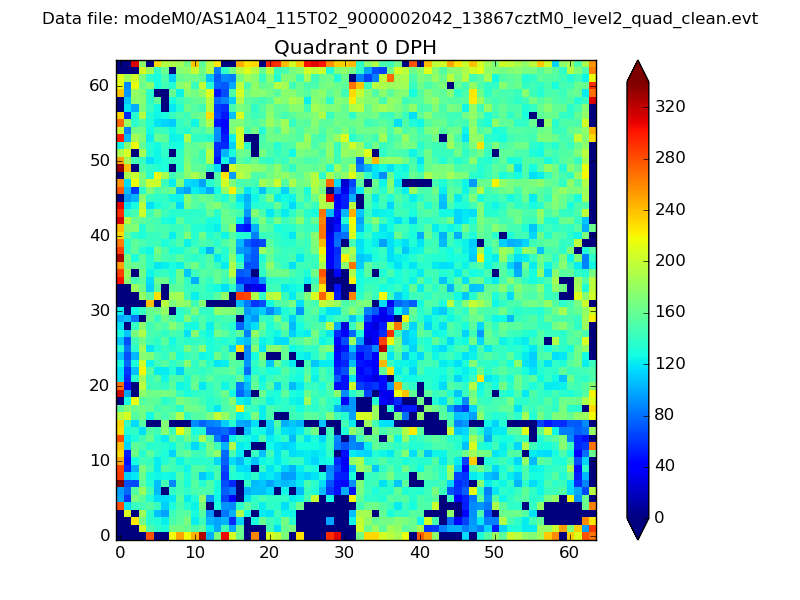 |
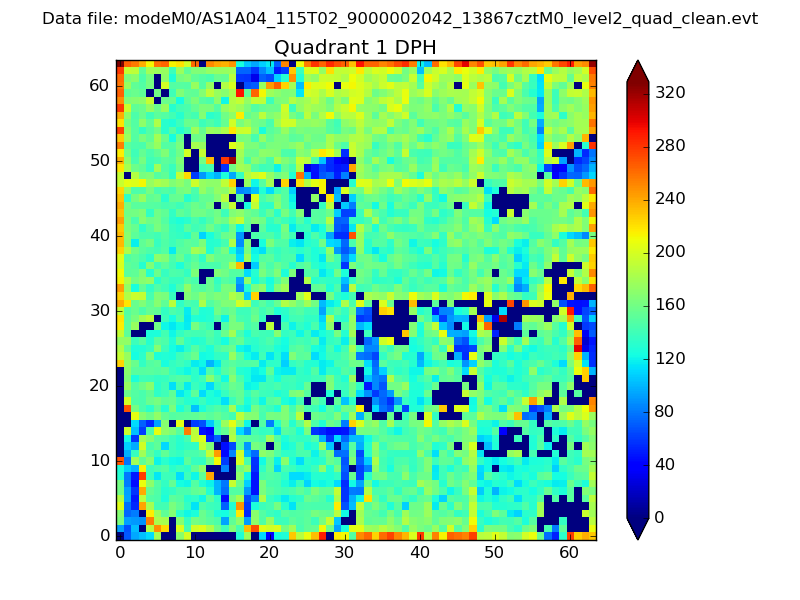 |
Quadrant B |
|---|---|---|---|
| Quadrant D | 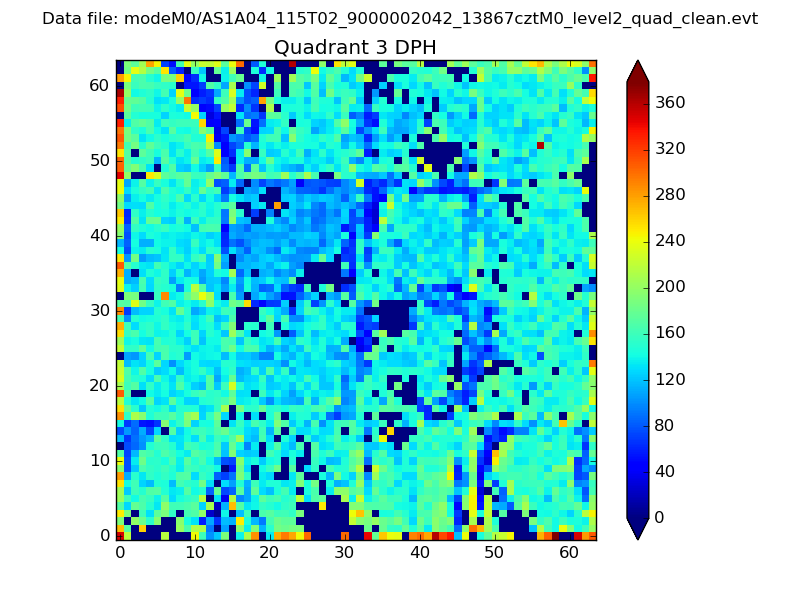 |
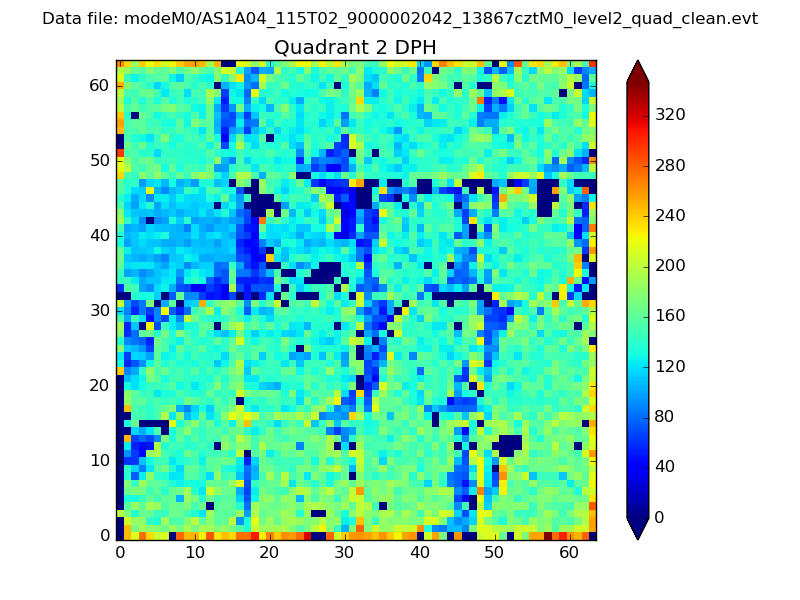 |
Quadrant C |
| Plot type | Count rate plots | Images |
|---|---|---|
| Comparison with Poisson distribution Blue bars denote a histogram of data divided into 1 sec bins. Red curve is a Poisson curve with rate = median count rate of data. |
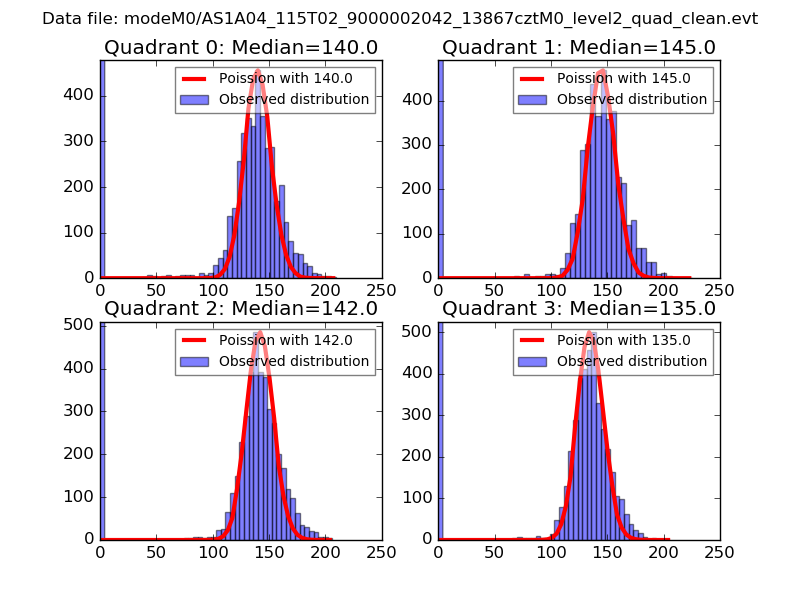 |
 |
| Quadrant-wise count rates Data is divided into 100 sec bins |
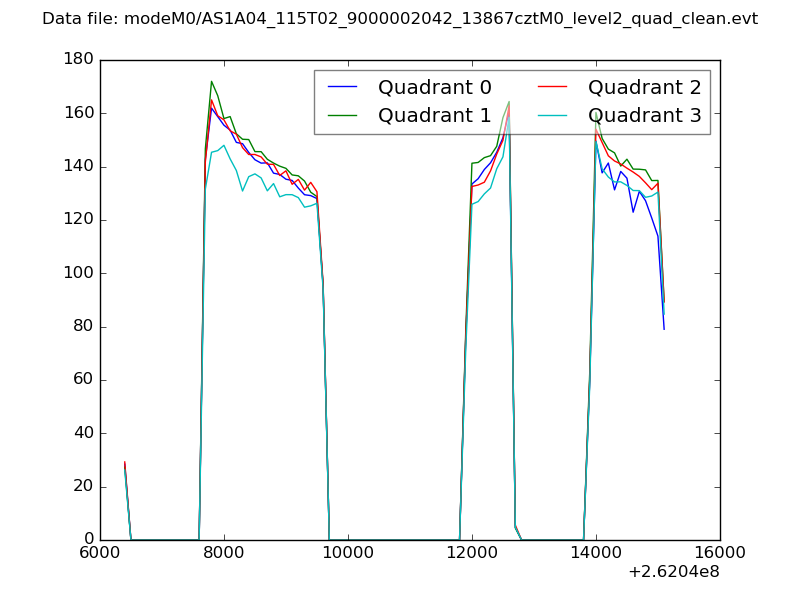 |
|
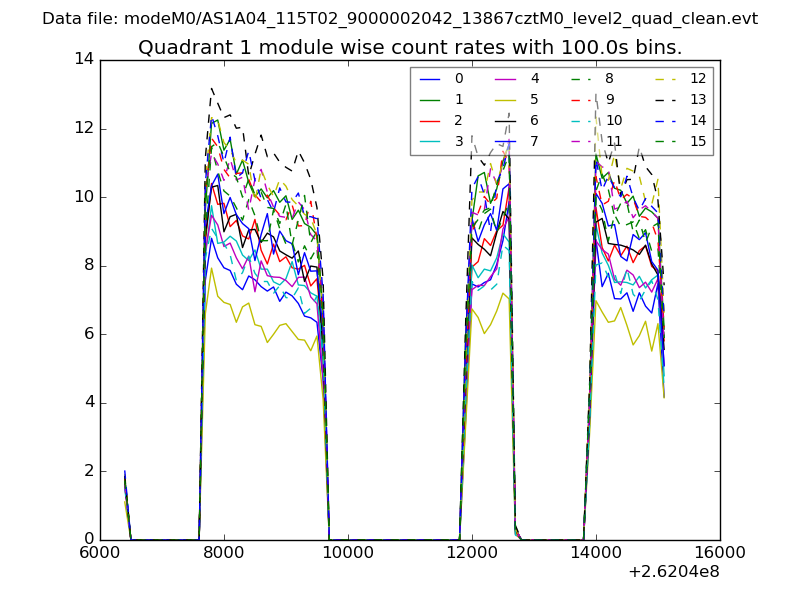
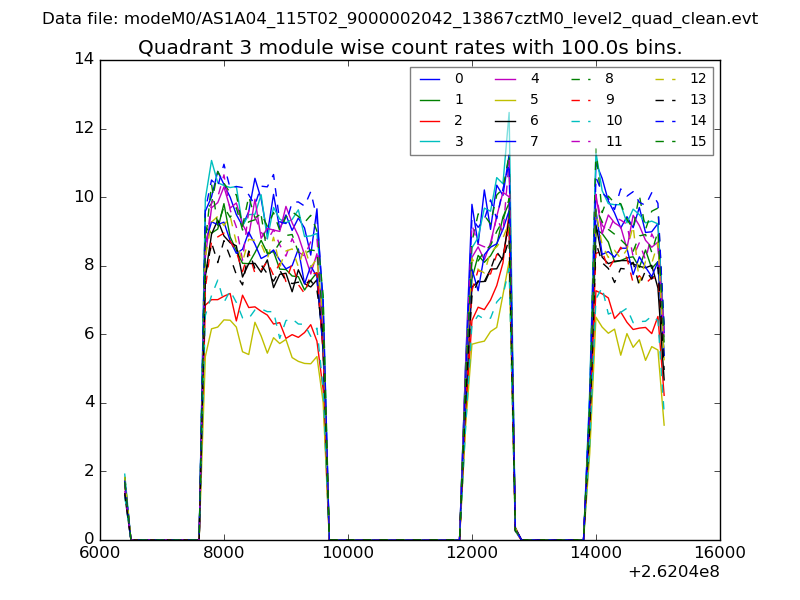
| Module-wise count rates for Quadrant A Data is divided into 100 sec bins |
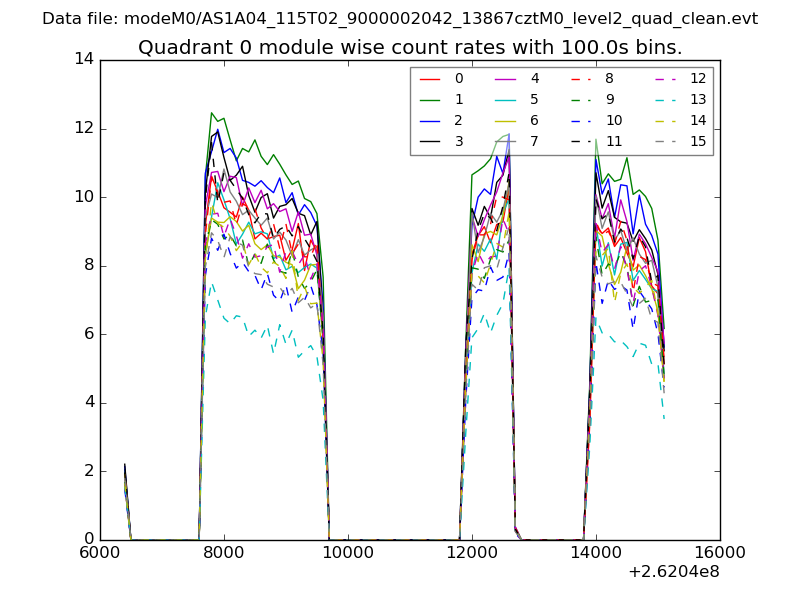 |
 |
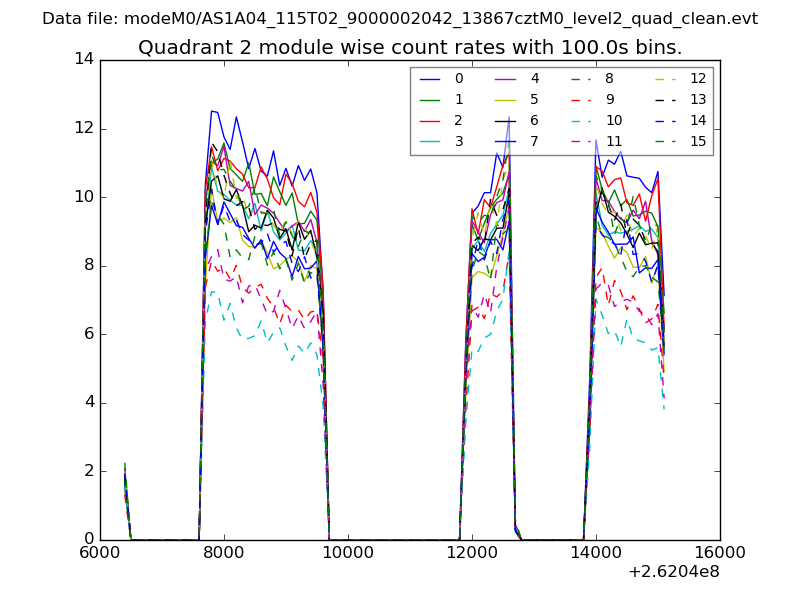
| Module-wise count rates for Quadrant B Data is divided into 100 sec bins |
 |
 |
| Module-wise count rates for Quadrant C Data is divided into 100 sec bins |
 |
 |
| Module-wise count rates for Quadrant D Data is divided into 100 sec bins |
 |
 |
| Parameter | Plot |
|---|---|
| CZT HV Monitor | 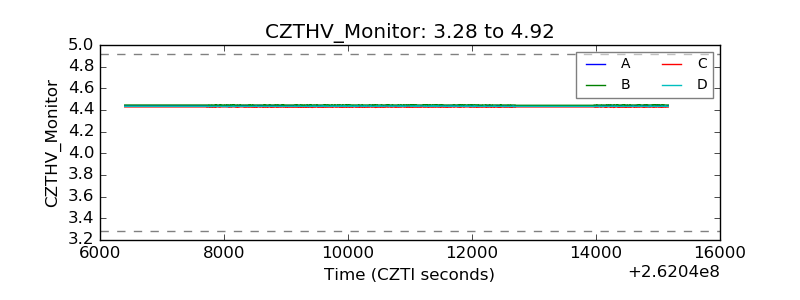 |
| D_VDD | 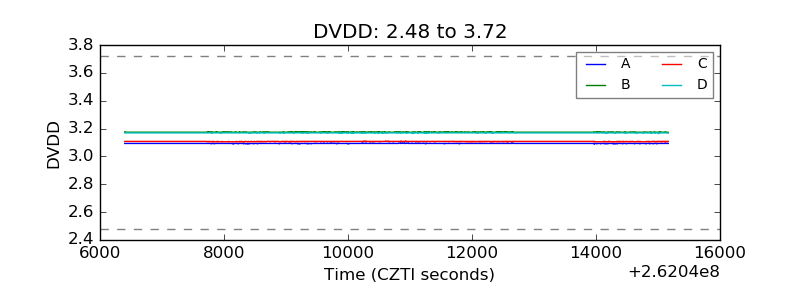 |
| Temperature 1 | 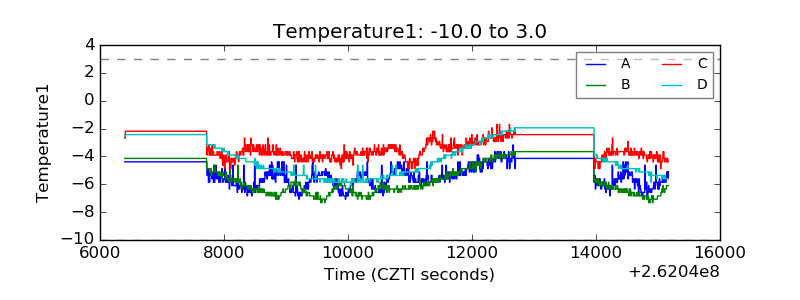 |
| Veto HV Monitor | 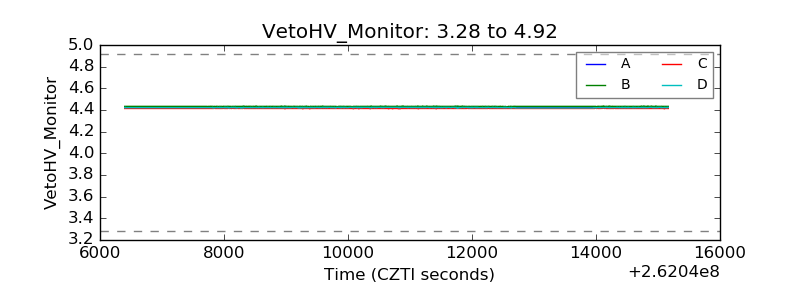 |
| Veto LLD | 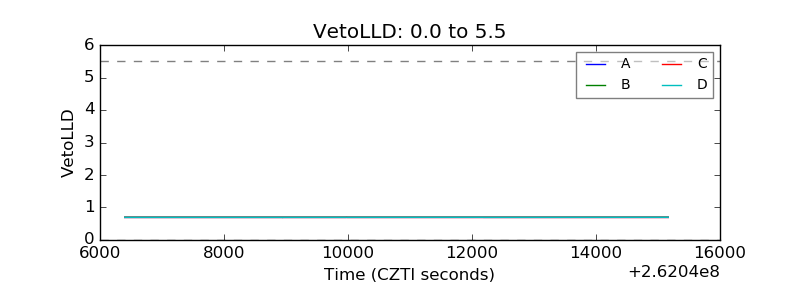 |
| Alpha Counter | 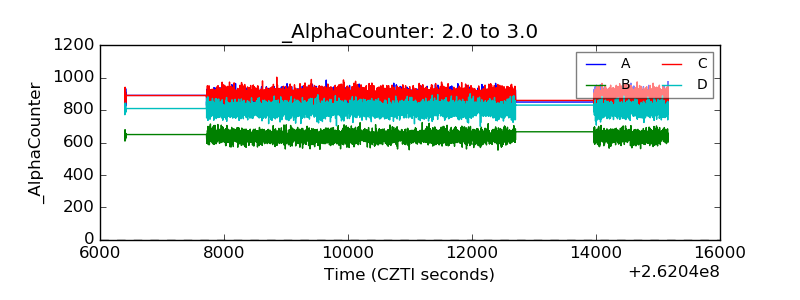 |
| _CPM_Rate | 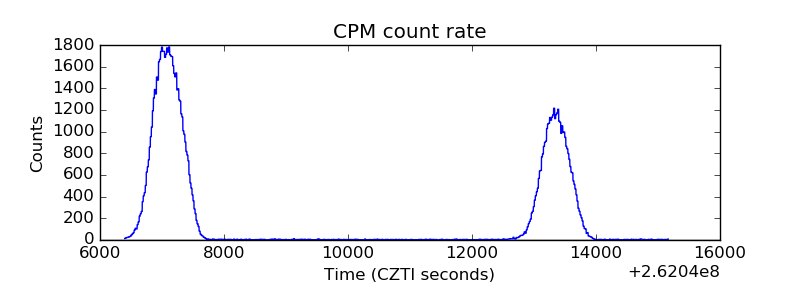 |
| CZT Counter | 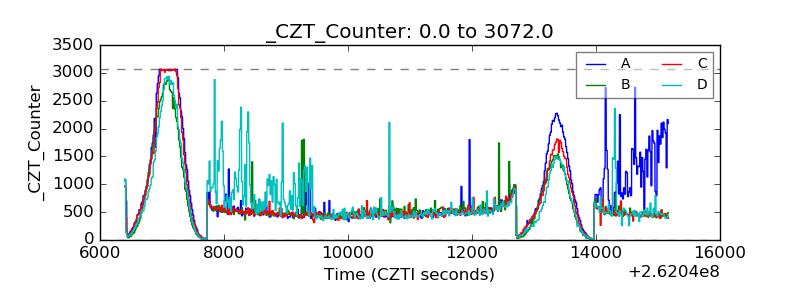 |
| +2.5 Volts monitor |  |
| +5 Volts monitor |  |
| _ROLL_ROT | 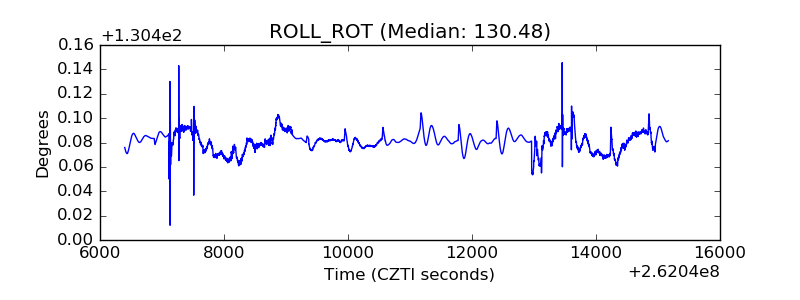 |
| _Roll_DEC | 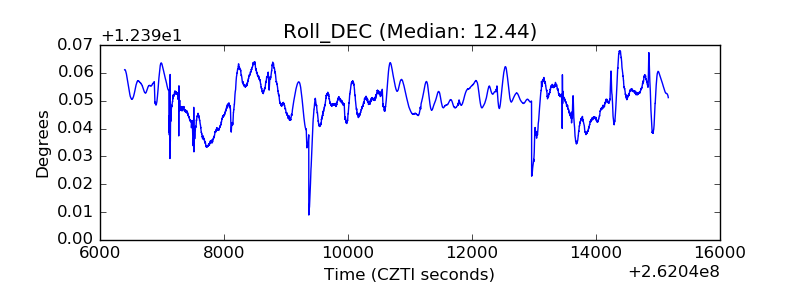 |
| _Roll_RA | 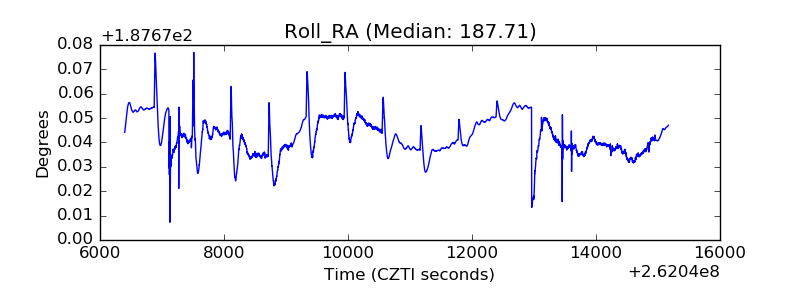 |
| Veto Counter | 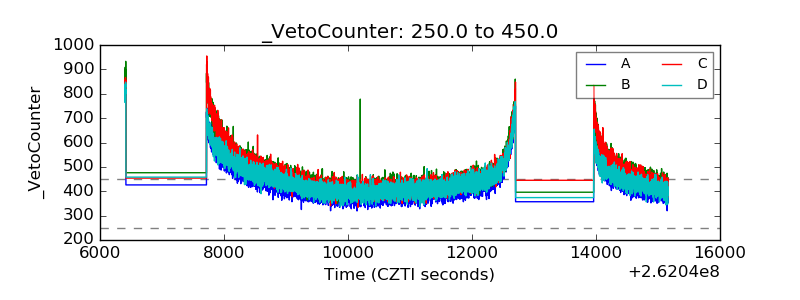 |