| Param | Original file | Final file |
|---|---|---|
| Filename | modeM0/AS1A04_115T02_9000002042_13872cztM0_level2.evt | modeM0/AS1A04_115T02_9000002042_13872cztM0_level2_quad_clean.evt |
| Size (bytes) | 593,714,880 | 93,303,360 |
| Size | 566.2 MB | 89.0 MB |
| Events in quadrant A | 4,073,400 | 561,065 |
| Events in quadrant B | 4,408,046 | 564,191 |
| Events in quadrant C | 4,063,697 | 562,862 |
| Events in quadrant D | 4,858,649 | 547,035 |
| Mode M9 | |||
|---|---|---|---|
| Quadrant | BADHDUFLAG | Total packets | Discarded packets |
| A | 0 | 6 | 0 |
| B | 0 | 6 | 0 |
| C | 0 | 6 | 0 |
| D | 0 | 6 | 0 |
| Mode M0 | |||
|---|---|---|---|
| Quadrant | BADHDUFLAG | Total packets | Discarded packets |
| A | 0 | 17743 | 4 |
| B | 0 | 18101 | 3 |
| C | 0 | 17774 | 3 |
| D | 0 | 20168 | 3 |
| Mode SS | |||
|---|---|---|---|
| Quadrant | BADHDUFLAG | Total packets | Discarded packets |
| A | 0 | 176 | 0 |
| B | 0 | 176 | 0 |
| C | 0 | 176 | 0 |
| D | 0 | 176 | 0 |
| Quadrant | Total seconds | Saturated seconds | Saturation percentage |
|---|---|---|---|
| A | 8498 | 259 | 3.047776% |
| B | 8498 | 292 | 3.436103% |
| C | 8498 | 196 | 2.306425% |
| D | 8498 | 313 | 3.683220% |
Noise dominated data is calculated using 1-second bins in cleaned event files. If a bin has >2000 counts, and if more than 50% of those come from <1% of pixels, then it is considered to be noise-dominated and hence unusable.
| Quadrant | # 1 sec bins | Bins with >0 counts | Bins with >2000 counts | High rate bins dominated by noise | Noise dominated (total time) | Noise dominated (detector-on time) | Marked lightcurve |
|---|---|---|---|---|---|---|---|
| A | 9070 | 8499 | 0 | 0 | 0.00% | 0.00% | 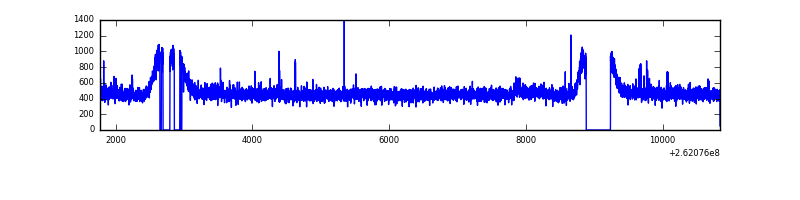 |
| B | 9070 | 8500 | 8 | 8 | 0.09% | 0.09% | 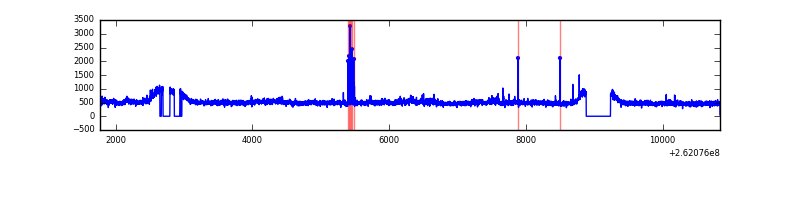 |
| C | 9070 | 8501 | 0 | 0 | 0.00% | 0.00% | 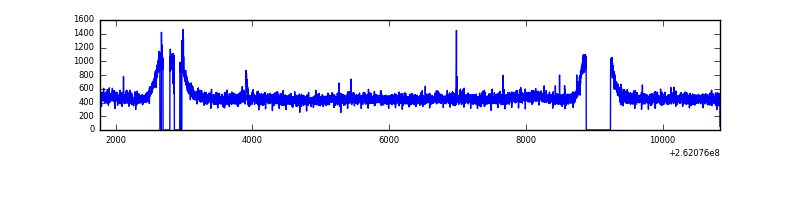 |
| D | 9070 | 8501 | 115 | 115 | 1.27% | 1.35% | 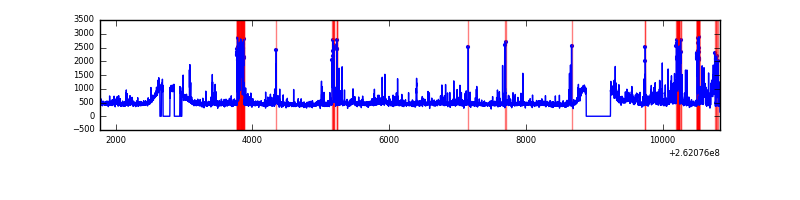 |
Top three noisy pixels from each quadrant. If the there are fewer than three noisy pixels in the level2.evt file, extra rows are filled as -1
| Pixel properties | Quadrant properties | ||||||
|---|---|---|---|---|---|---|---|
| Quadrant | DetID | PixID | Counts | Sigma | Mean | Median | Sigma |
| A | 0 | 23 | 29352 | 132.48 | 1042 | 1016 | 213.9 |
| A | 1 | 162 | 13892 | 60.2 | 1042 | 1016 | 213.9 |
| A | 0 | 226 | 10947 | 46.43 | 1042 | 1016 | 213.9 |
| B | 10 | 244 | 298133 | 1461.84 | 1033 | 1005 | 203.3 |
| B | 4 | 80 | 51528 | 248.57 | 1033 | 1005 | 203.3 |
| B | 12 | 111 | 25715 | 121.57 | 1033 | 1005 | 203.3 |
| C | 3 | 233 | 70871 | 292.6 | 1013 | 1018 | 238.7 |
| C | 8 | 112 | 26112 | 105.11 | 1013 | 1018 | 238.7 |
| C | 5 | 254 | 11077 | 42.13 | 1013 | 1018 | 238.7 |
| D | 5 | 222 | 846804 | 3507.18 | 1004 | 980 | 241.2 |
| D | 13 | 189 | 42085 | 170.44 | 1004 | 980 | 241.2 |
| D | 1 | 52 | 33672 | 135.55 | 1004 | 980 | 241.2 |
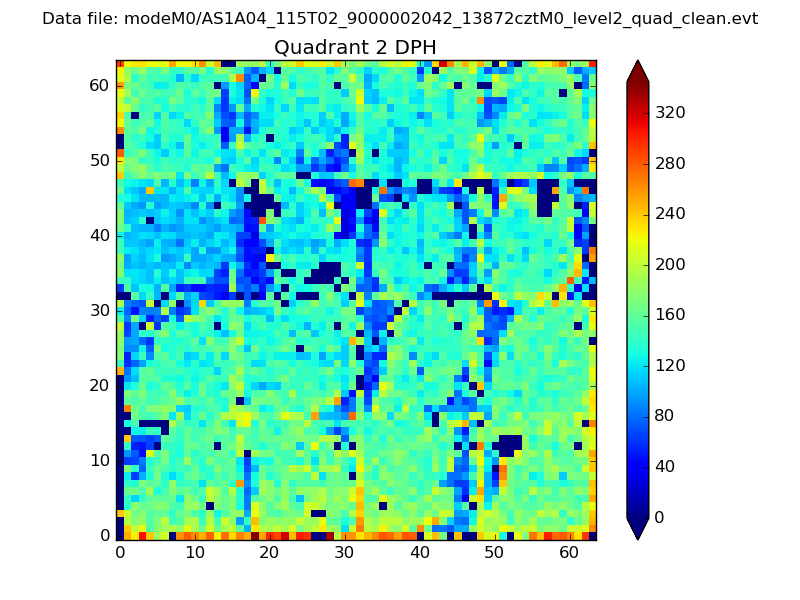
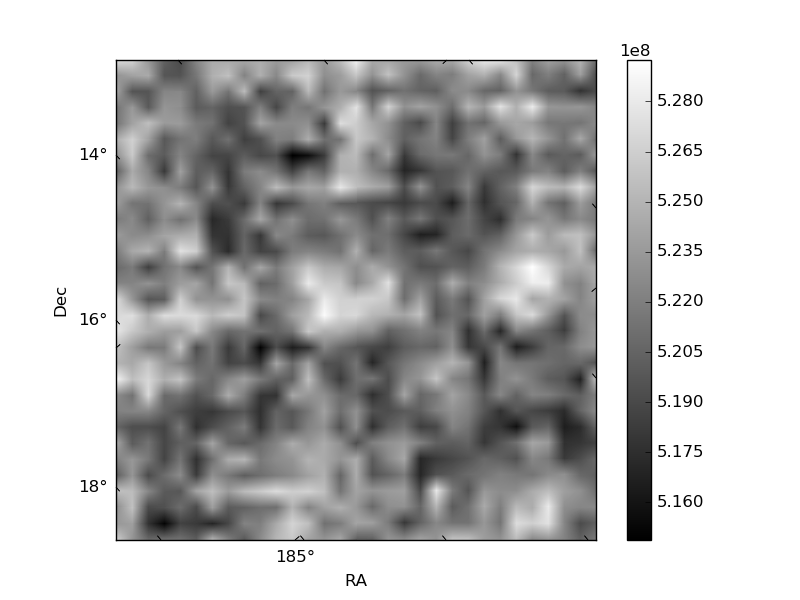
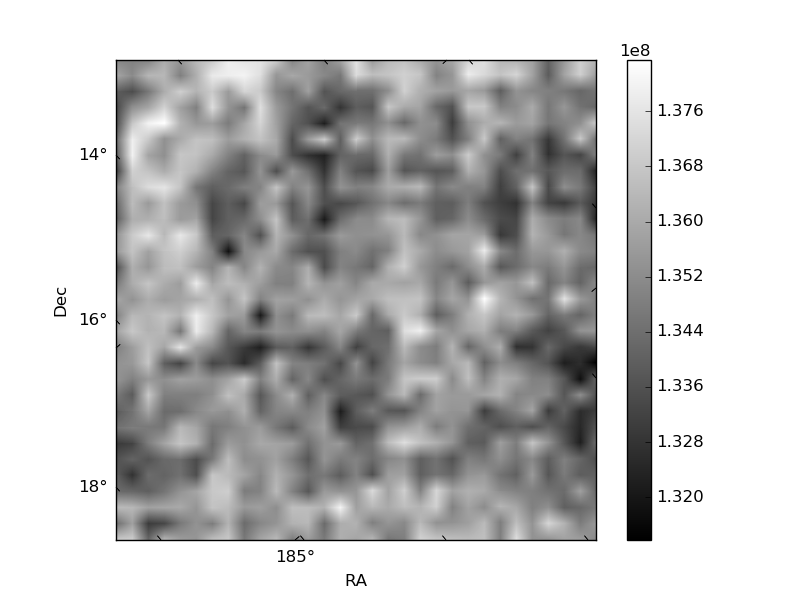
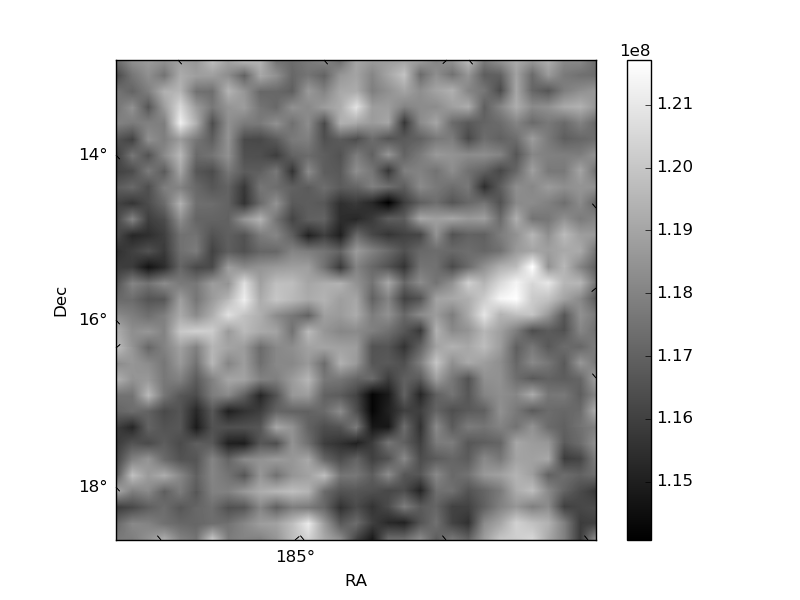
Histogram calculated using DETX and DETY for each event in the final _common_clean file
| Quadrant A | 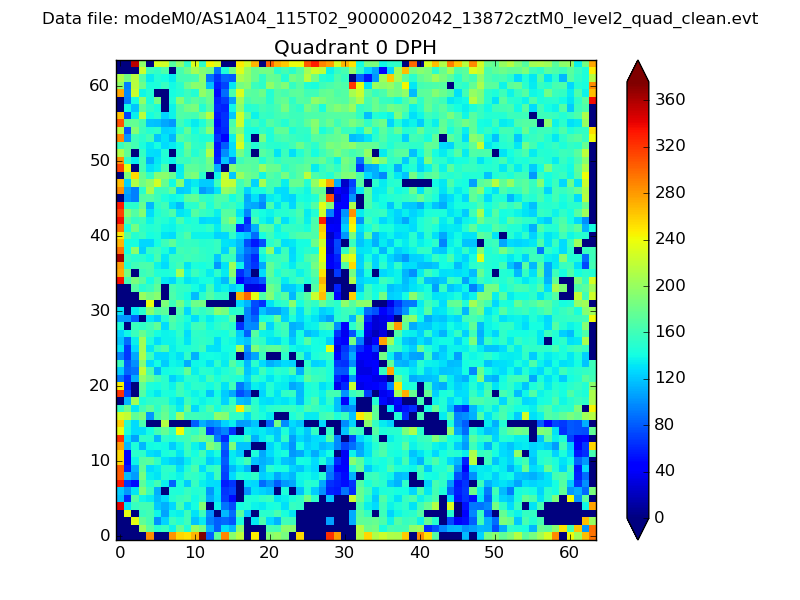 |
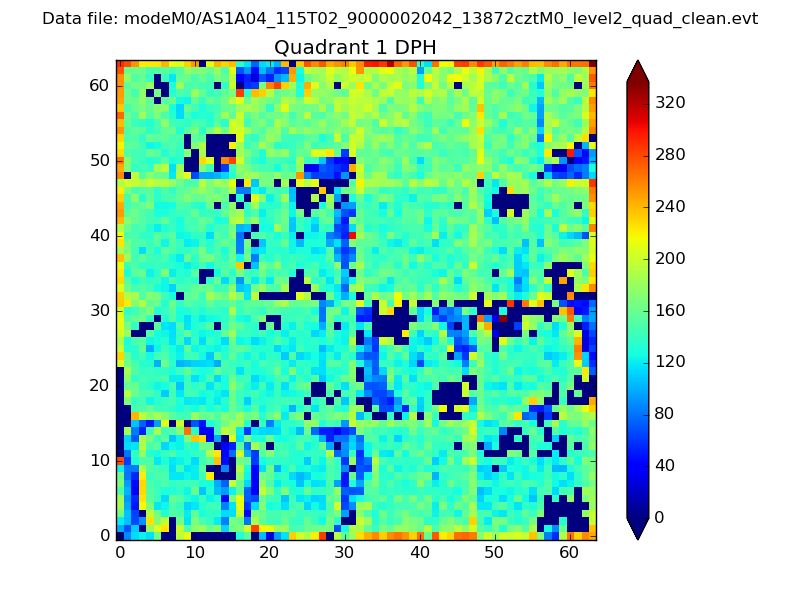 |
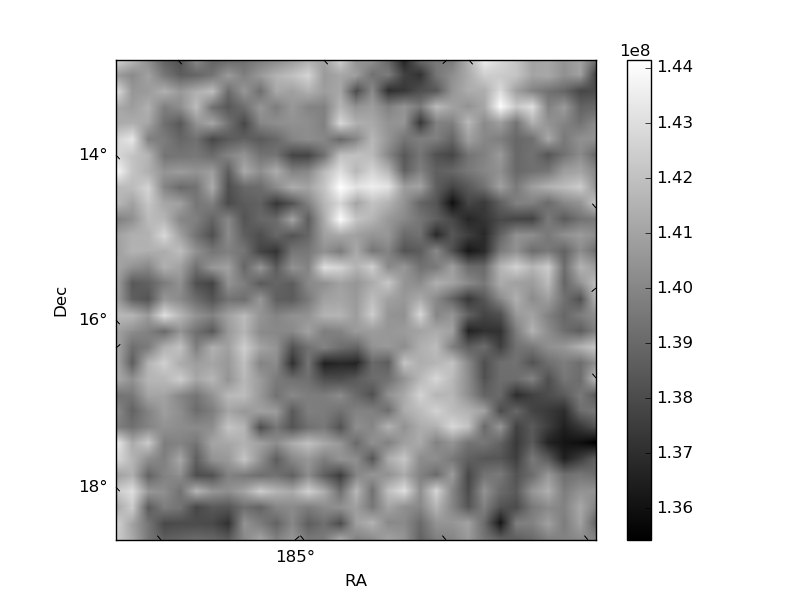
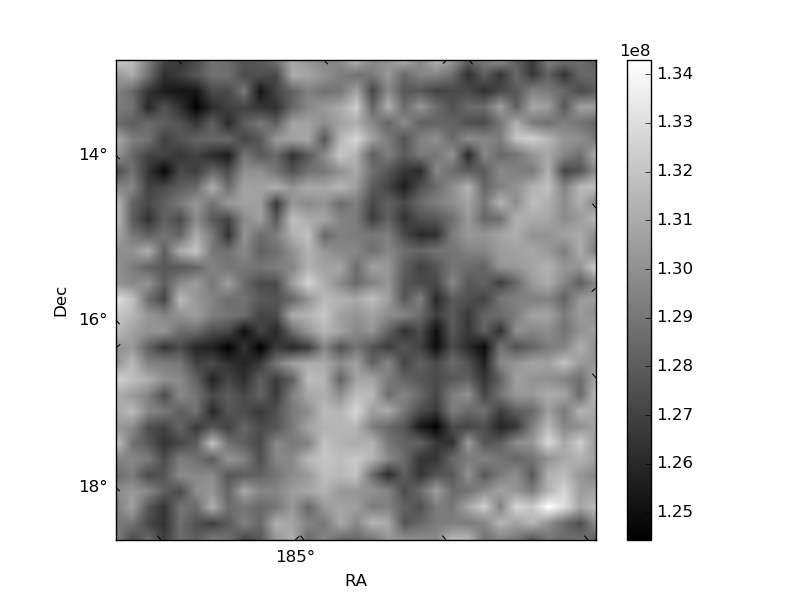
Quadrant B |
|---|---|---|---|
| Quadrant D | 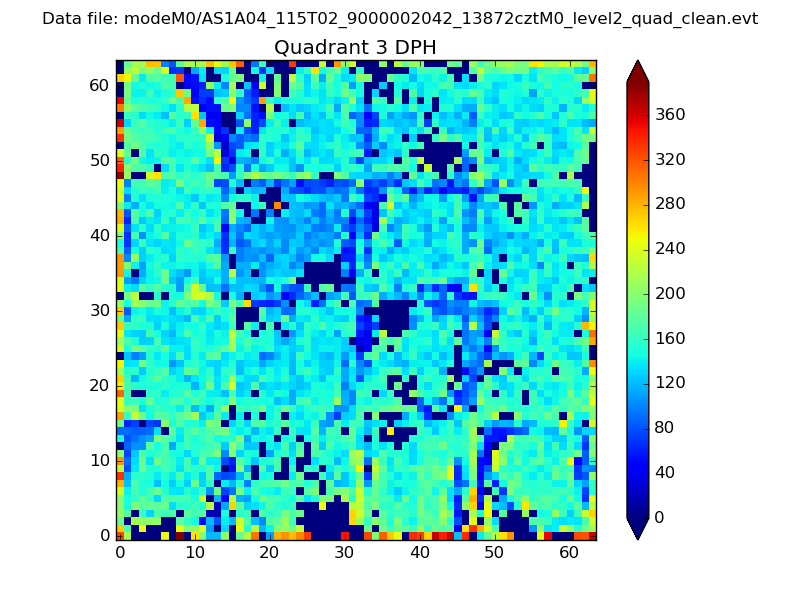 |
 |
Quadrant C |
| Plot type | Count rate plots | Images |
|---|---|---|
| Comparison with Poisson distribution Blue bars denote a histogram of data divided into 1 sec bins. Red curve is a Poisson curve with rate = median count rate of data. |
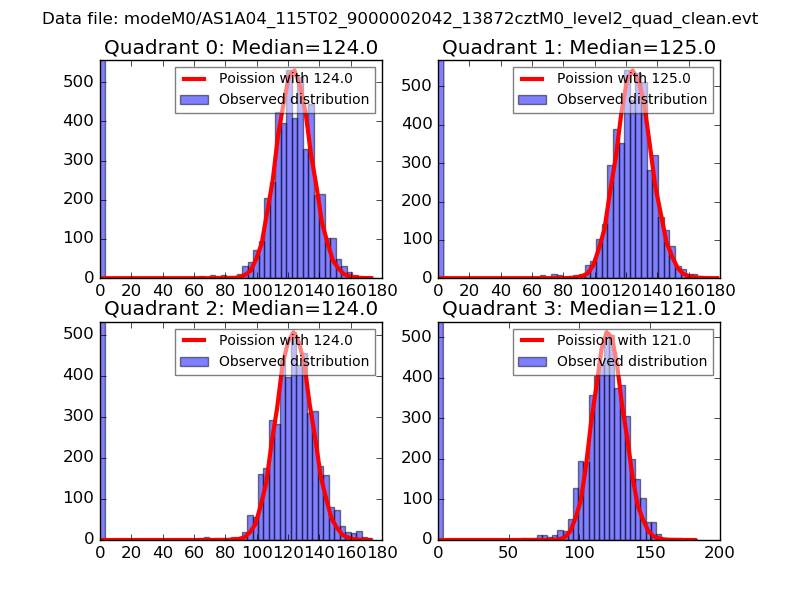 |
 |
| Quadrant-wise count rates Data is divided into 100 sec bins |
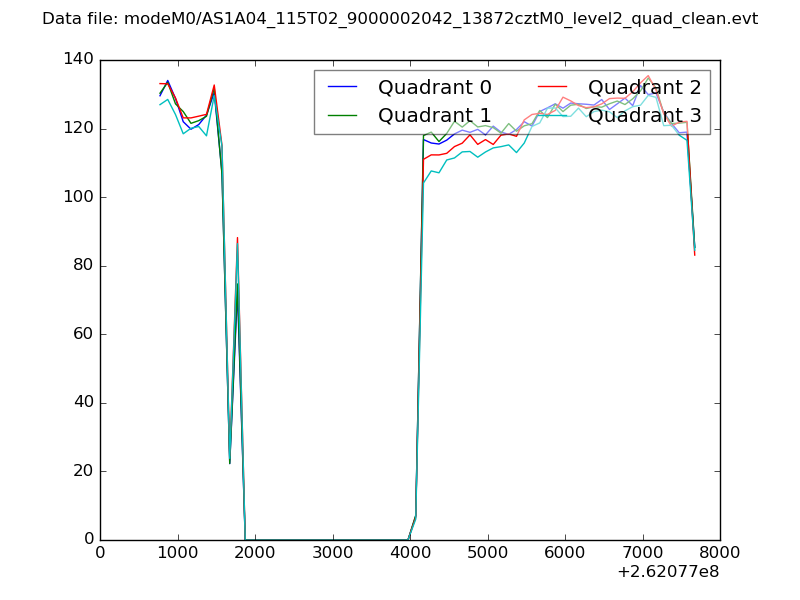 |
|
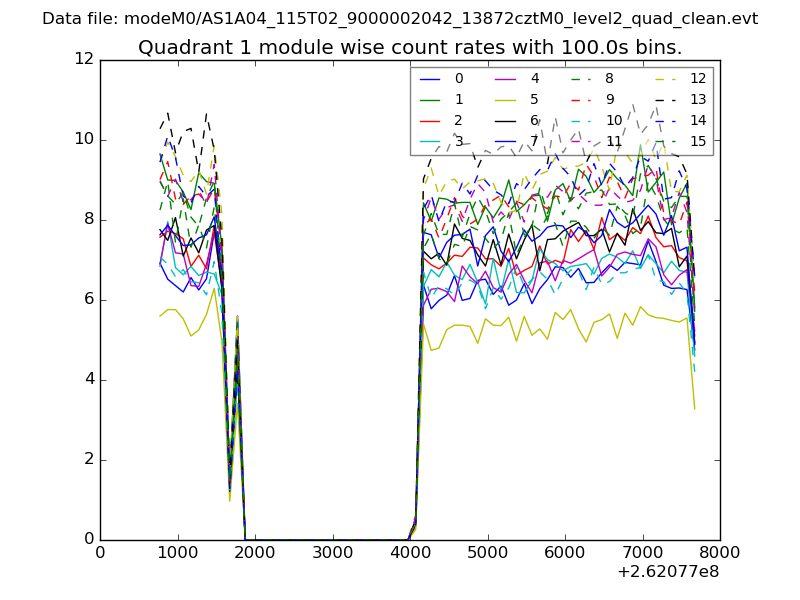
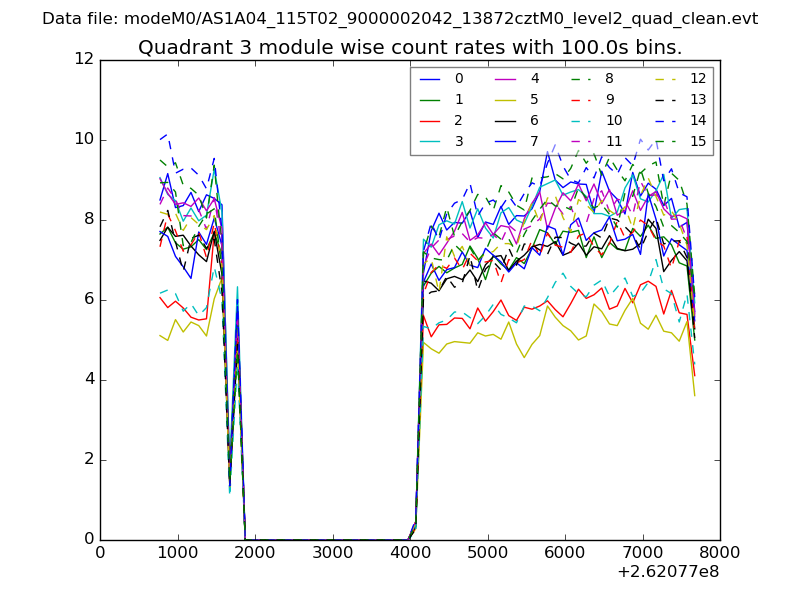
| Module-wise count rates for Quadrant A Data is divided into 100 sec bins |
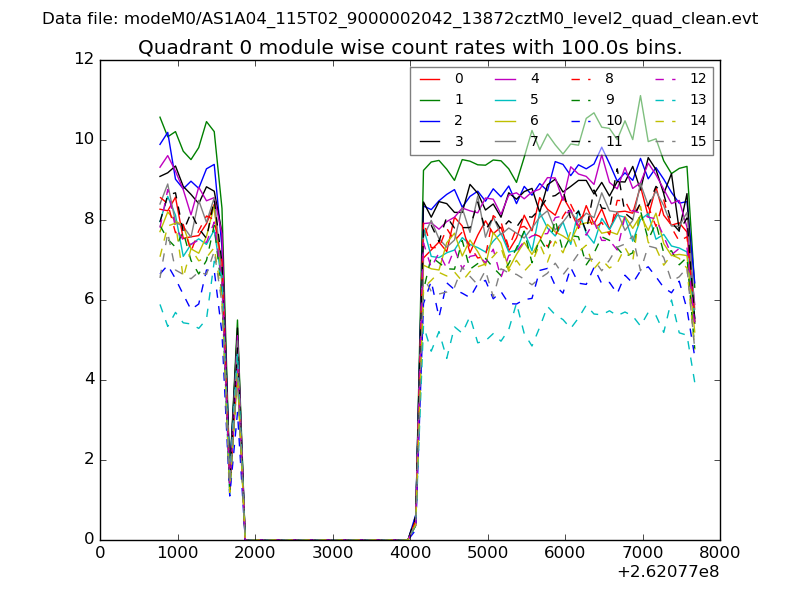 |
 |
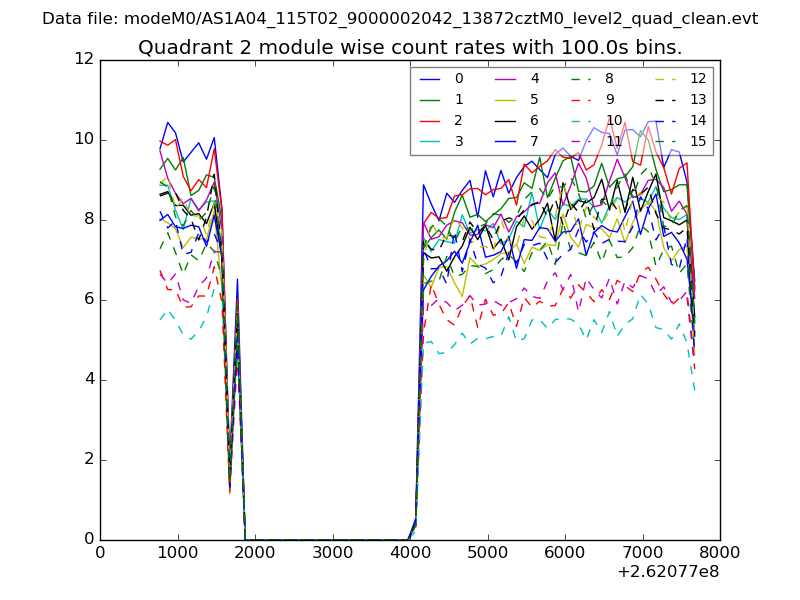
| Module-wise count rates for Quadrant B Data is divided into 100 sec bins |
 |
 |
| Module-wise count rates for Quadrant C Data is divided into 100 sec bins |
 |
 |
| Module-wise count rates for Quadrant D Data is divided into 100 sec bins |
 |
 |
| Parameter | Plot |
|---|---|
| CZT HV Monitor | 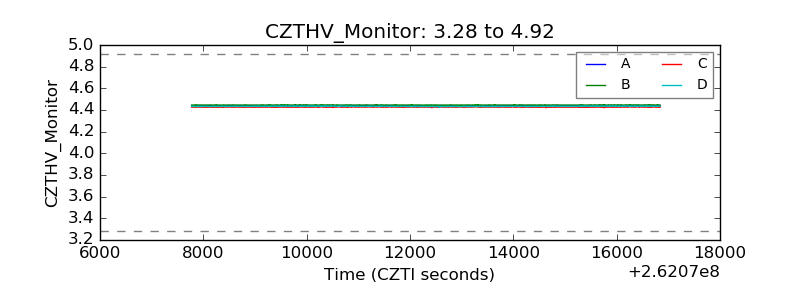 |
| D_VDD | 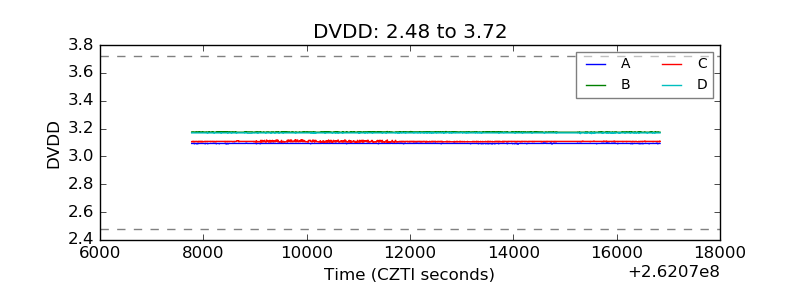 |
| Temperature 1 | 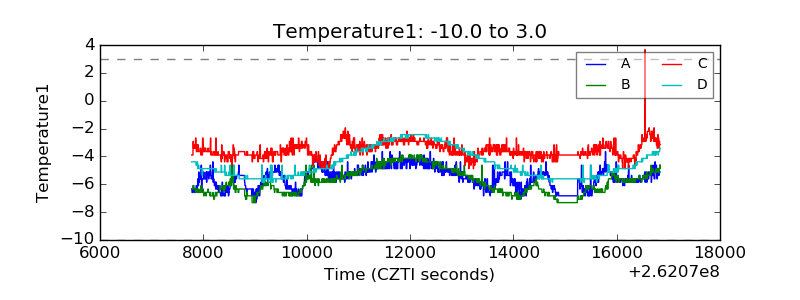 |
| Veto HV Monitor | 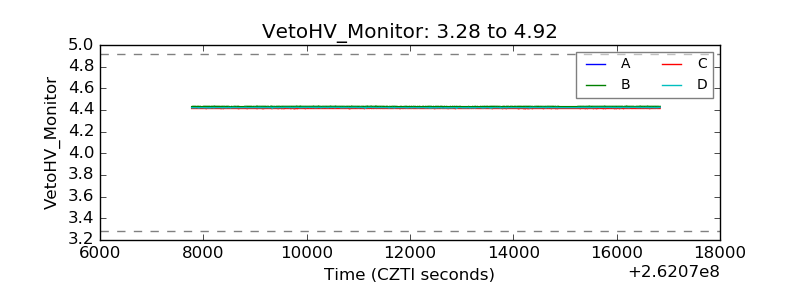 |
| Veto LLD | 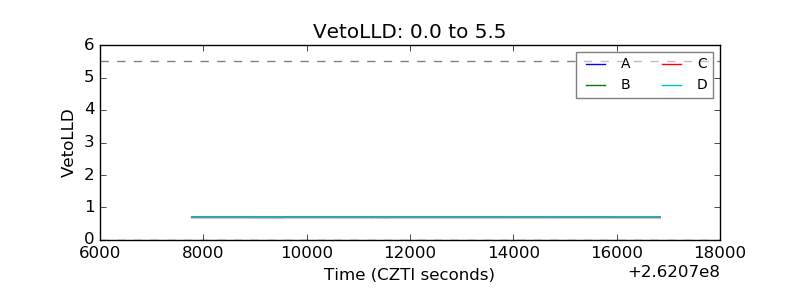 |
| Alpha Counter | 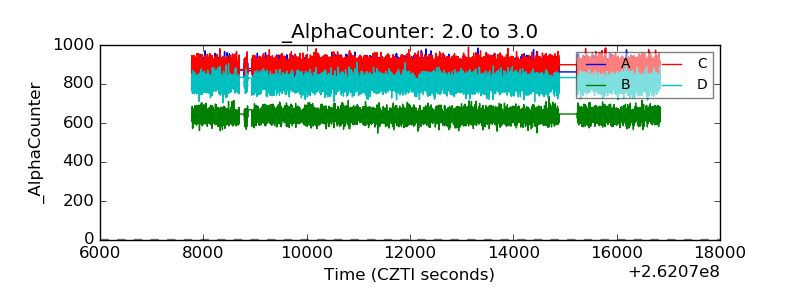 |
| _CPM_Rate | 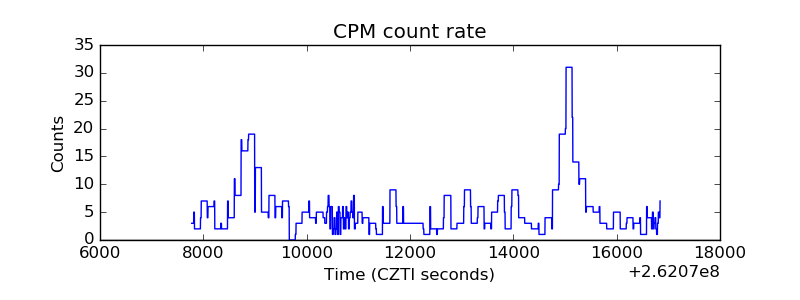 |
| CZT Counter | 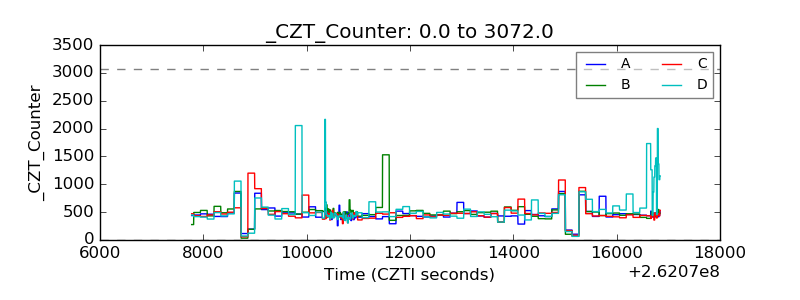 |
| +2.5 Volts monitor | 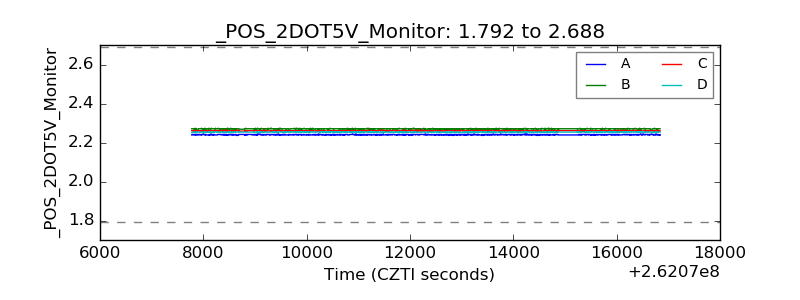 |
| +5 Volts monitor | 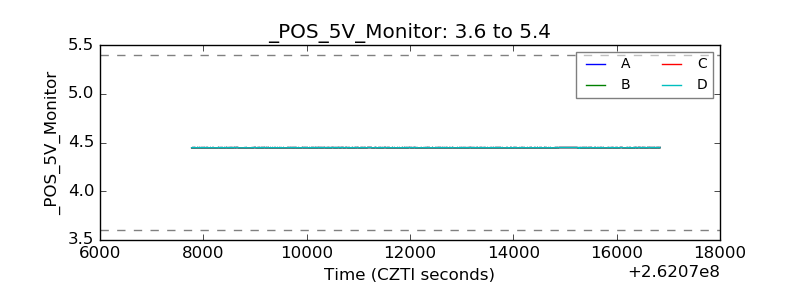 |
| _ROLL_ROT | 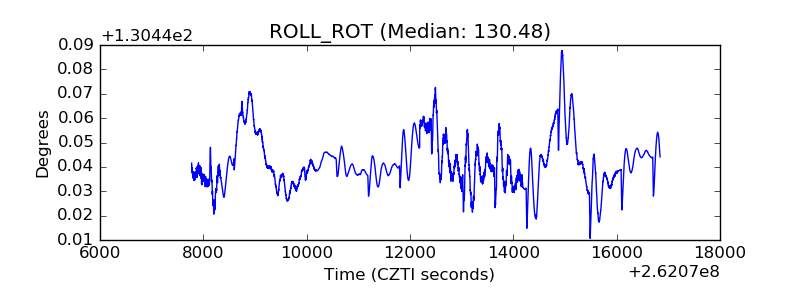 |
| _Roll_DEC |  |
| _Roll_RA | 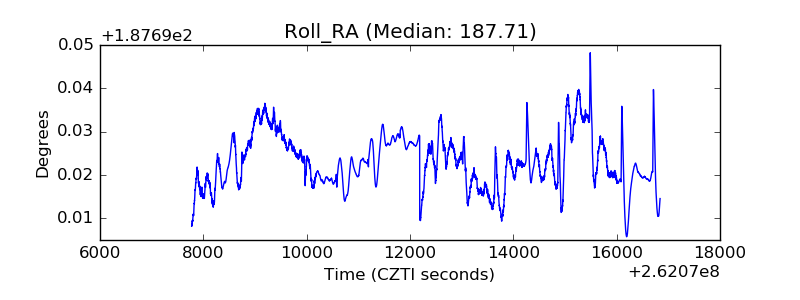 |
| Veto Counter | 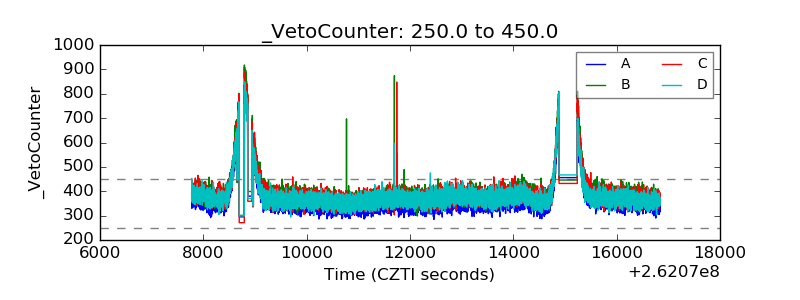 |