| Param | Original file | Final file |
|---|---|---|
| Filename | modeM0/AS1A04_115T02_9000002042_13874cztM0_level2.evt | modeM0/AS1A04_115T02_9000002042_13874cztM0_level2_quad_clean.evt |
| Size (bytes) | 737,084,160 | 137,963,520 |
| Size | 702.9 MB | 131.6 MB |
| Events in quadrant A | 4,969,955 | 867,164 |
| Events in quadrant B | 5,117,172 | 873,294 |
| Events in quadrant C | 4,933,447 | 861,955 |
| Events in quadrant D | 6,573,572 | 831,879 |
| Mode M9 | |||
|---|---|---|---|
| Quadrant | BADHDUFLAG | Total packets | Discarded packets |
| A | 0 | 10 | 0 |
| B | 0 | 10 | 0 |
| C | 0 | 10 | 0 |
| D | 0 | 10 | 0 |
| Mode M0 | |||
|---|---|---|---|
| Quadrant | BADHDUFLAG | Total packets | Discarded packets |
| A | 0 | 21984 | 2 |
| B | 0 | 22087 | 2 |
| C | 0 | 21992 | 2 |
| D | 0 | 26684 | 2 |
| Mode SS | |||
|---|---|---|---|
| Quadrant | BADHDUFLAG | Total packets | Discarded packets |
| A | 0 | 218 | 0 |
| B | 0 | 218 | 0 |
| C | 0 | 218 | 0 |
| D | 0 | 218 | 0 |
| Quadrant | Total seconds | Saturated seconds | Saturation percentage |
|---|---|---|---|
| A | 10751 | 181 | 1.683564% |
| B | 10751 | 200 | 1.860292% |
| C | 10751 | 135 | 1.255697% |
| D | 10751 | 258 | 2.399777% |
Noise dominated data is calculated using 1-second bins in cleaned event files. If a bin has >2000 counts, and if more than 50% of those come from <1% of pixels, then it is considered to be noise-dominated and hence unusable.
| Quadrant | # 1 sec bins | Bins with >0 counts | Bins with >2000 counts | High rate bins dominated by noise | Noise dominated (total time) | Noise dominated (detector-on time) | Marked lightcurve |
|---|---|---|---|---|---|---|---|
| A | 11672 | 10752 | 0 | 0 | 0.00% | 0.00% |  |
| B | 11672 | 10752 | 4 | 4 | 0.03% | 0.04% |  |
| C | 11672 | 10752 | 7 | 7 | 0.06% | 0.07% |  |
| D | 11672 | 10752 | 104 | 104 | 0.89% | 0.97% |  |
Top three noisy pixels from each quadrant. If the there are fewer than three noisy pixels in the level2.evt file, extra rows are filled as -1
| Pixel properties | Quadrant properties | ||||||
|---|---|---|---|---|---|---|---|
| Quadrant | DetID | PixID | Counts | Sigma | Mean | Median | Sigma |
| A | 0 | 23 | 32630 | 119.33 | 1281 | 1250 | 263.0 |
| A | 0 | 226 | 12966 | 44.55 | 1281 | 1250 | 263.0 |
| A | 1 | 162 | 11659 | 39.58 | 1281 | 1250 | 263.0 |
| B | 10 | 244 | 76707 | 306.7 | 1270 | 1237 | 246.1 |
| B | 0 | 214 | 55962 | 222.39 | 1270 | 1237 | 246.1 |
| B | 12 | 111 | 30797 | 120.13 | 1270 | 1237 | 246.1 |
| C | 3 | 233 | 55954 | 187.23 | 1247 | 1252 | 292.2 |
| C | 14 | 234 | 20128 | 64.61 | 1247 | 1252 | 292.2 |
| C | 13 | 61 | 8836 | 25.96 | 1247 | 1252 | 292.2 |
| D | 5 | 222 | 1403701 | 4748.41 | 1235 | 1203 | 295.4 |
| D | 13 | 189 | 210488 | 708.57 | 1235 | 1203 | 295.4 |
| D | 1 | 52 | 100732 | 336.97 | 1235 | 1203 | 295.4 |
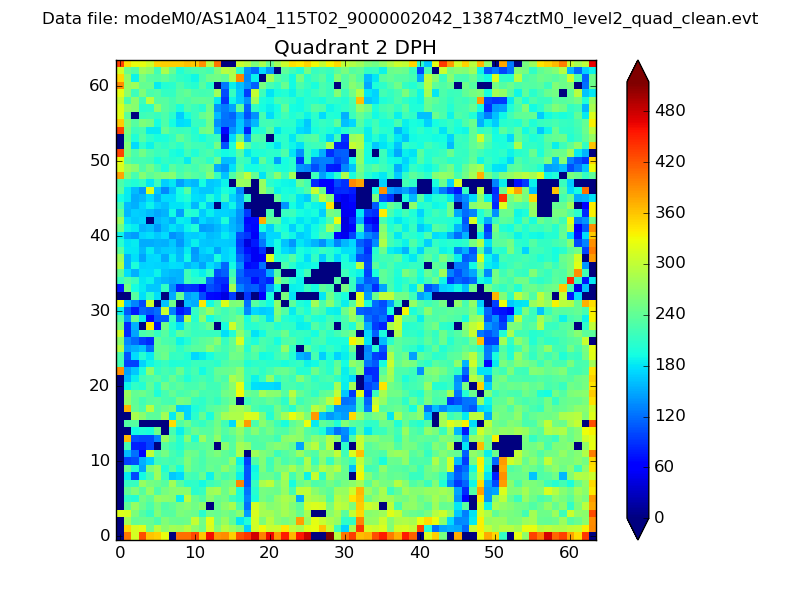
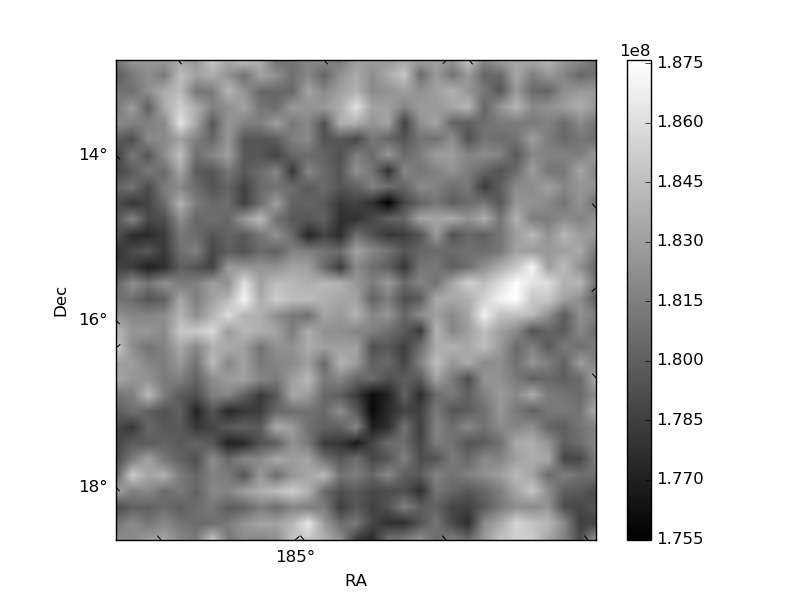
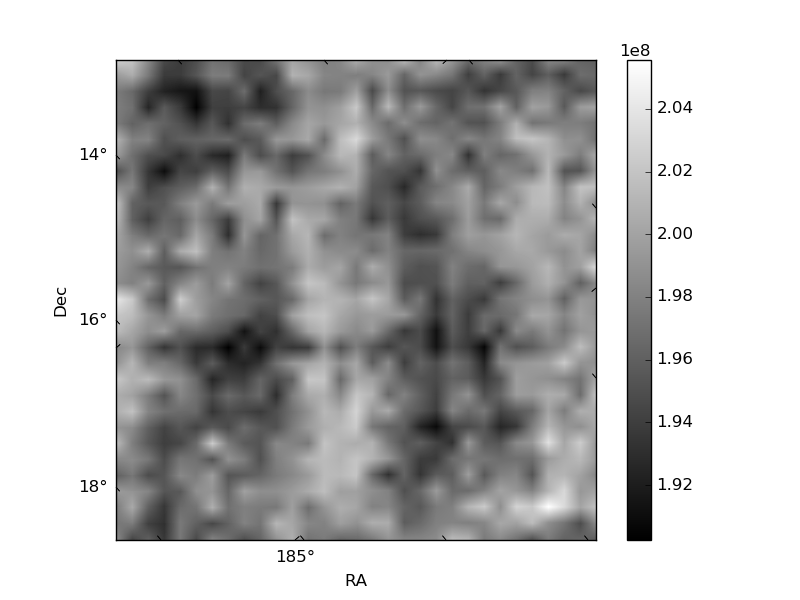
Histogram calculated using DETX and DETY for each event in the final _common_clean file
| Quadrant A | 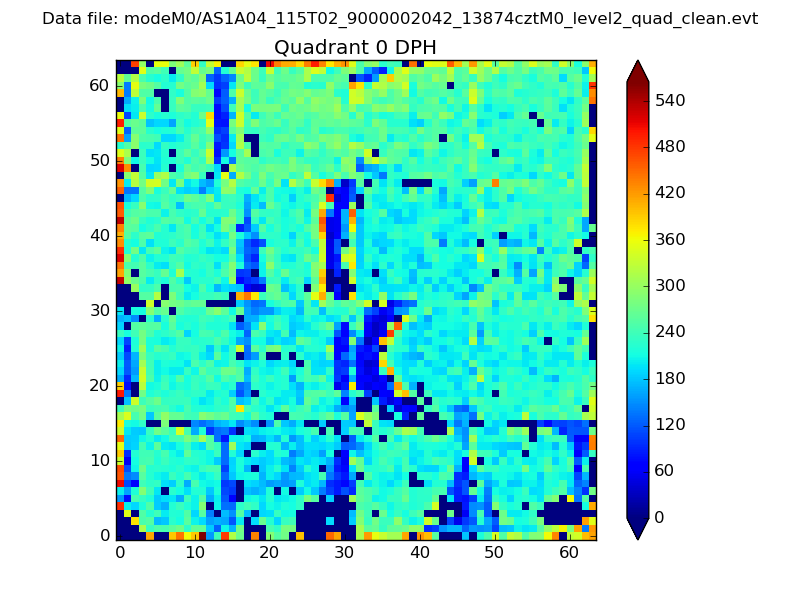 |
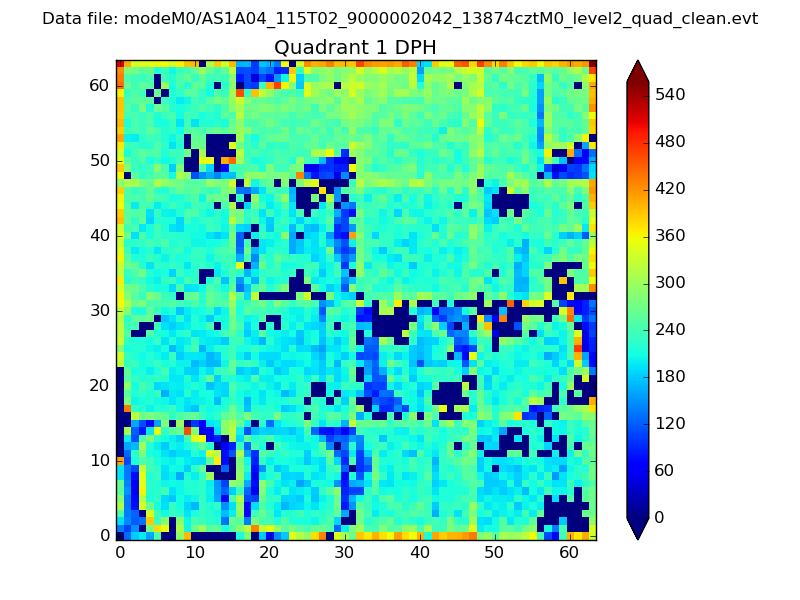 |
Quadrant B |
|---|---|---|---|
| Quadrant D | 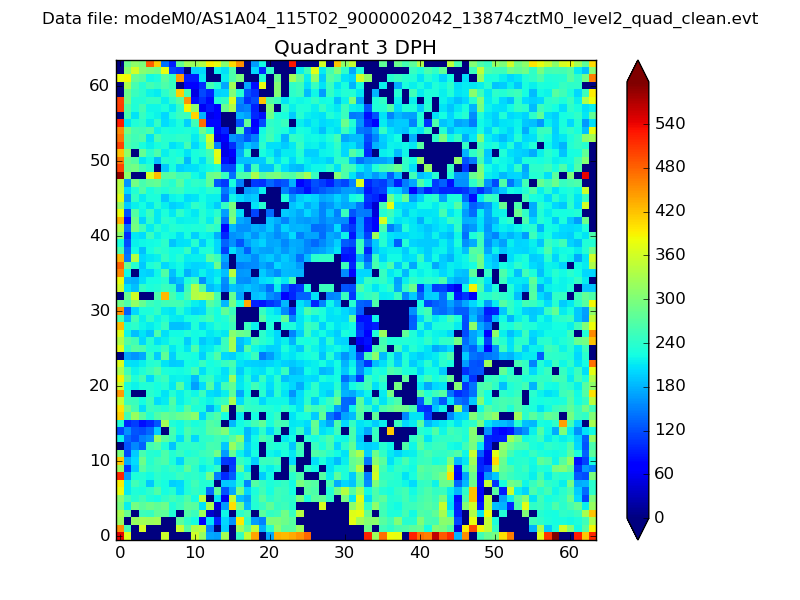 |
 |
Quadrant C |
| Plot type | Count rate plots | Images |
|---|---|---|
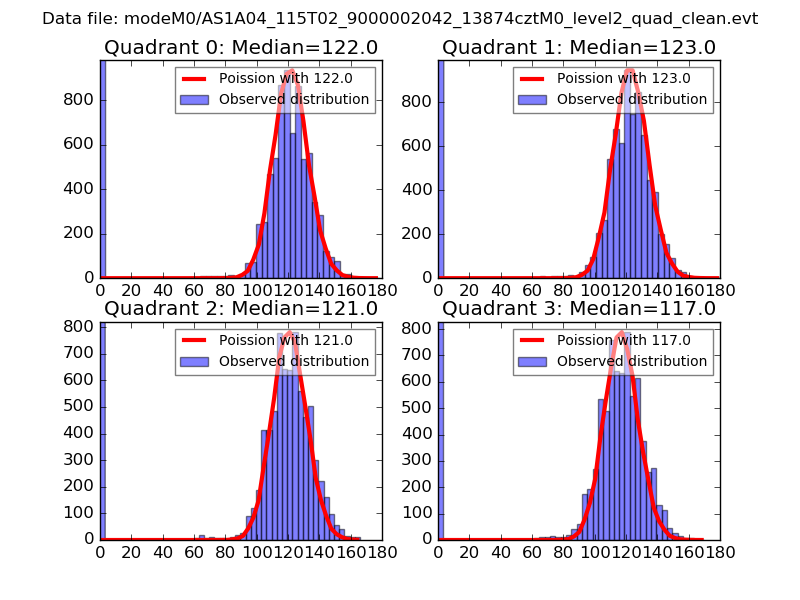
| Comparison with Poisson distribution Blue bars denote a histogram of data divided into 1 sec bins. Red curve is a Poisson curve with rate = median count rate of data. |
 |
 |
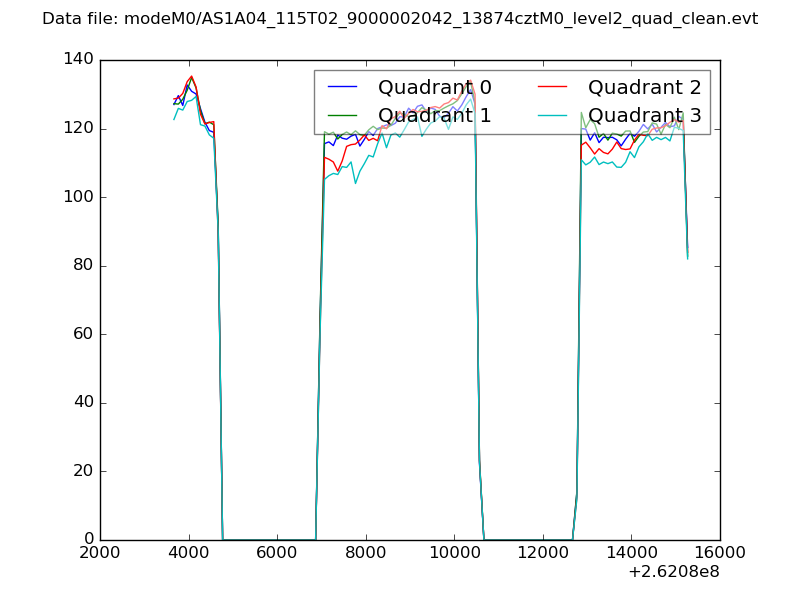
| Quadrant-wise count rates Data is divided into 100 sec bins |
 |
|
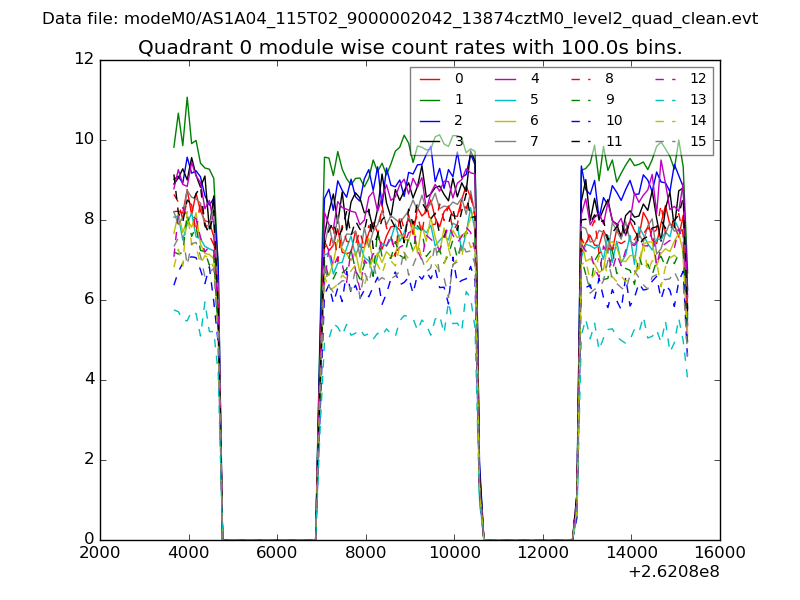
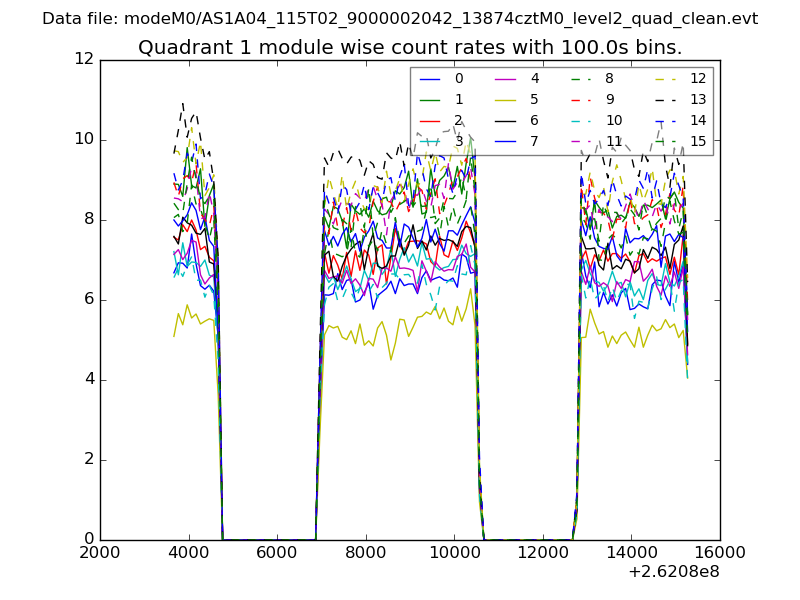
| Module-wise count rates for Quadrant A Data is divided into 100 sec bins |
 |
 |
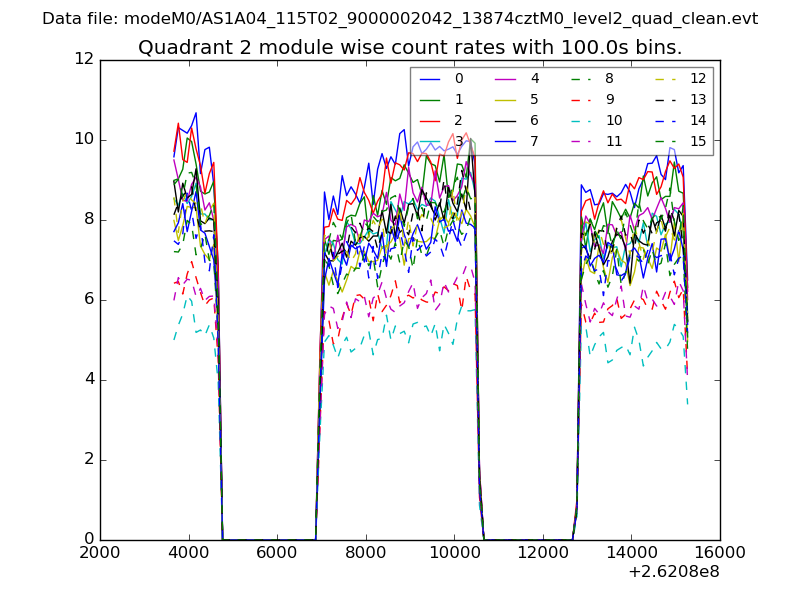
| Module-wise count rates for Quadrant B Data is divided into 100 sec bins |
 |
 |
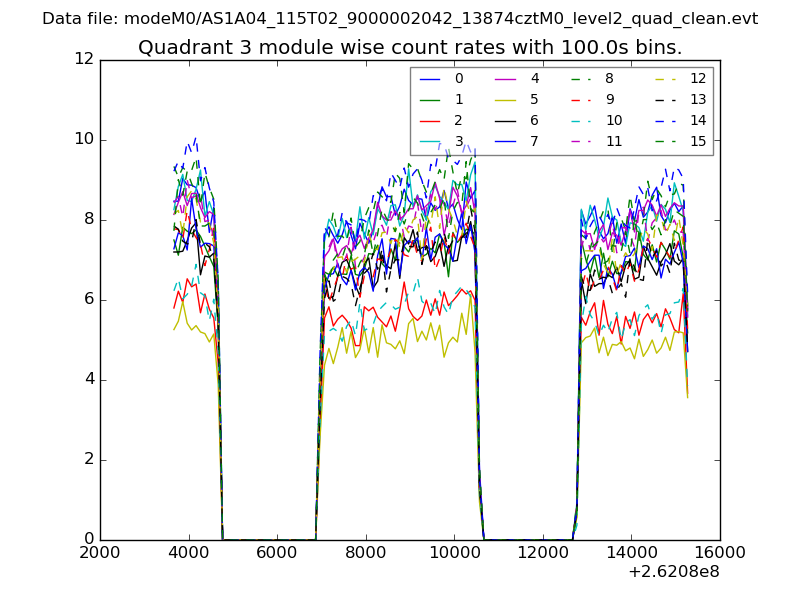
| Module-wise count rates for Quadrant C Data is divided into 100 sec bins |
 |
 |
| Module-wise count rates for Quadrant D Data is divided into 100 sec bins |
 |
 |
| Parameter | Plot |
|---|---|
| CZT HV Monitor | 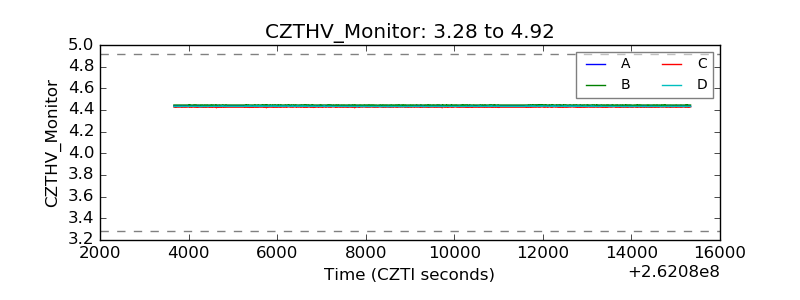 |
| D_VDD | 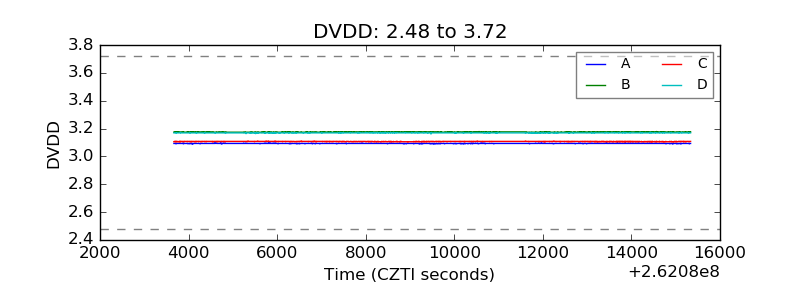 |
| Temperature 1 | 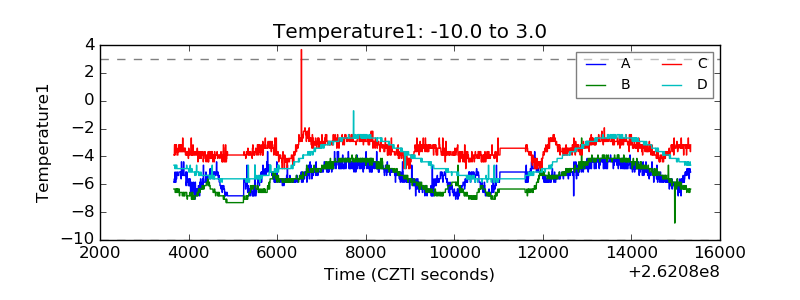 |
| Veto HV Monitor | 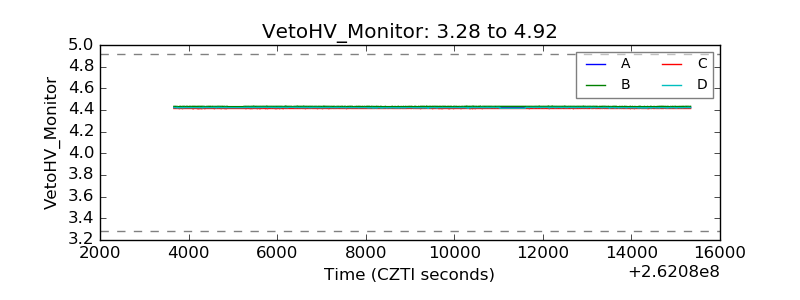 |
| Veto LLD | 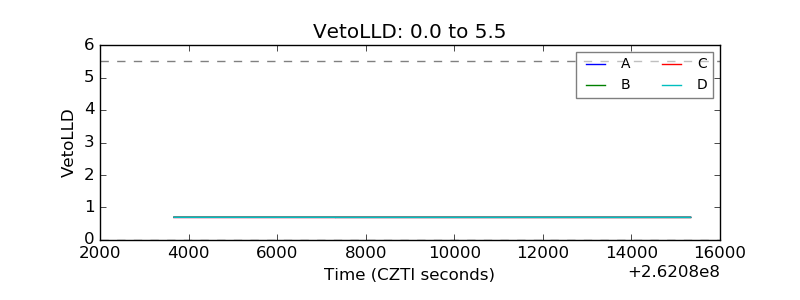 |
| Alpha Counter | 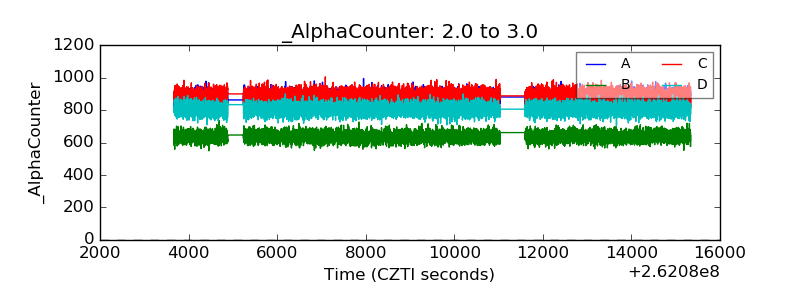 |
| _CPM_Rate | 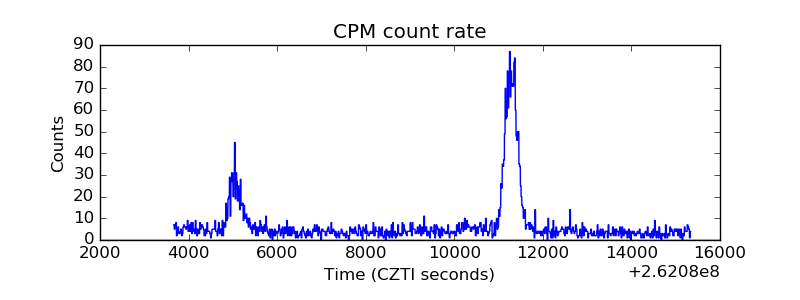 |
| CZT Counter | 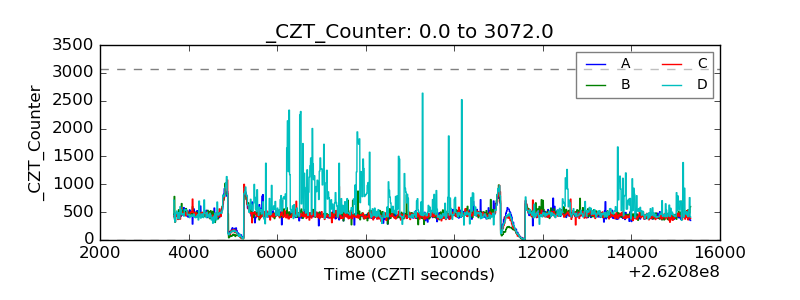 |
| +2.5 Volts monitor |  |
| +5 Volts monitor | 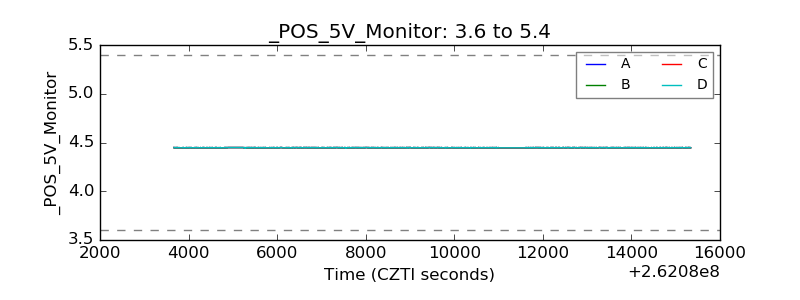 |
| _ROLL_ROT | 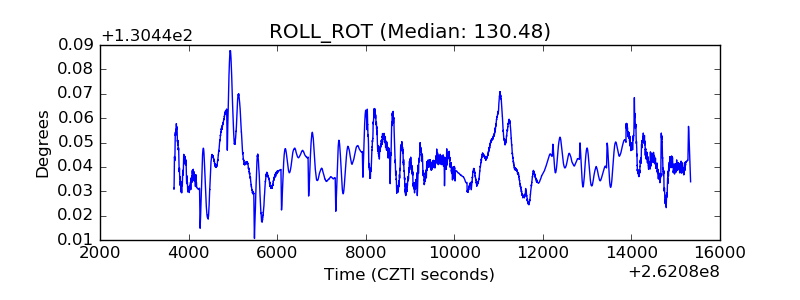 |
| _Roll_DEC | 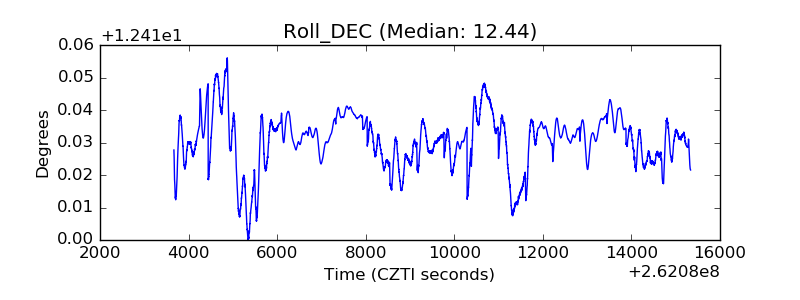 |
| _Roll_RA | 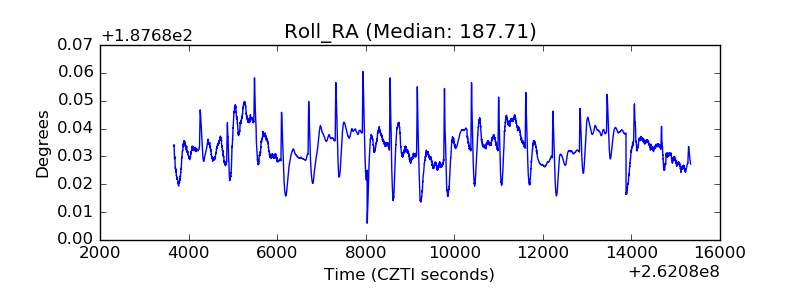 |
| Veto Counter | 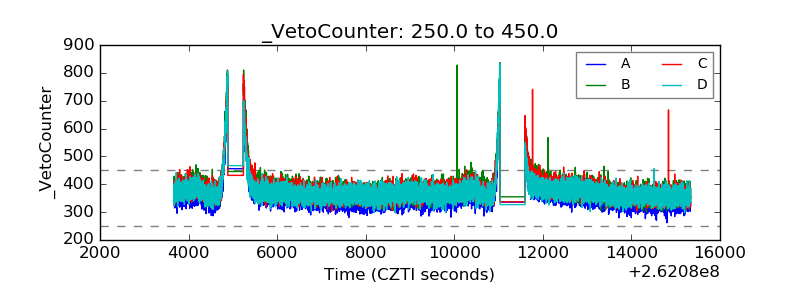 |