| Param | Original file | Final file |
|---|---|---|
| Filename | modeM0/AS1A04_115T02_9000002042_13876cztM0_level2.evt | modeM0/AS1A04_115T02_9000002042_13876cztM0_level2_quad_clean.evt |
| Size (bytes) | 1,026,792,000 | 187,660,800 |
| Size | 979.2 MB | 179.0 MB |
| Events in quadrant A | 6,943,489 | 1,171,824 |
| Events in quadrant B | 7,350,862 | 1,178,670 |
| Events in quadrant C | 6,895,587 | 1,162,516 |
| Events in quadrant D | 8,881,058 | 1,125,087 |
| Mode M9 | |||
|---|---|---|---|
| Quadrant | BADHDUFLAG | Total packets | Discarded packets |
| A | 0 | 10 | 0 |
| B | 0 | 10 | 0 |
| C | 0 | 10 | 0 |
| D | 0 | 10 | 0 |
| Mode M0 | |||
|---|---|---|---|
| Quadrant | BADHDUFLAG | Total packets | Discarded packets |
| A | 0 | 30822 | 2 |
| B | 0 | 31221 | 2 |
| C | 0 | 30842 | 2 |
| D | 0 | 36468 | 2 |
| Mode SS | |||
|---|---|---|---|
| Quadrant | BADHDUFLAG | Total packets | Discarded packets |
| A | 0 | 306 | 0 |
| B | 0 | 306 | 0 |
| C | 0 | 306 | 0 |
| D | 0 | 306 | 0 |
| Quadrant | Total seconds | Saturated seconds | Saturation percentage |
|---|---|---|---|
| A | 15157 | 188 | 1.240351% |
| B | 15157 | 216 | 1.425084% |
| C | 15157 | 137 | 0.903873% |
| D | 15157 | 318 | 2.098041% |
Noise dominated data is calculated using 1-second bins in cleaned event files. If a bin has >2000 counts, and if more than 50% of those come from <1% of pixels, then it is considered to be noise-dominated and hence unusable.
| Quadrant | # 1 sec bins | Bins with >0 counts | Bins with >2000 counts | High rate bins dominated by noise | Noise dominated (total time) | Noise dominated (detector-on time) | Marked lightcurve |
|---|---|---|---|---|---|---|---|
| A | 16078 | 15158 | 0 | 0 | 0.00% | 0.00% | 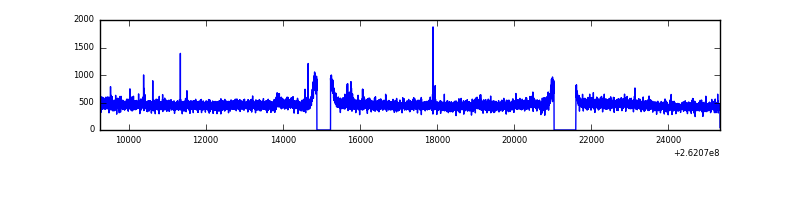 |
| B | 16078 | 15158 | 10 | 10 | 0.06% | 0.07% | 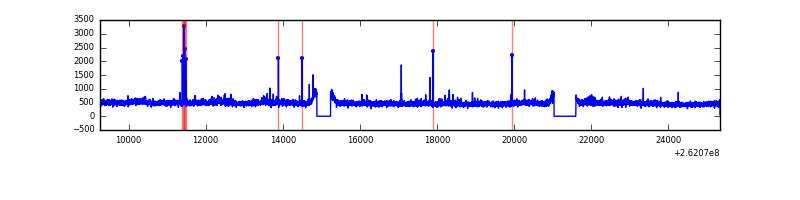 |
| C | 16078 | 15158 | 7 | 7 | 0.04% | 0.05% | 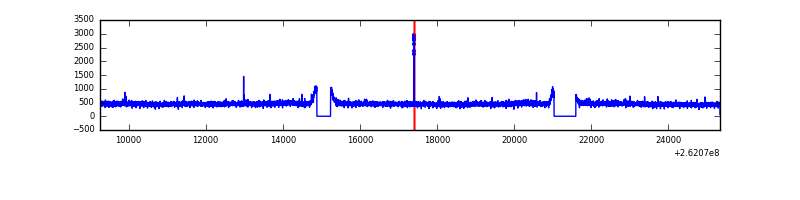 |
| D | 16078 | 15158 | 167 | 167 | 1.04% | 1.10% | 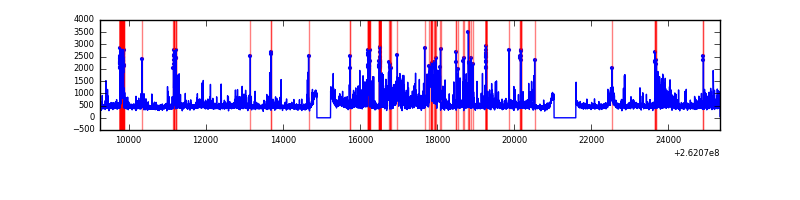 |
Top three noisy pixels from each quadrant. If the there are fewer than three noisy pixels in the level2.evt file, extra rows are filled as -1
| Pixel properties | Quadrant properties | ||||||
|---|---|---|---|---|---|---|---|
| Quadrant | DetID | PixID | Counts | Sigma | Mean | Median | Sigma |
| A | 0 | 23 | 38067 | 99.7 | 1785 | 1740 | 364.4 |
| A | 1 | 162 | 21692 | 54.76 | 1785 | 1740 | 364.4 |
| A | 0 | 226 | 17797 | 44.07 | 1785 | 1740 | 364.4 |
| B | 10 | 244 | 308256 | 902.05 | 1769 | 1723 | 339.8 |
| B | 0 | 214 | 60072 | 171.71 | 1769 | 1723 | 339.8 |
| B | 4 | 80 | 59831 | 171.0 | 1769 | 1723 | 339.8 |
| C | 3 | 233 | 93254 | 225.22 | 1736 | 1745 | 406.3 |
| C | 14 | 234 | 23143 | 52.66 | 1736 | 1745 | 406.3 |
| C | 13 | 61 | 12324 | 26.04 | 1736 | 1745 | 406.3 |
| D | 5 | 222 | 1757858 | 4295.27 | 1720 | 1678 | 408.9 |
| D | 13 | 189 | 238628 | 579.53 | 1720 | 1678 | 408.9 |
| D | 1 | 52 | 117651 | 283.65 | 1720 | 1678 | 408.9 |
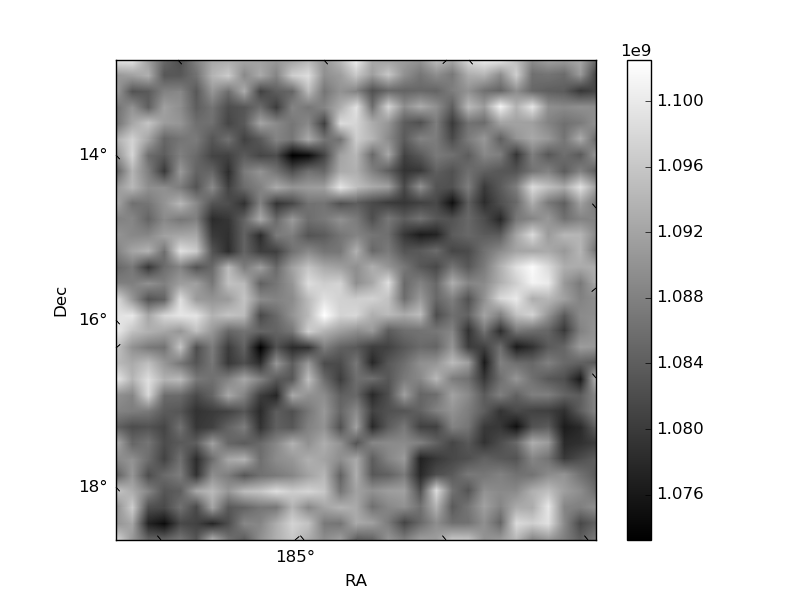
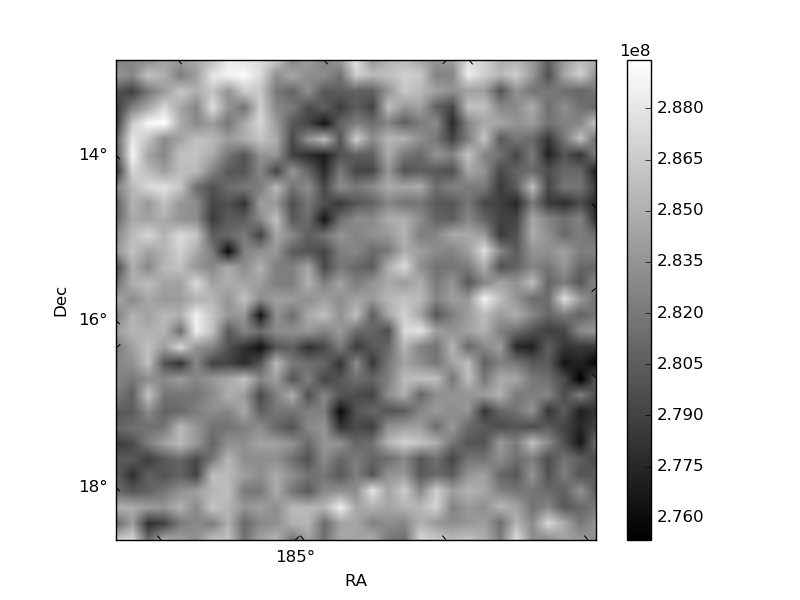
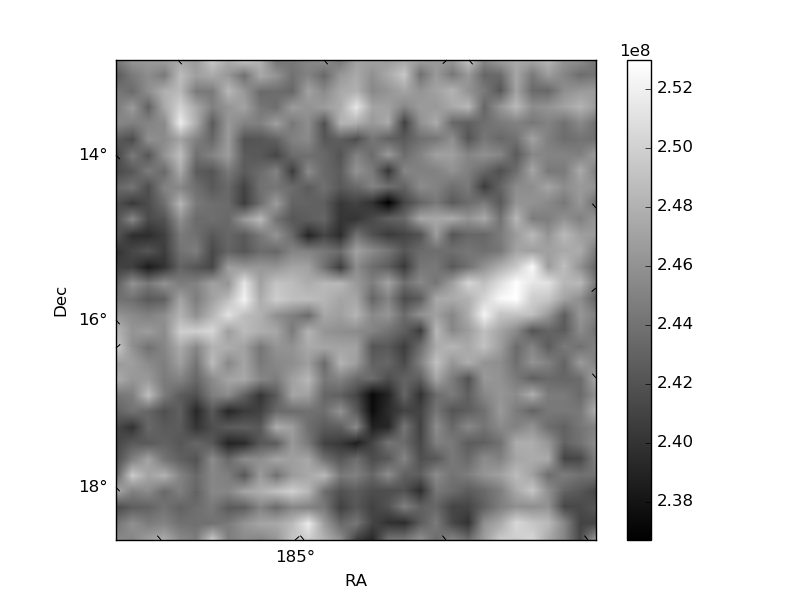
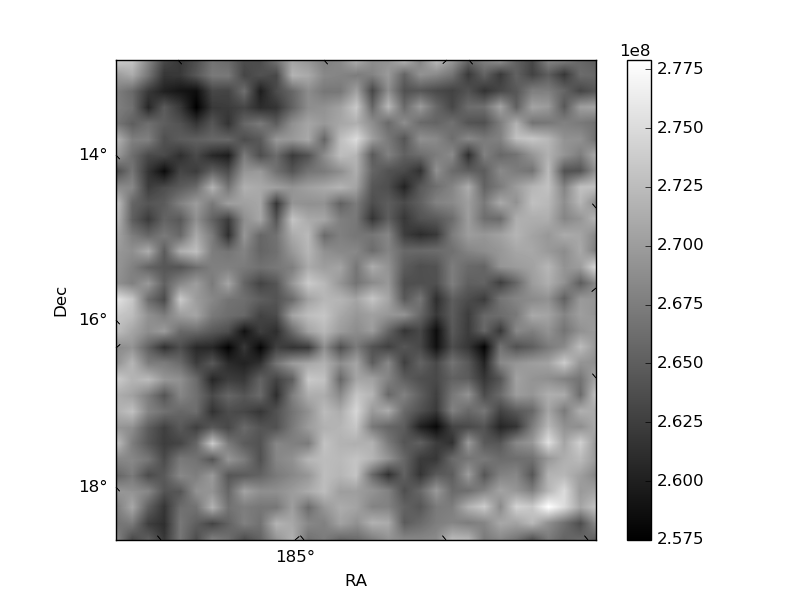
Histogram calculated using DETX and DETY for each event in the final _common_clean file
| Quadrant A | 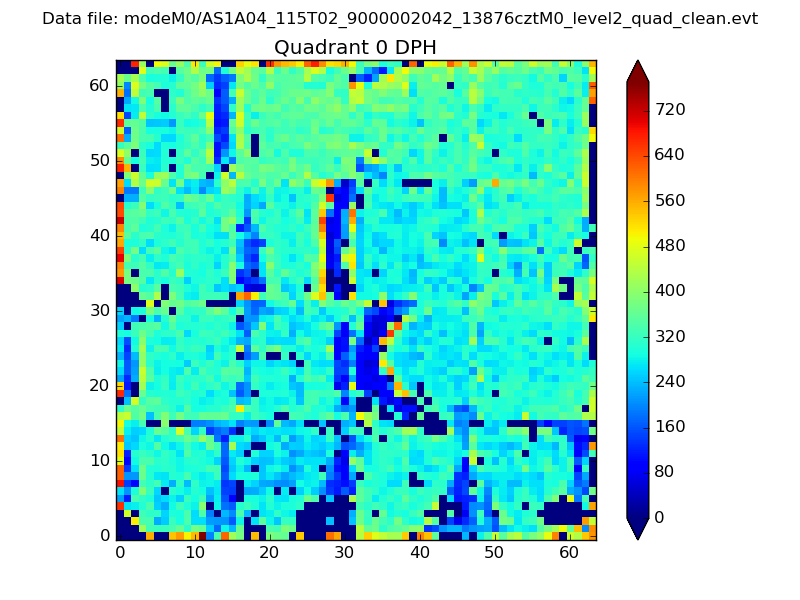 |
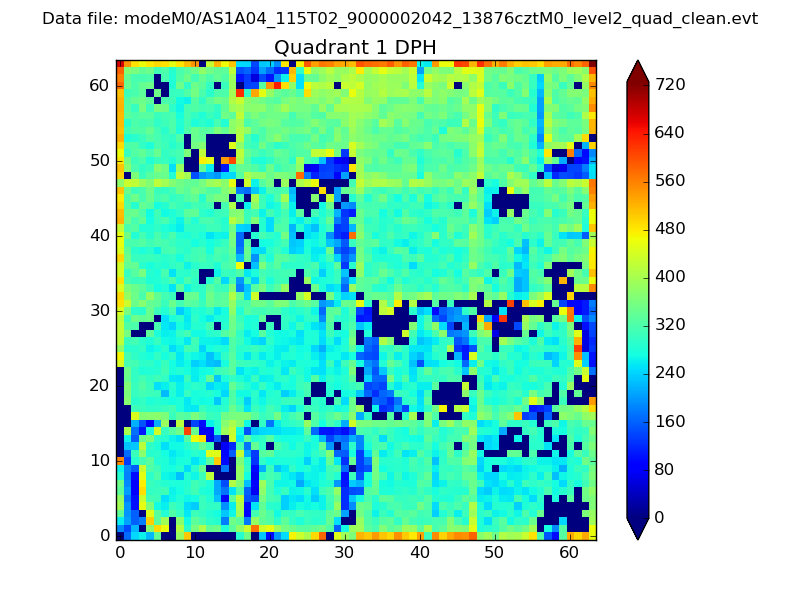 |
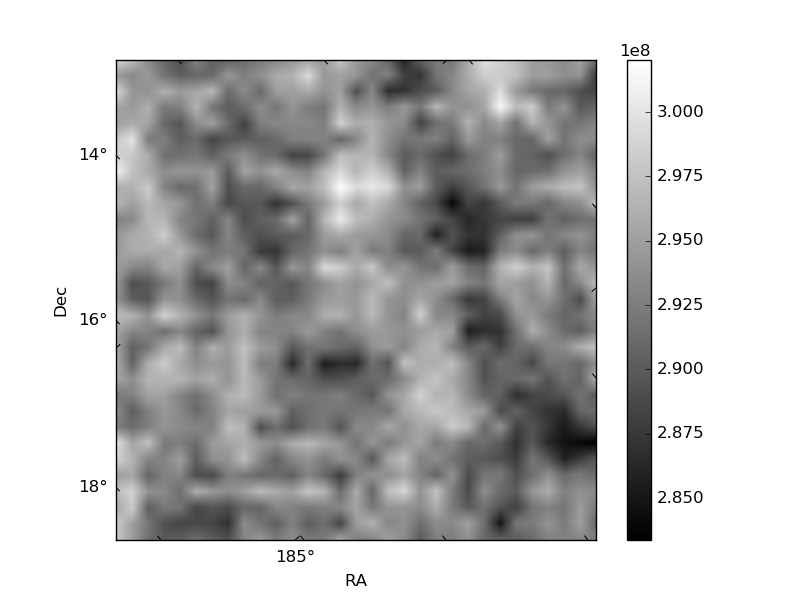
Quadrant B |
|---|---|---|---|
| Quadrant D | 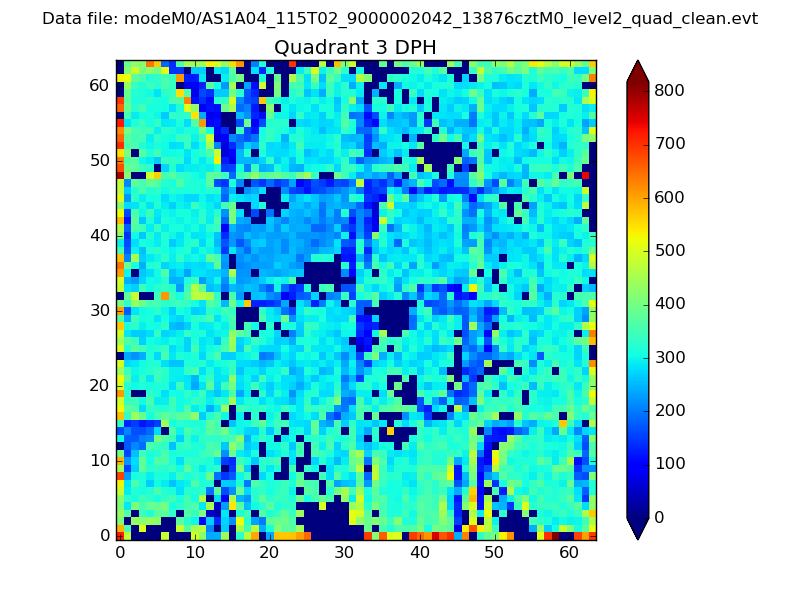 |
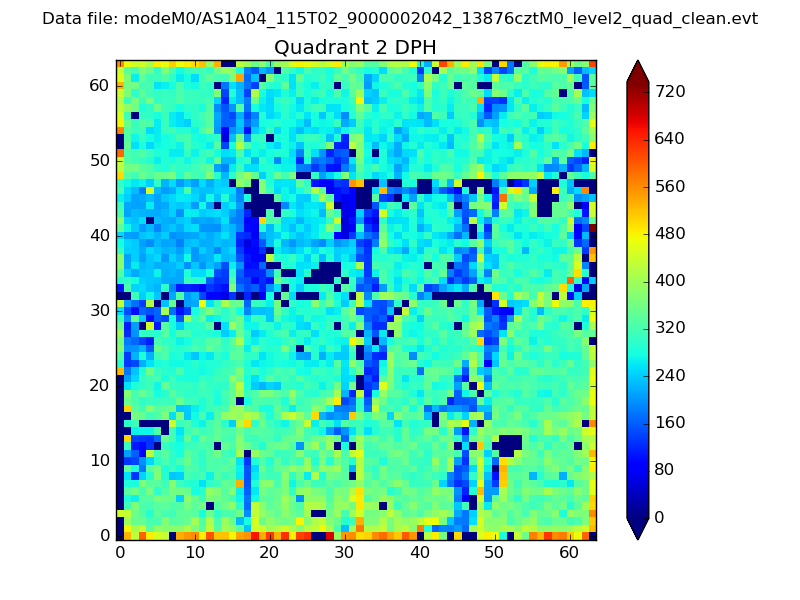 |
Quadrant C |
| Plot type | Count rate plots | Images |
|---|---|---|
| Comparison with Poisson distribution Blue bars denote a histogram of data divided into 1 sec bins. Red curve is a Poisson curve with rate = median count rate of data. |
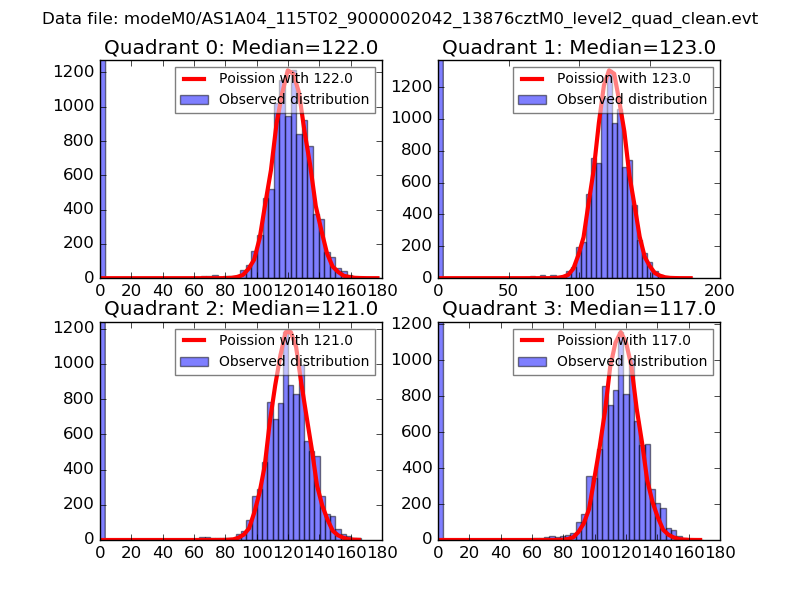 |
 |
| Quadrant-wise count rates Data is divided into 100 sec bins |
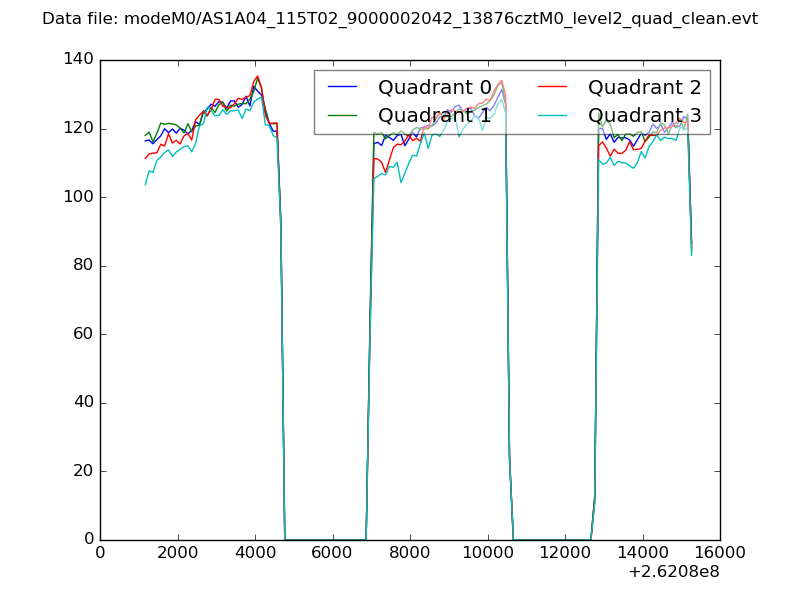 |
|
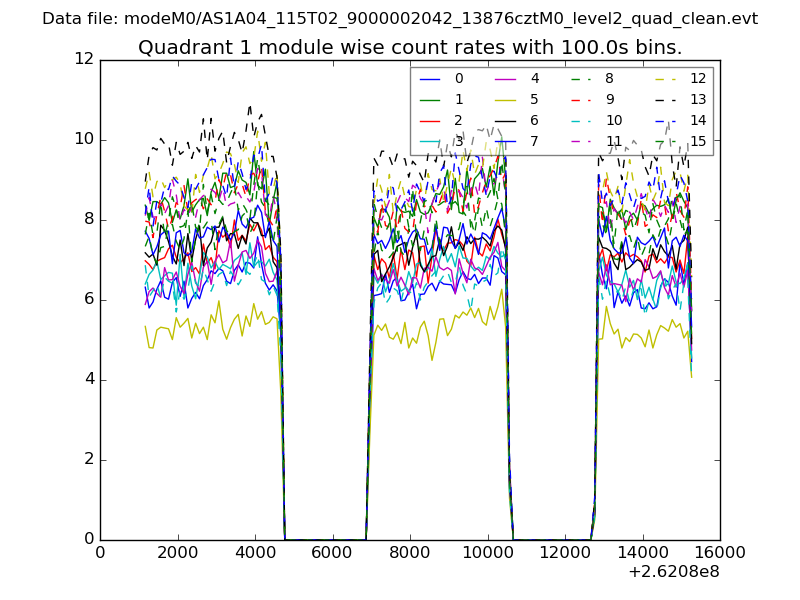
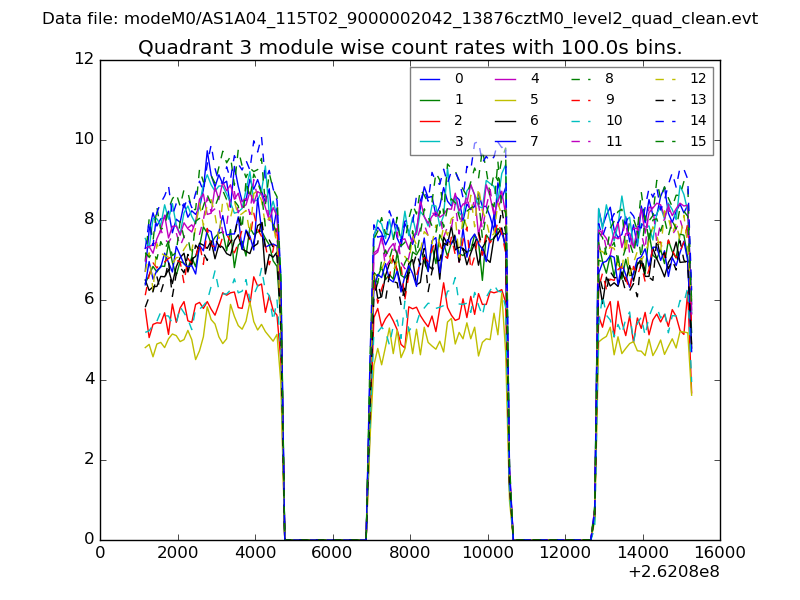
| Module-wise count rates for Quadrant A Data is divided into 100 sec bins |
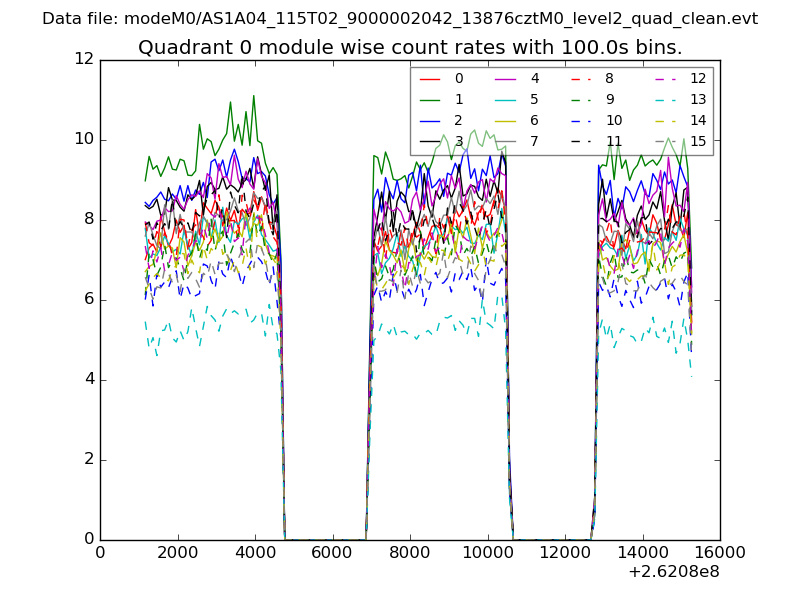 |
 |
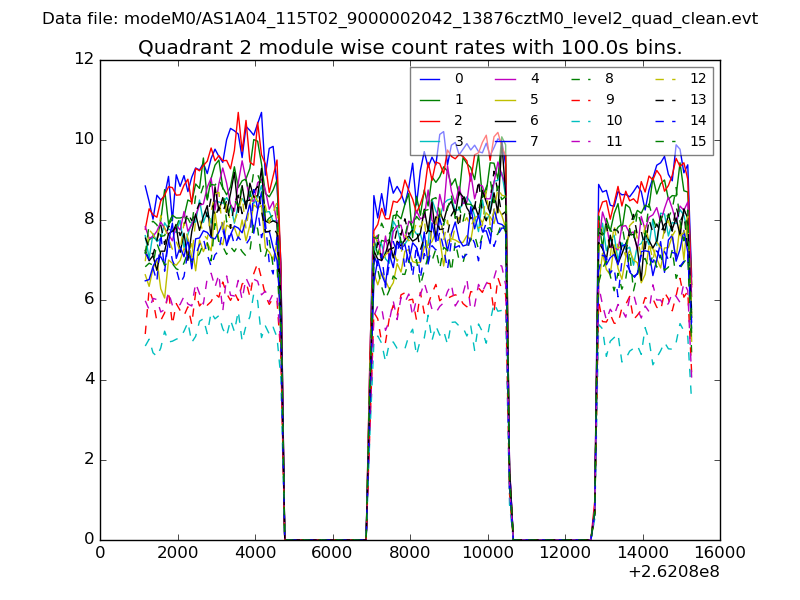
| Module-wise count rates for Quadrant B Data is divided into 100 sec bins |
 |
 |
| Module-wise count rates for Quadrant C Data is divided into 100 sec bins |
 |
 |
| Module-wise count rates for Quadrant D Data is divided into 100 sec bins |
 |
 |
| Parameter | Plot |
|---|---|
| CZT HV Monitor | 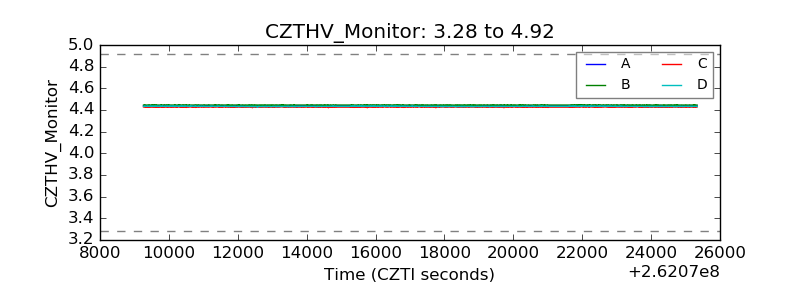 |
| D_VDD | 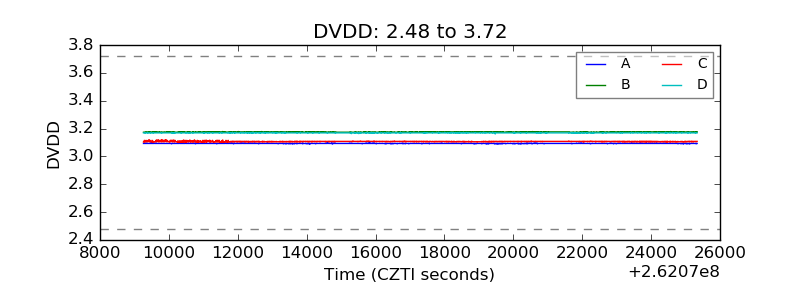 |
| Temperature 1 | 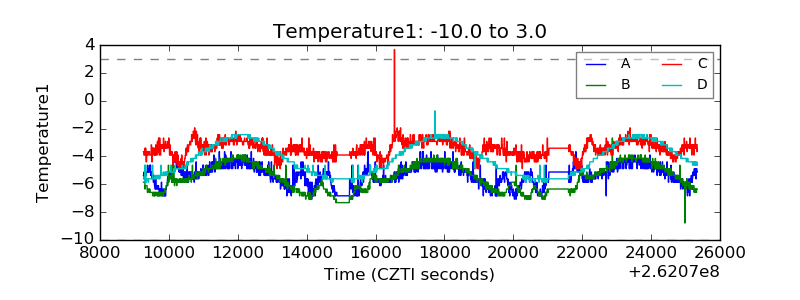 |
| Veto HV Monitor | 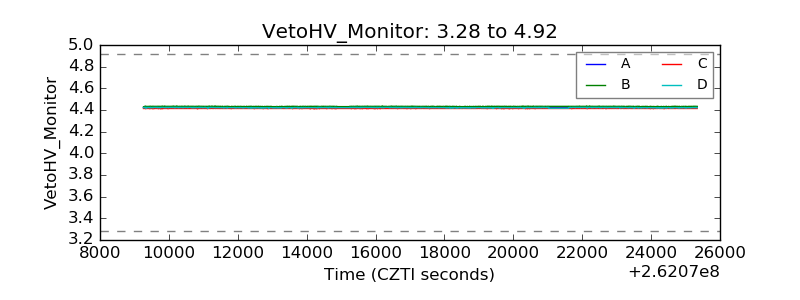 |
| Veto LLD | 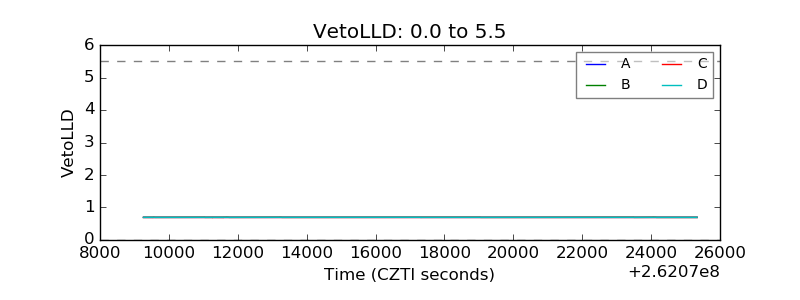 |
| Alpha Counter | 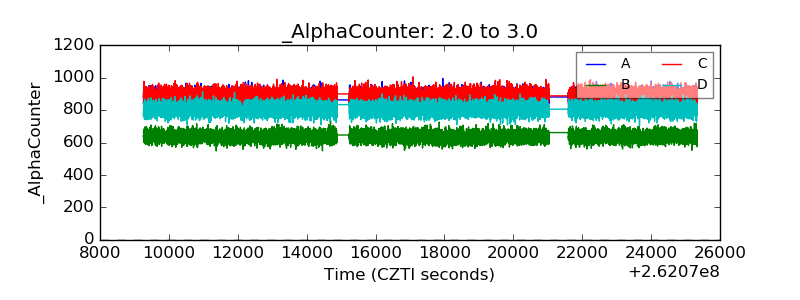 |
| _CPM_Rate | 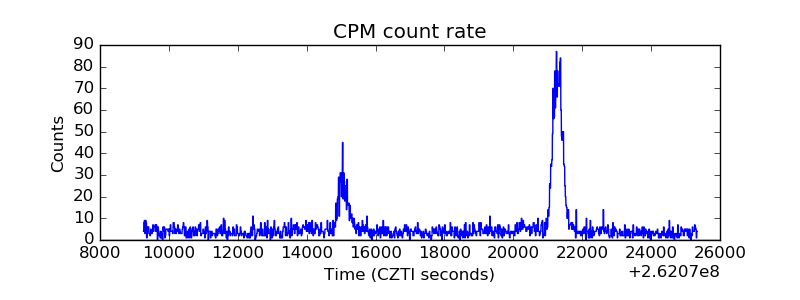 |
| CZT Counter | 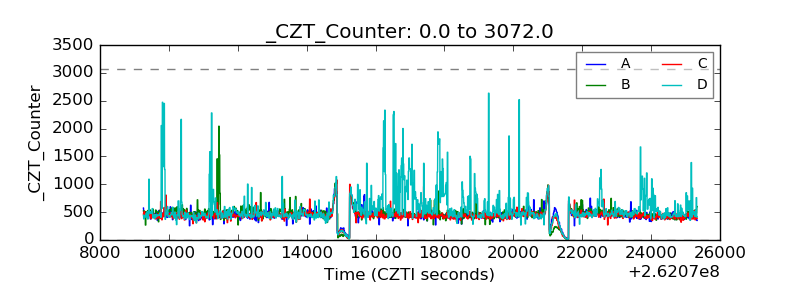 |
| +2.5 Volts monitor |  |
| +5 Volts monitor | 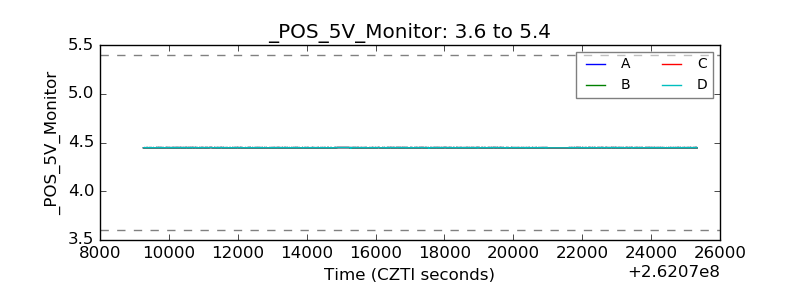 |
| _ROLL_ROT | 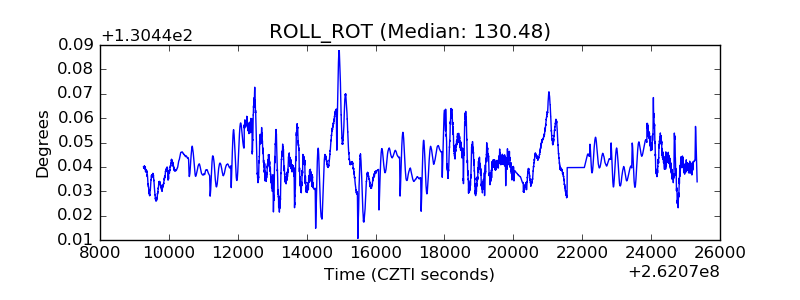 |
| _Roll_DEC | 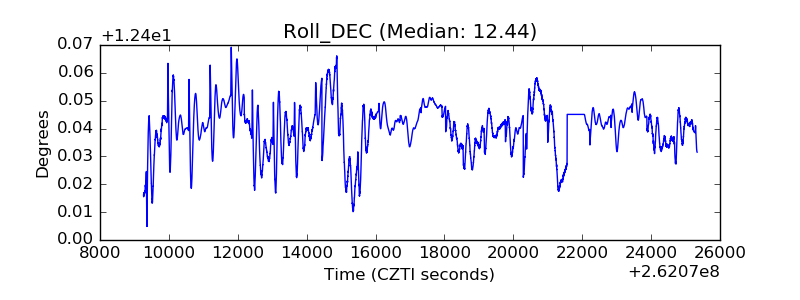 |
| _Roll_RA | 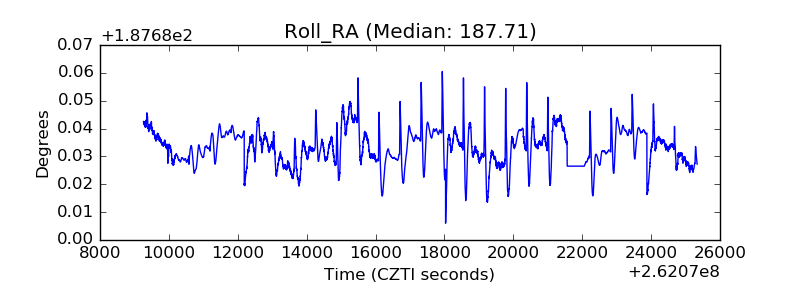 |
| Veto Counter | 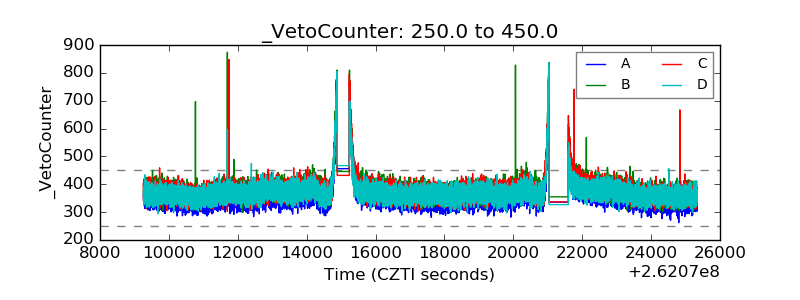 |