| Param | Original file | Final file |
|---|---|---|
| Filename | modeM0/AS1A04_010T01_9000002046cztM0_level2.fits | modeM0/AS1A04_010T01_9000002046cztM0_level2_quad_clean.evt |
| Size (bytes) | 698,938,560 | 609,024,960 |
| Size | 666.6 MB | 580.8 MB |
| Events in quadrant A | 4,244,112 | 3,532,526 |
| Events in quadrant B | 4,120,708 | 3,538,661 |
| Events in quadrant C | 4,203,062 | 3,371,493 |
| Events in quadrant D | 3,539,228 | 2,942,187 |
| Mode M9 | |||
|---|---|---|---|
| Quadrant | BADHDUFLAG | Total packets | Discarded packets |
| A | 0 | 119 | 0 |
| B | 0 | 119 | 0 |
| C | 0 | 119 | 0 |
| D | 0 | 119 | 0 |
| Mode SS | |||
|---|---|---|---|
| Quadrant | BADHDUFLAG | Total packets | Discarded packets |
| A | 0 | 1504 | 0 |
| B | 0 | 1504 | 0 |
| C | 0 | 1504 | 0 |
| D | 0 | 1504 | 0 |
| Mode M0 | |||
|---|---|---|---|
| Quadrant | BADHDUFLAG | Total packets | Discarded packets |
| A | 0 | 159315 | 0 |
| B | 0 | 155724 | 0 |
| C | 0 | 156576 | 0 |
| D | 0 | 215372 | 0 |
| Quadrant | Total seconds | Saturated seconds | Saturation percentage |
|---|---|---|---|
| A | 73764 | 1822 | 2.470040% |
| B | 73764 | 1174 | 1.591562% |
| C | 73764 | 1027 | 1.392278% |
| D | 73763 | 4333 | 5.874219% |
Noise dominated data is calculated using 1-second bins in cleaned event files. If a bin has >2000 counts, and if more than 50% of those come from <1% of pixels, then it is considered to be noise-dominated and hence unusable.
| Quadrant | # 1 sec bins | Bins with >0 counts | Bins with >2000 counts | High rate bins dominated by noise | Noise dominated (total time) | Noise dominated (detector-on time) | Marked lightcurve |
|---|---|---|---|---|---|---|---|
| A | 85704 | 73751 | 0 | 0 | 0.00% | 0.00% |  |
| B | 85705 | 73750 | 0 | 0 | 0.00% | 0.00% |  |
| C | 85705 | 73747 | 0 | 0 | 0.00% | 0.00% |  |
| D | 85705 | 73729 | 0 | 0 | 0.00% | 0.00% |  |
Top three noisy pixels from each quadrant. If the there are fewer than three noisy pixels in the level2.evt file, extra rows are filled as -1
| Pixel properties | Quadrant properties | ||||||
|---|---|---|---|---|---|---|---|
| Quadrant | DetID | PixID | Counts | Sigma | Mean | Median | Sigma |
| A | 0 | 29 | 4004 | 10.74 | 1104 | 1027 | 277.3 |
| A | 7 | 110 | 3479 | 8.84 | 1104 | 1027 | 277.3 |
| A | 9 | 19 | 3161 | 7.7 | 1104 | 1027 | 277.3 |
| B | 2 | 9 | 3504 | 11.48 | 1085 | 1031 | 215.3 |
| B | 3 | 17 | 2855 | 8.47 | 1085 | 1031 | 215.3 |
| B | 14 | 254 | 2770 | 8.08 | 1085 | 1031 | 215.3 |
| C | 12 | 241 | 2850 | 6.22 | 1111 | 1029 | 292.6 |
| C | 2 | 191 | 2825 | 6.14 | 1111 | 1029 | 292.6 |
| C | 3 | 126 | 2812 | 6.09 | 1111 | 1029 | 292.6 |
| D | 6 | 231 | 2680 | 6.46 | 1010 | 917 | 272.8 |
| D | 3 | 14 | 2533 | 5.92 | 1010 | 917 | 272.8 |
| D | 4 | 160 | 2511 | 5.84 | 1010 | 917 | 272.8 |
Histogram calculated using DETX and DETY for each event in the final _common_clean file
| Quadrant A | 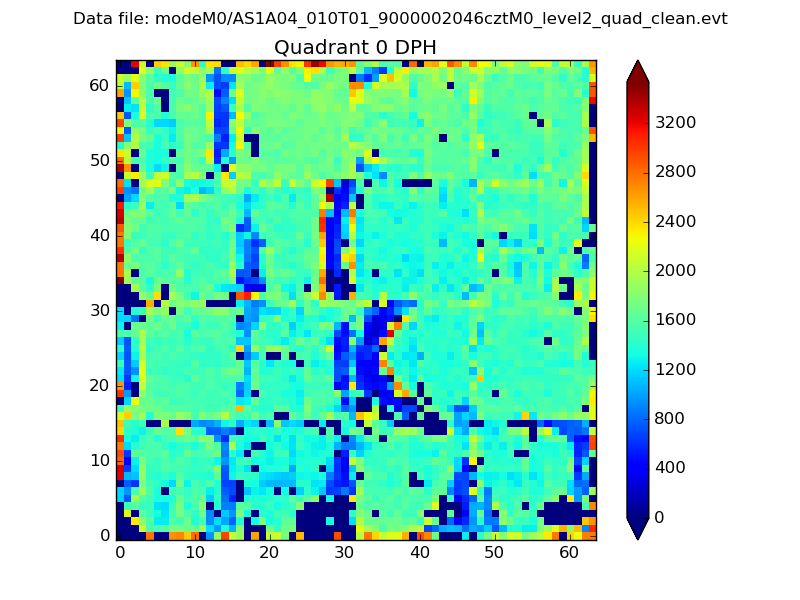 |
 |
Quadrant B |
|---|---|---|---|
| Quadrant D |  |
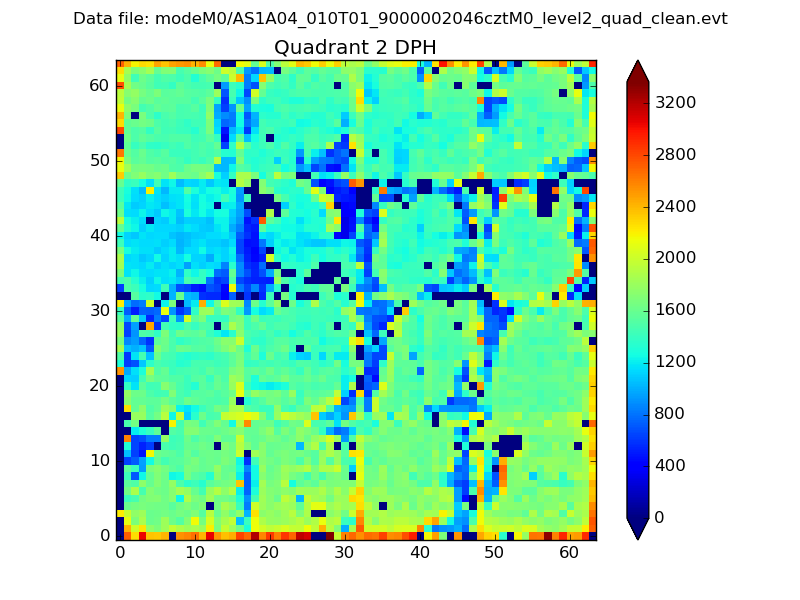 |
Quadrant C |
| Plot type | Count rate plots | Images |
|---|---|---|
| Comparison with Poisson distribution Blue bars denote a histogram of data divided into 1 sec bins. Red curve is a Poisson curve with rate = median count rate of data. |
 |
 |
| Quadrant-wise count rates Data is divided into 100 sec bins |
 |
|
| Module-wise count rates for Quadrant A Data is divided into 100 sec bins |
 |
 |
| Module-wise count rates for Quadrant B Data is divided into 100 sec bins |
 |
 |
| Module-wise count rates for Quadrant C Data is divided into 100 sec bins |
 |
 |
| Module-wise count rates for Quadrant D Data is divided into 100 sec bins |
 |
 |
| Parameter | Plot |
|---|---|
| CZT HV Monitor |  |
| D_VDD |  |
| Temperature 1 |  |
| Veto HV Monitor |  |
| Veto LLD |  |
| Alpha Counter |  |
| _CPM_Rate |  |
| CZT Counter |  |
| +2.5 Volts monitor |  |
| +5 Volts monitor |  |
| _ROLL_ROT |  |
| _Roll_DEC |  |
| _Roll_RA |  |
| Veto Counter |  |