| Param | Original file | Final file |
|---|---|---|
| Filename | modeM0/AS1A04_010T01_9000002046_13879cztM0_level2.evt | modeM0/AS1A04_010T01_9000002046_13879cztM0_level2_quad_clean.evt |
| Size (bytes) | 213,557,760 | 31,985,280 |
| Size | 203.7 MB | 30.5 MB |
| Events in quadrant A | 1,505,204 | 193,856 |
| Events in quadrant B | 1,510,312 | 199,197 |
| Events in quadrant C | 1,442,077 | 195,790 |
| Events in quadrant D | 1,823,575 | 184,683 |
| Mode M9 | |||
|---|---|---|---|
| Quadrant | BADHDUFLAG | Total packets | Discarded packets |
| A | 0 | 12 | 0 |
| B | 0 | 12 | 0 |
| C | 0 | 12 | 0 |
| D | 0 | 12 | 0 |
| Mode SS | |||
|---|---|---|---|
| Quadrant | BADHDUFLAG | Total packets | Discarded packets |
| A | 0 | 58 | 0 |
| B | 0 | 58 | 0 |
| C | 0 | 58 | 0 |
| D | 0 | 58 | 0 |
| Mode M0 | |||
|---|---|---|---|
| Quadrant | BADHDUFLAG | Total packets | Discarded packets |
| A | 0 | 6055 | 2 |
| B | 0 | 6137 | 1 |
| C | 0 | 5870 | 1 |
| D | 0 | 7272 | 1 |
| Quadrant | Total seconds | Saturated seconds | Saturation percentage |
|---|---|---|---|
| A | 2711 | 29 | 1.069716% |
| B | 2711 | 43 | 1.586131% |
| C | 2711 | 15 | 0.553301% |
| D | 2711 | 70 | 2.582073% |
Noise dominated data is calculated using 1-second bins in cleaned event files. If a bin has >2000 counts, and if more than 50% of those come from <1% of pixels, then it is considered to be noise-dominated and hence unusable.
| Quadrant | # 1 sec bins | Bins with >0 counts | Bins with >2000 counts | High rate bins dominated by noise | Noise dominated (total time) | Noise dominated (detector-on time) | Marked lightcurve |
|---|---|---|---|---|---|---|---|
| A | 3952 | 2712 | 0 | 0 | 0.00% | 0.00% | 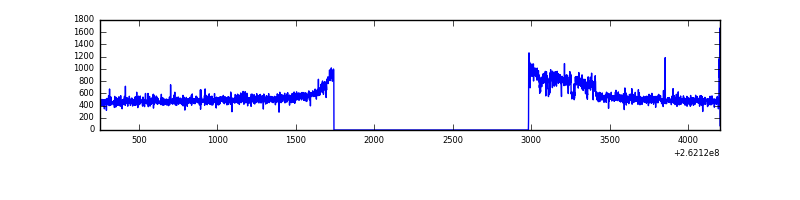 |
| B | 3952 | 2712 | 1 | 1 | 0.03% | 0.04% | 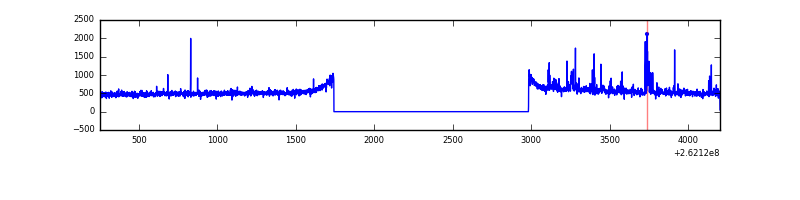 |
| C | 3952 | 2713 | 0 | 0 | 0.00% | 0.00% | 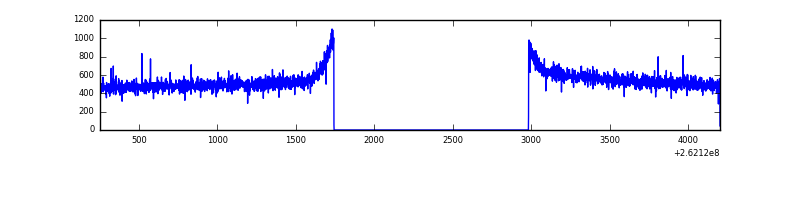 |
| D | 3952 | 2713 | 30 | 30 | 0.76% | 1.11% | 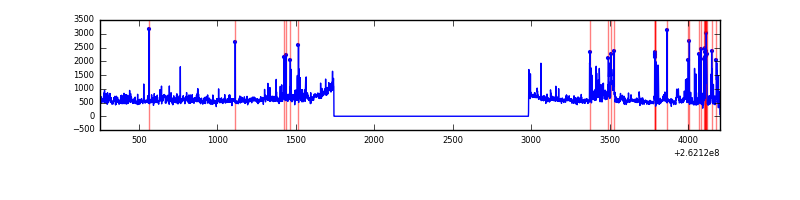 |
Top three noisy pixels from each quadrant. If the there are fewer than three noisy pixels in the level2.evt file, extra rows are filled as -1
| Pixel properties | Quadrant properties | ||||||
|---|---|---|---|---|---|---|---|
| Quadrant | DetID | PixID | Counts | Sigma | Mean | Median | Sigma |
| A | 0 | 23 | 86597 | 1139.38 | 366 | 358 | 75.7 |
| A | 0 | 226 | 8937 | 113.34 | 366 | 358 | 75.7 |
| A | 12 | 194 | 2884 | 33.37 | 366 | 358 | 75.7 |
| B | 0 | 189 | 21719 | 305.25 | 366 | 359 | 70.0 |
| B | 0 | 197 | 20955 | 294.33 | 366 | 359 | 70.0 |
| B | 10 | 244 | 19673 | 276.01 | 366 | 359 | 70.0 |
| C | 3 | 233 | 38060 | 444.77 | 359 | 361 | 84.8 |
| C | 13 | 61 | 2488 | 25.09 | 359 | 361 | 84.8 |
| C | 14 | 234 | 1301 | 11.09 | 359 | 361 | 84.8 |
| D | 13 | 122 | 311202 | 3674.85 | 352 | 344 | 84.6 |
| D | 1 | 52 | 77765 | 915.24 | 352 | 344 | 84.6 |
| D | 13 | 189 | 68633 | 807.29 | 352 | 344 | 84.6 |
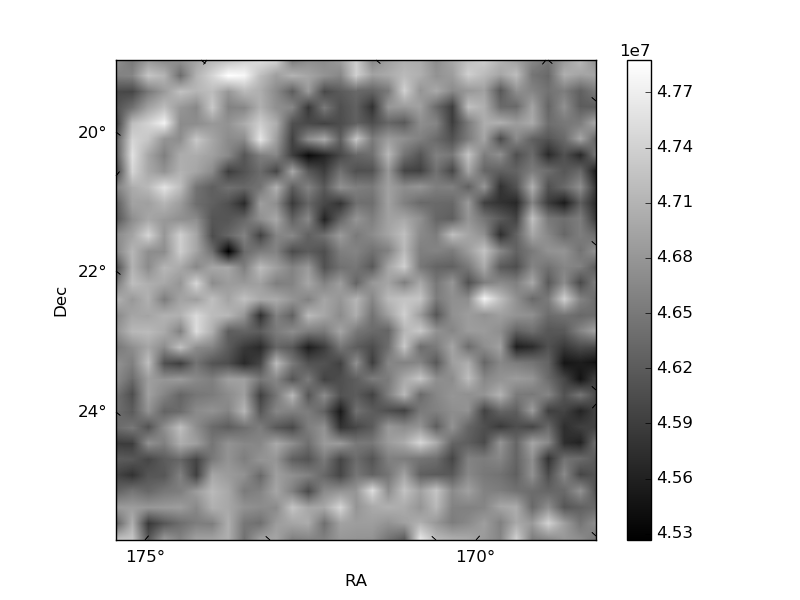
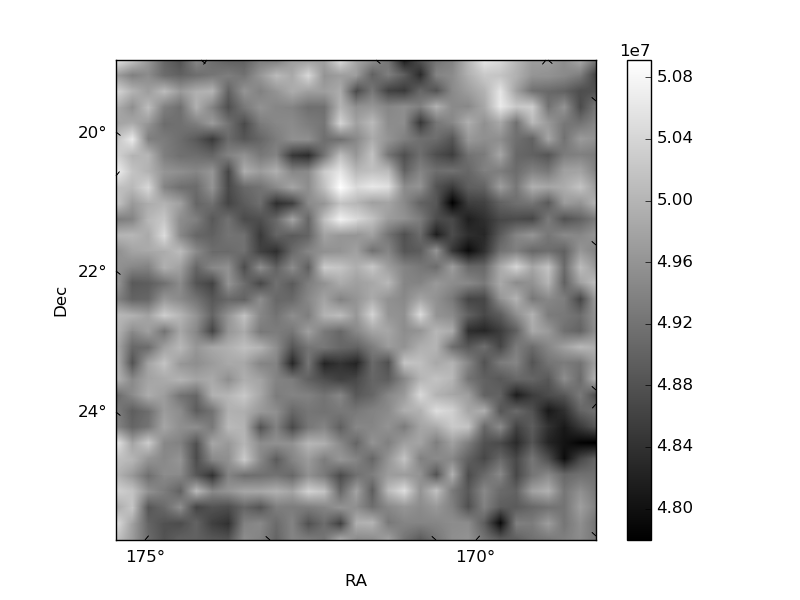
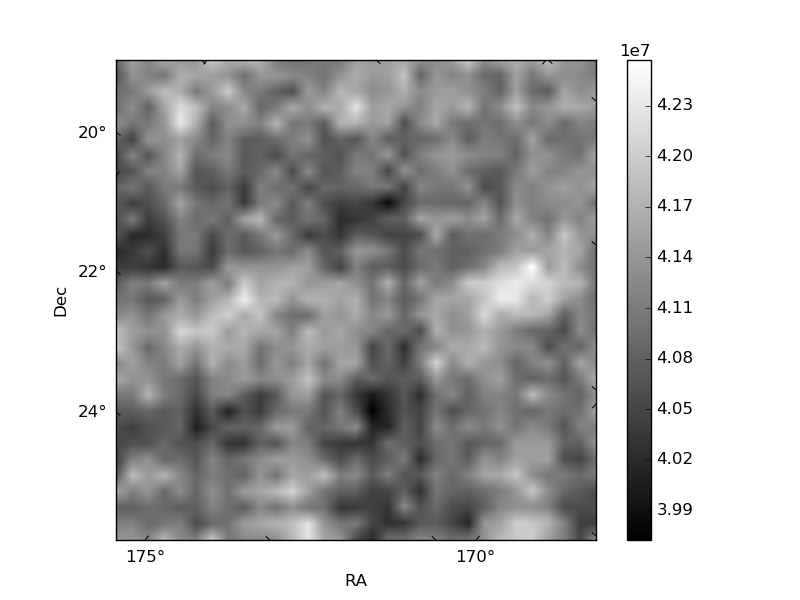
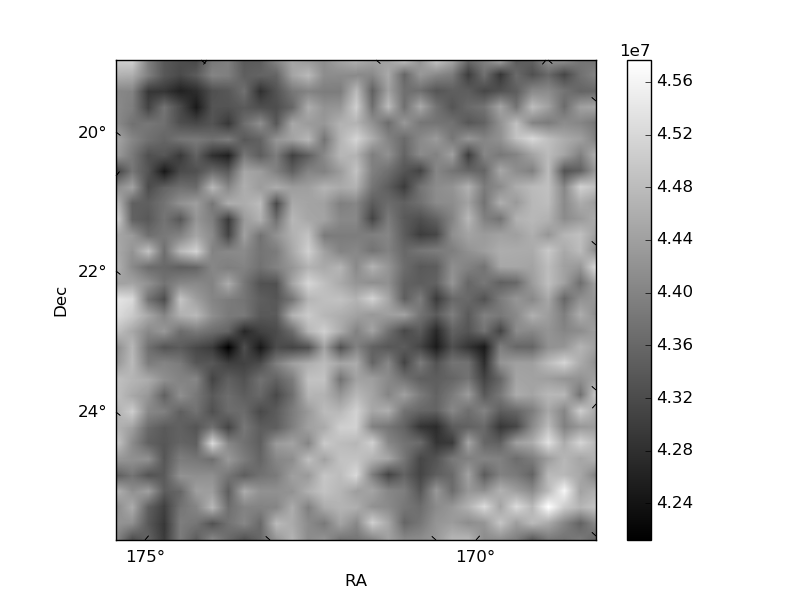
Histogram calculated using DETX and DETY for each event in the final _common_clean file
| Quadrant A | 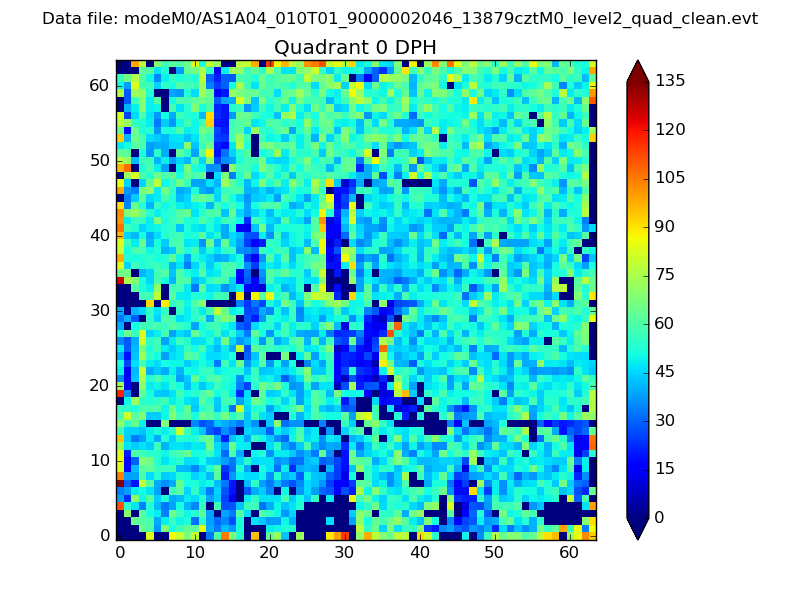 |
 |
Quadrant B |
|---|---|---|---|
| Quadrant D | 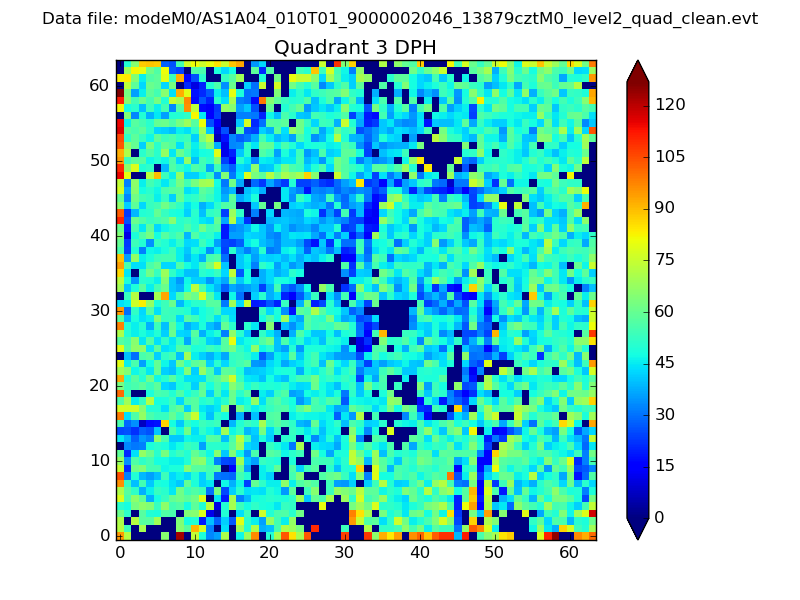 |
 |
Quadrant C |
| Plot type | Count rate plots | Images |
|---|---|---|
| Comparison with Poisson distribution Blue bars denote a histogram of data divided into 1 sec bins. Red curve is a Poisson curve with rate = median count rate of data. |
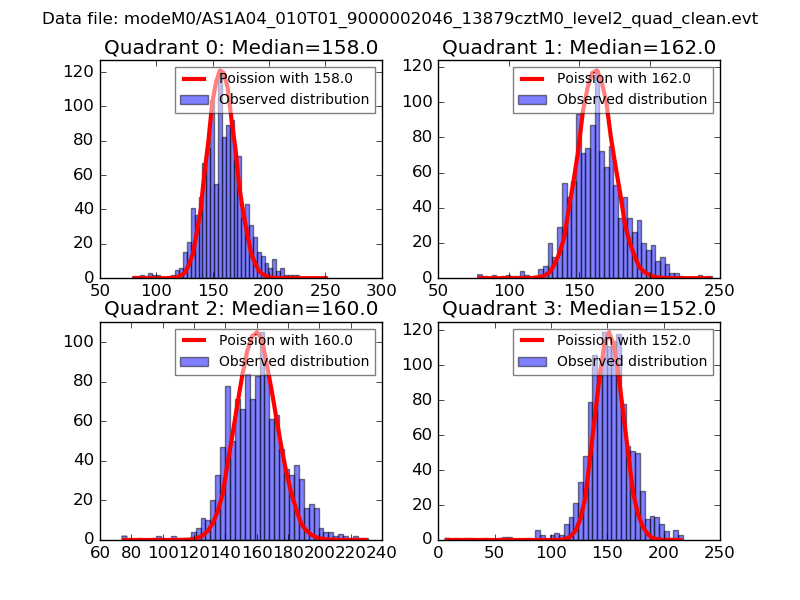 |
 |
| Quadrant-wise count rates Data is divided into 100 sec bins |
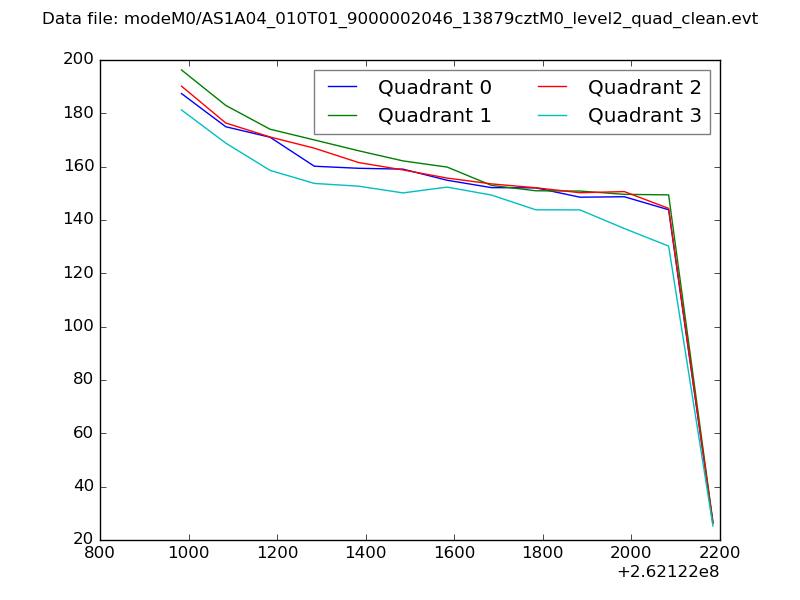 |
|
| Module-wise count rates for Quadrant A Data is divided into 100 sec bins |
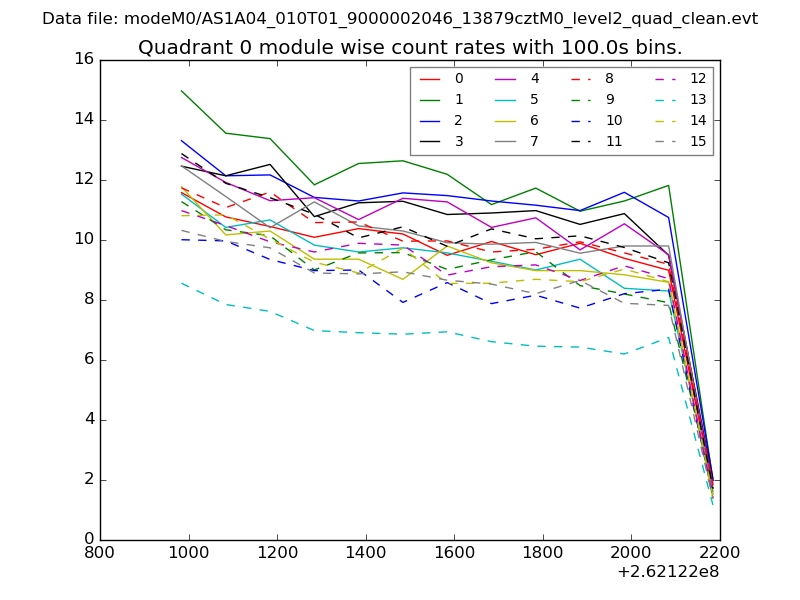 |
 |
| Module-wise count rates for Quadrant B Data is divided into 100 sec bins |
 |
 |
| Module-wise count rates for Quadrant C Data is divided into 100 sec bins |
 |
 |
| Module-wise count rates for Quadrant D Data is divided into 100 sec bins |
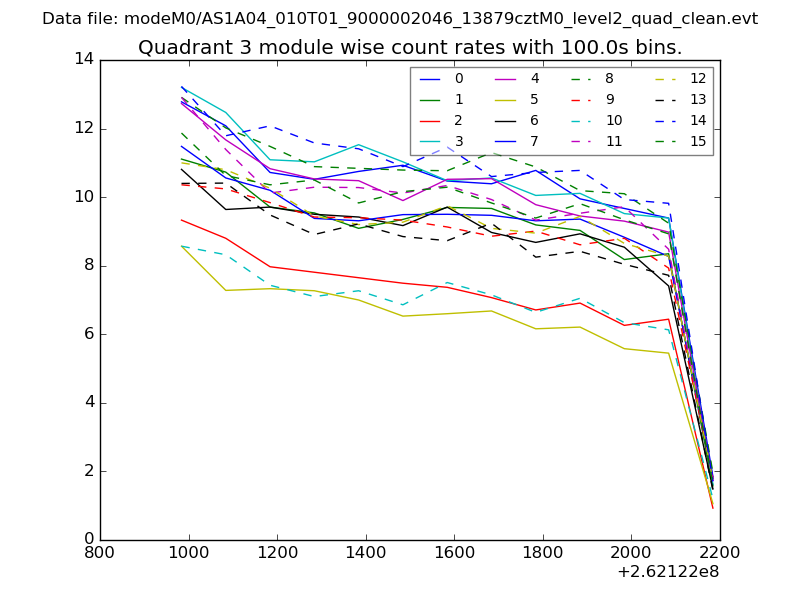 |
 |
| Parameter | Plot |
|---|---|
| CZT HV Monitor | 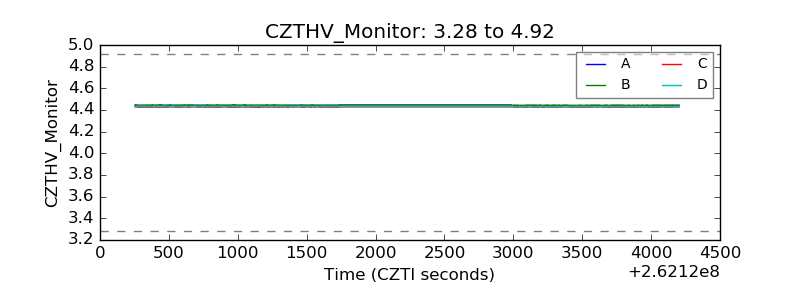 |
| D_VDD | 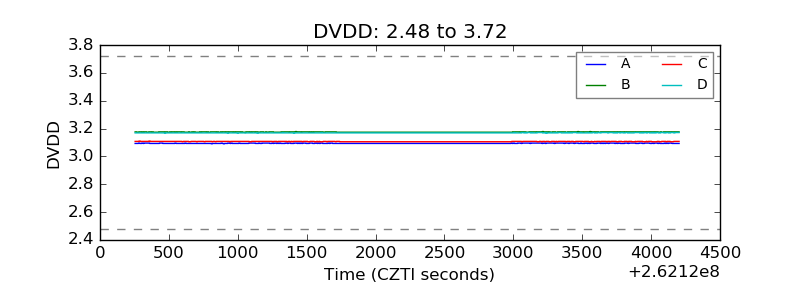 |
| Temperature 1 | 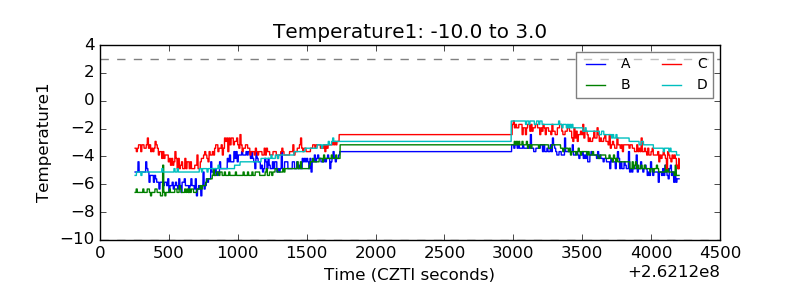 |
| Veto HV Monitor | 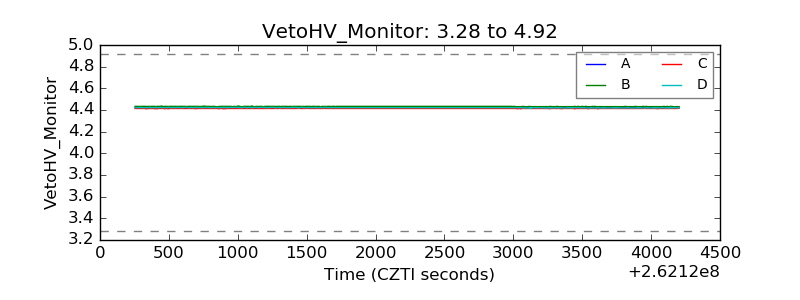 |
| Veto LLD |  |
| Alpha Counter |  |
| _CPM_Rate | 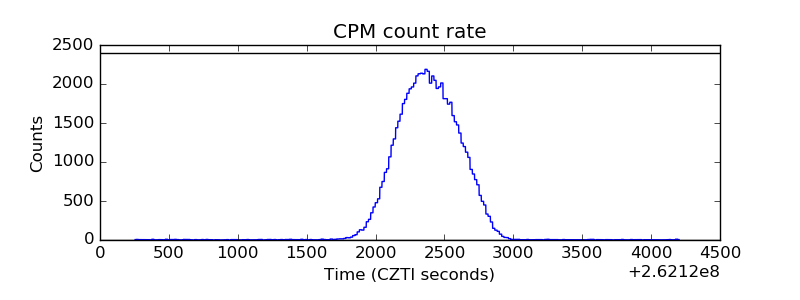 |
| CZT Counter |  |
| +2.5 Volts monitor |  |
| +5 Volts monitor | 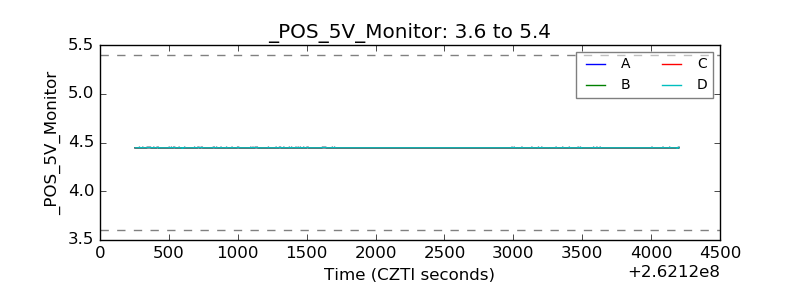 |
| _ROLL_ROT | 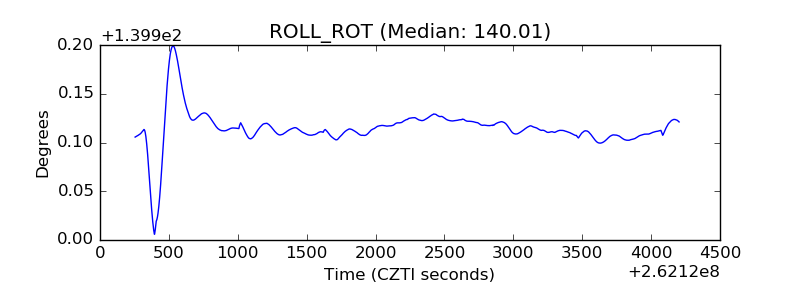 |
| _Roll_DEC | 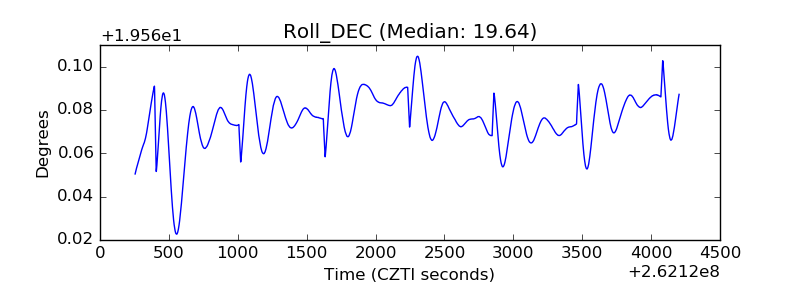 |
| _Roll_RA |  |
| Veto Counter | 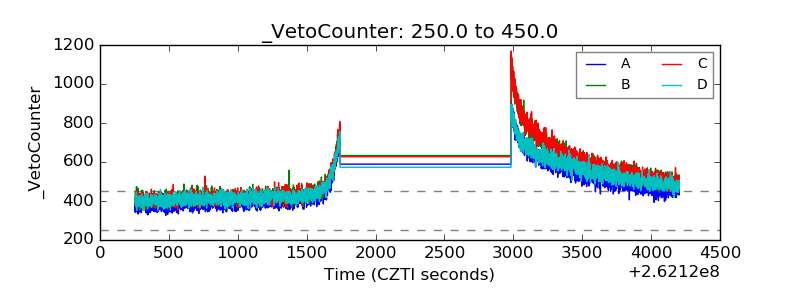 |