| Param | Original file | Final file |
|---|---|---|
| Filename | modeM0/AS1A04_010T01_9000002046_13883cztM0_level2.evt | modeM0/AS1A04_010T01_9000002046_13883cztM0_level2_quad_clean.evt |
| Size (bytes) | 842,685,120 | 146,194,560 |
| Size | 803.6 MB | 139.4 MB |
| Events in quadrant A | 5,599,985 | 919,996 |
| Events in quadrant B | 5,731,483 | 933,061 |
| Events in quadrant C | 5,607,034 | 914,011 |
| Events in quadrant D | 7,792,506 | 853,153 |
| Mode M9 | |||
|---|---|---|---|
| Quadrant | BADHDUFLAG | Total packets | Discarded packets |
| A | 0 | 23 | 0 |
| B | 0 | 23 | 0 |
| C | 0 | 23 | 0 |
| D | 0 | 24 | 0 |
| Mode SS | |||
|---|---|---|---|
| Quadrant | BADHDUFLAG | Total packets | Discarded packets |
| A | 0 | 238 | 0 |
| B | 0 | 238 | 0 |
| C | 0 | 238 | 0 |
| D | 0 | 238 | 0 |
| Mode M0 | |||
|---|---|---|---|
| Quadrant | BADHDUFLAG | Total packets | Discarded packets |
| A | 0 | 24209 | 4 |
| B | 0 | 24560 | 3 |
| C | 0 | 24143 | 3 |
| D | 0 | 31174 | 3 |
| Quadrant | Total seconds | Saturated seconds | Saturation percentage |
|---|---|---|---|
| A | 11667 | 27 | 0.231422% |
| B | 11667 | 71 | 0.608554% |
| C | 11667 | 27 | 0.231422% |
| D | 11667 | 404 | 3.462758% |
Noise dominated data is calculated using 1-second bins in cleaned event files. If a bin has >2000 counts, and if more than 50% of those come from <1% of pixels, then it is considered to be noise-dominated and hence unusable.
| Quadrant | # 1 sec bins | Bins with >0 counts | Bins with >2000 counts | High rate bins dominated by noise | Noise dominated (total time) | Noise dominated (detector-on time) | Marked lightcurve |
|---|---|---|---|---|---|---|---|
| A | 13798 | 11669 | 2 | 2 | 0.01% | 0.02% | 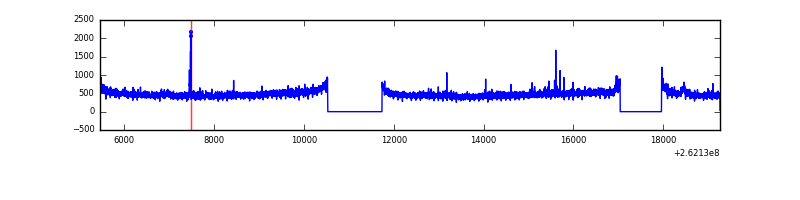 |
| B | 13798 | 11670 | 9 | 9 | 0.07% | 0.08% | 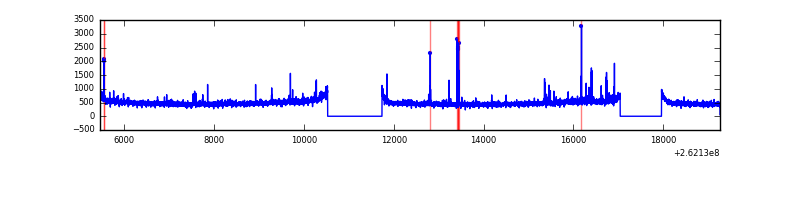 |
| C | 13798 | 11670 | 3 | 3 | 0.02% | 0.03% | 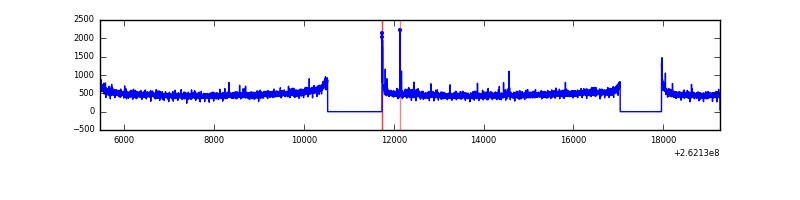 |
| D | 13798 | 11669 | 359 | 359 | 2.60% | 3.08% | 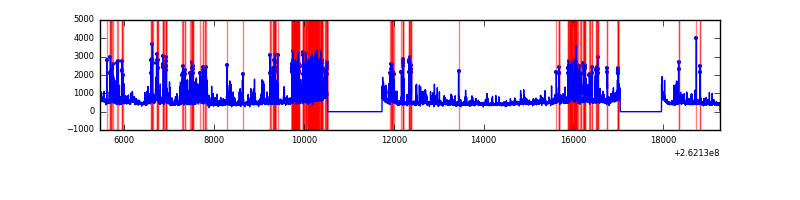 |
Top three noisy pixels from each quadrant. If the there are fewer than three noisy pixels in the level2.evt file, extra rows are filled as -1
| Pixel properties | Quadrant properties | ||||||
|---|---|---|---|---|---|---|---|
| Quadrant | DetID | PixID | Counts | Sigma | Mean | Median | Sigma |
| A | 0 | 23 | 46402 | 157.03 | 1415 | 1385 | 286.7 |
| A | 15 | 69 | 39641 | 133.45 | 1415 | 1385 | 286.7 |
| A | 8 | 15 | 34324 | 114.9 | 1415 | 1385 | 286.7 |
| B | 3 | 209 | 41981 | 152.05 | 1415 | 1384 | 267.0 |
| B | 0 | 230 | 36435 | 131.28 | 1415 | 1384 | 267.0 |
| B | 4 | 80 | 35173 | 126.55 | 1415 | 1384 | 267.0 |
| C | 3 | 233 | 249310 | 777.16 | 1373 | 1379 | 319.0 |
| C | 13 | 61 | 9624 | 25.84 | 1373 | 1379 | 319.0 |
| C | 12 | 4 | 8214 | 21.42 | 1373 | 1379 | 319.0 |
| D | 1 | 52 | 1490739 | 4714.54 | 1339 | 1311 | 315.9 |
| D | 5 | 222 | 627060 | 1980.71 | 1339 | 1311 | 315.9 |
| D | 13 | 189 | 122186 | 382.61 | 1339 | 1311 | 315.9 |
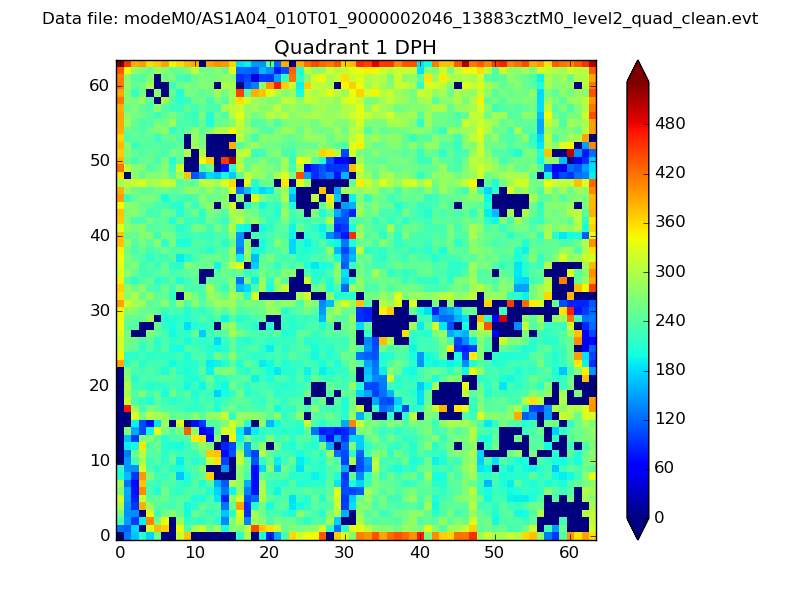
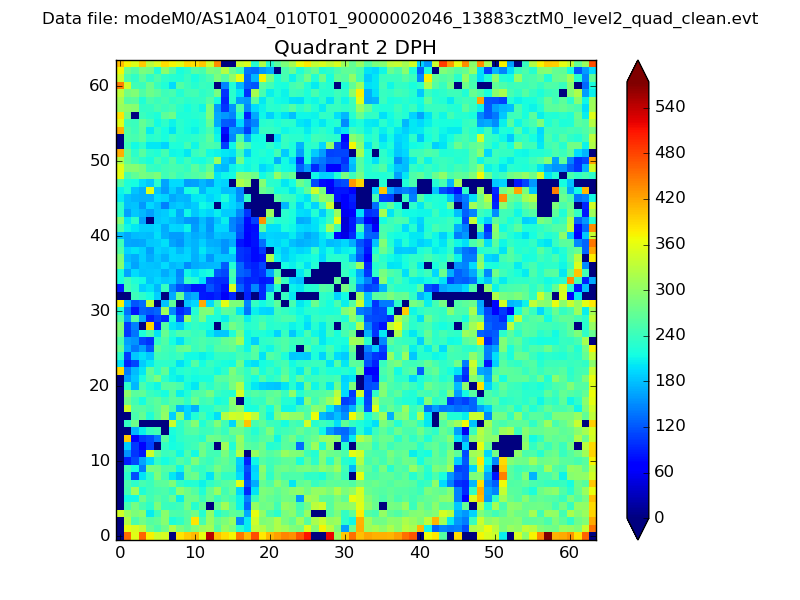
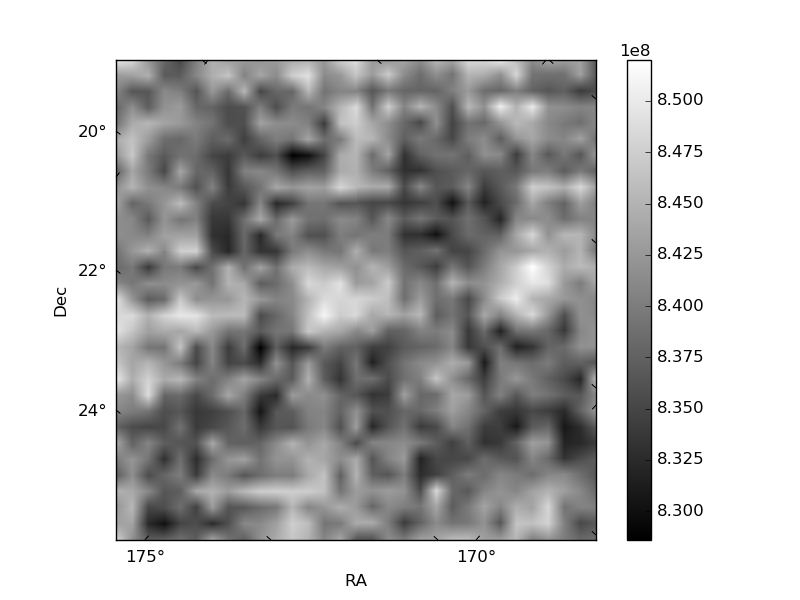
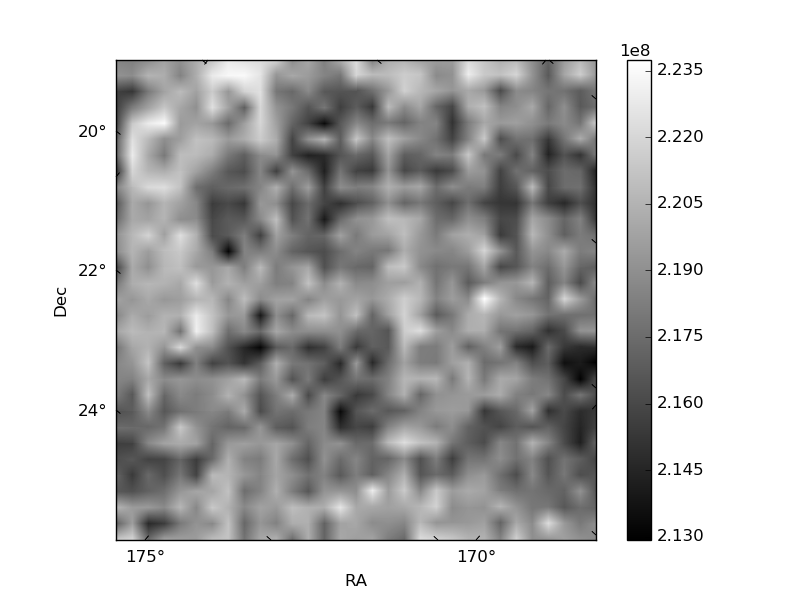
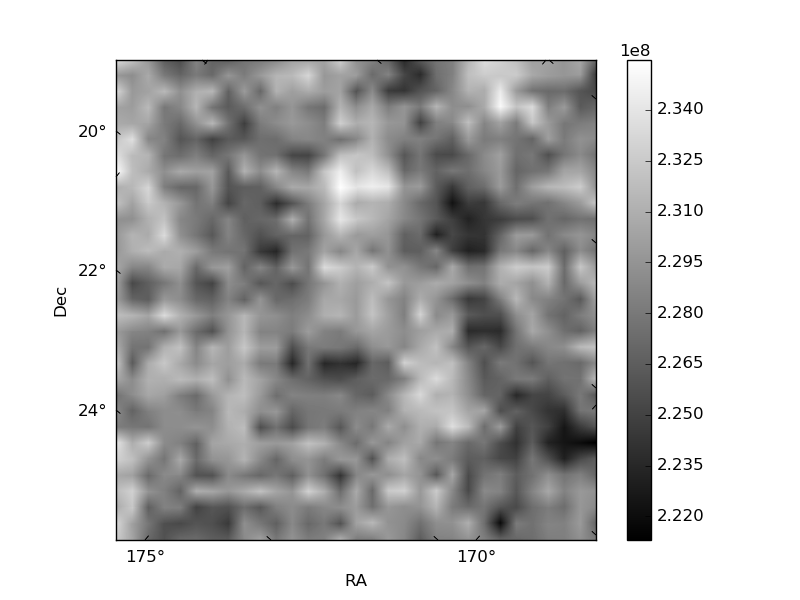
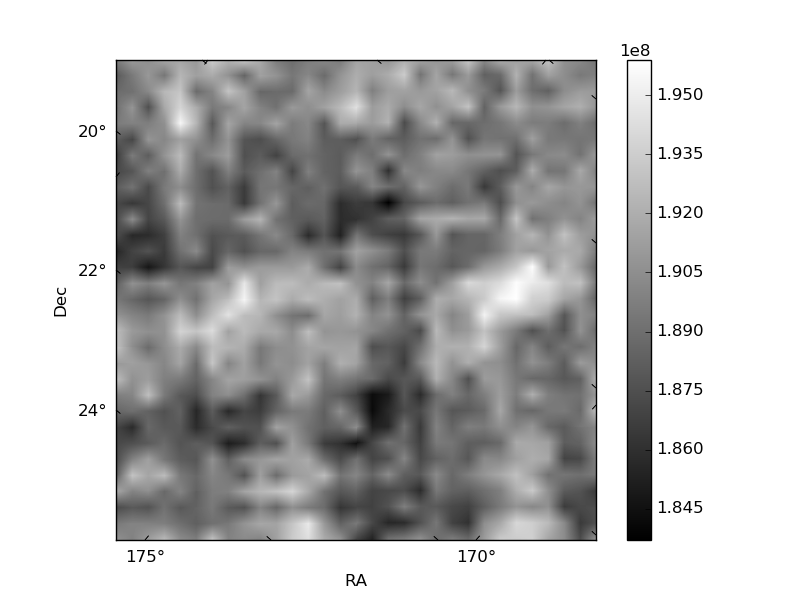
Histogram calculated using DETX and DETY for each event in the final _common_clean file
| Quadrant A |  |
 |
Quadrant B |
|---|---|---|---|
| Quadrant D | 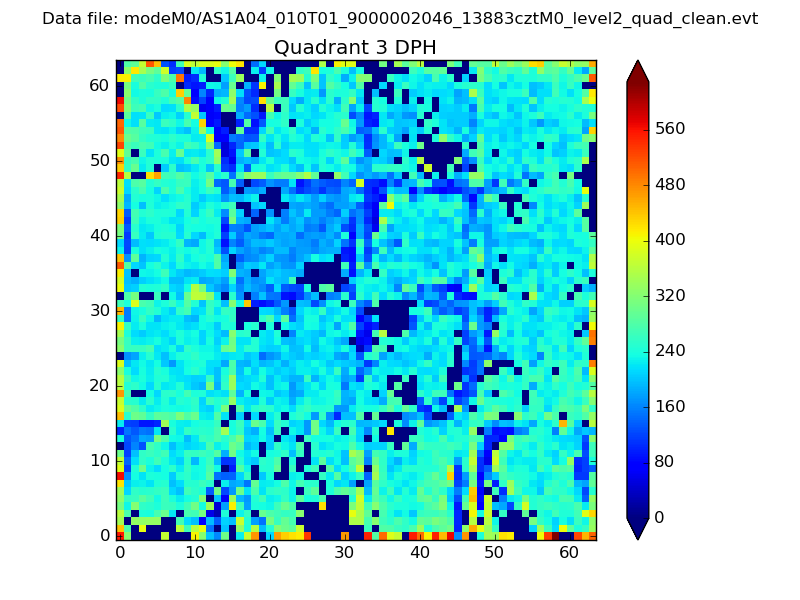 |
 |
Quadrant C |
| Plot type | Count rate plots | Images |
|---|---|---|
| Comparison with Poisson distribution Blue bars denote a histogram of data divided into 1 sec bins. Red curve is a Poisson curve with rate = median count rate of data. |
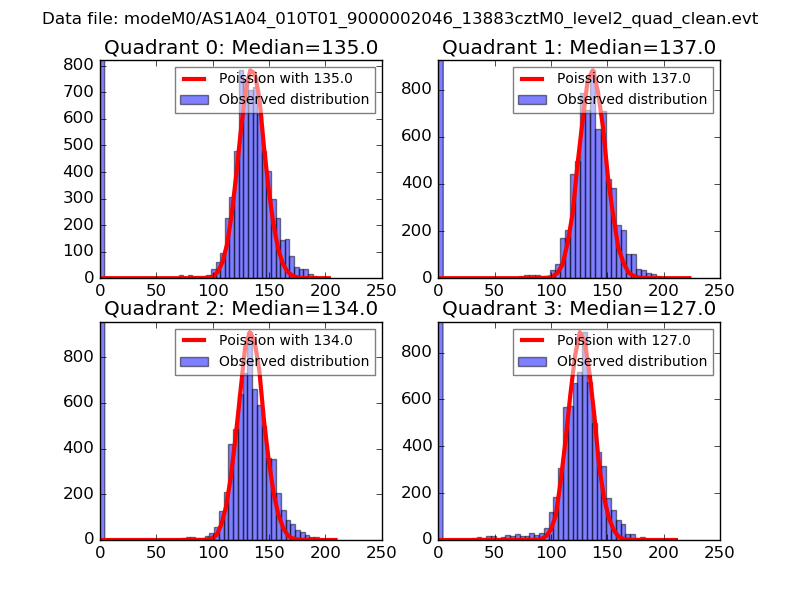 |
 |
| Quadrant-wise count rates Data is divided into 100 sec bins |
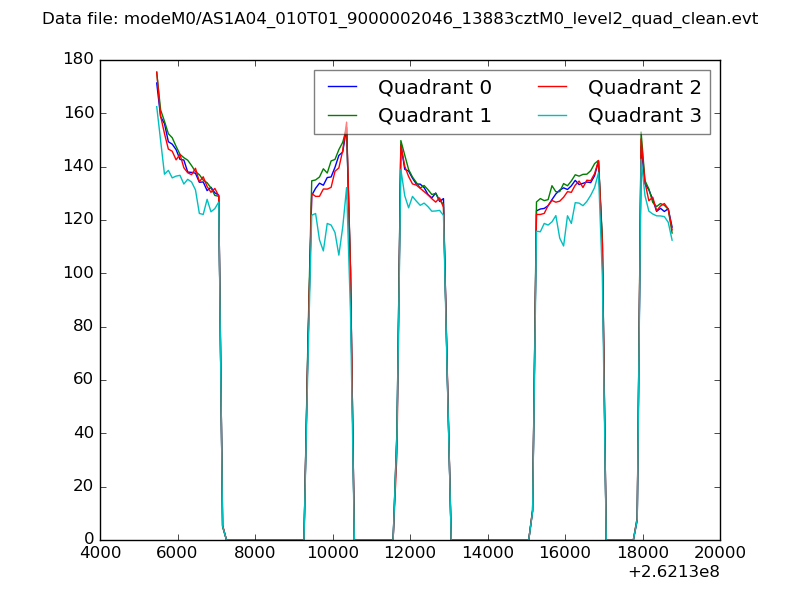 |
|
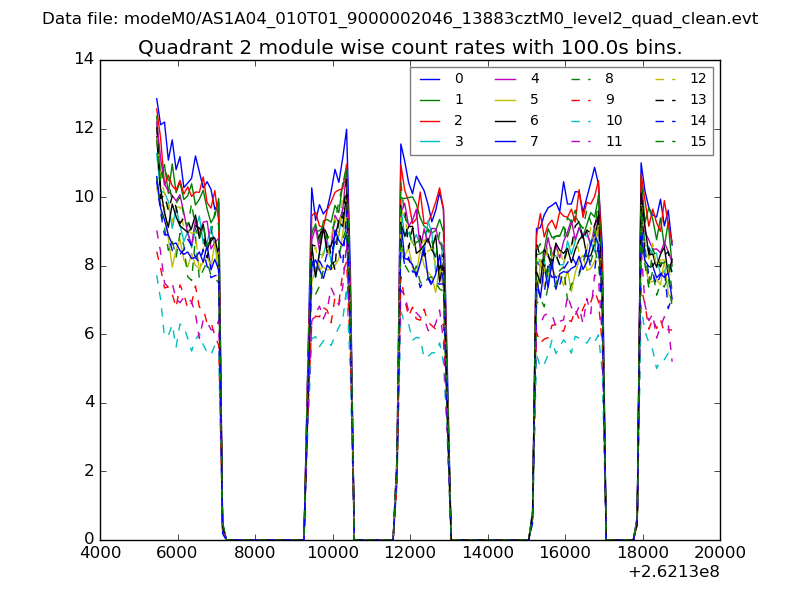
| Module-wise count rates for Quadrant A Data is divided into 100 sec bins |
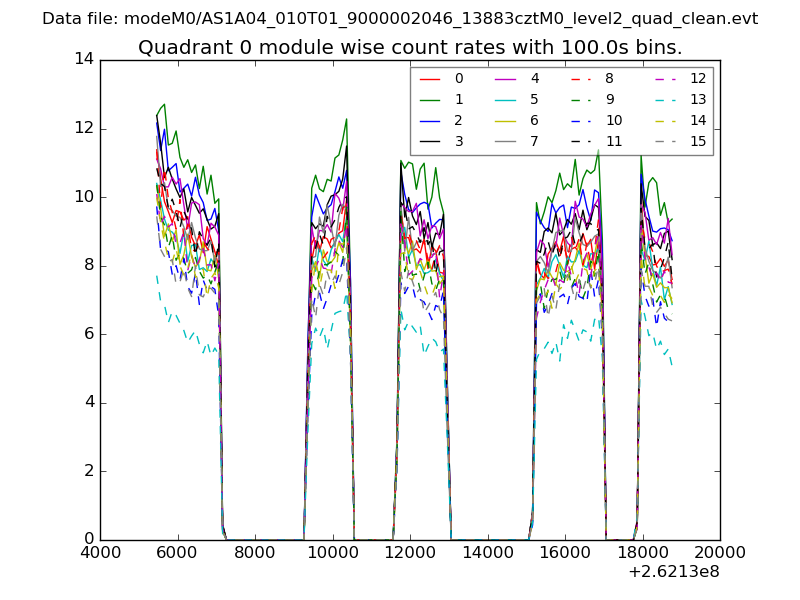 |
 |
| Module-wise count rates for Quadrant B Data is divided into 100 sec bins |
 |
 |
| Module-wise count rates for Quadrant C Data is divided into 100 sec bins |
 |
 |
| Module-wise count rates for Quadrant D Data is divided into 100 sec bins |
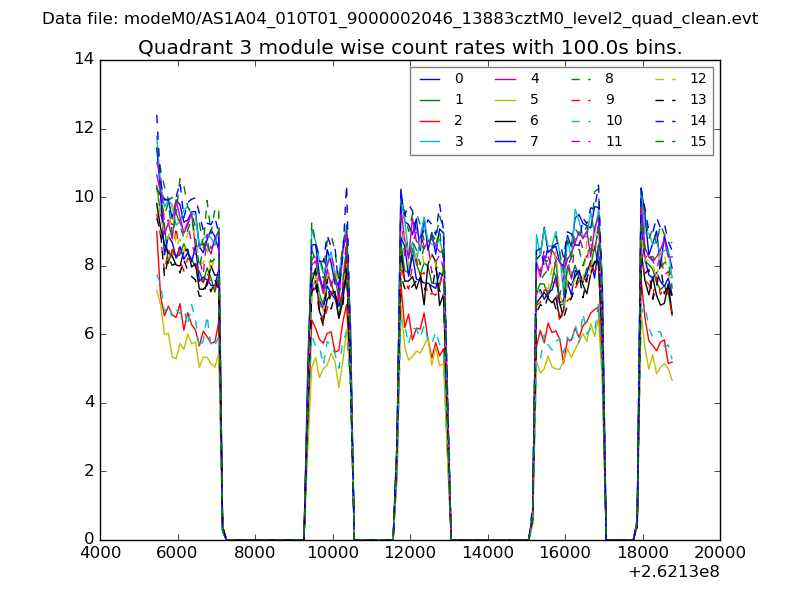 |
 |
| Parameter | Plot |
|---|---|
| CZT HV Monitor |  |
| D_VDD | 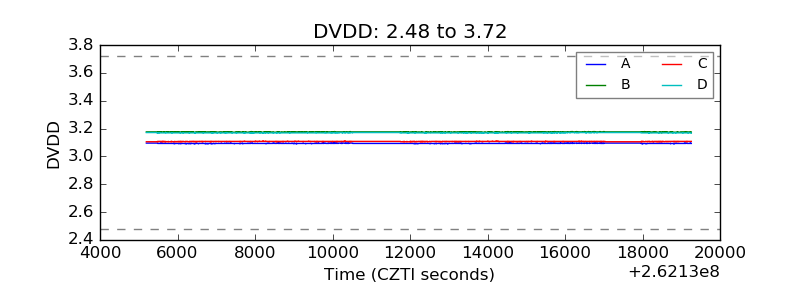 |
| Temperature 1 | 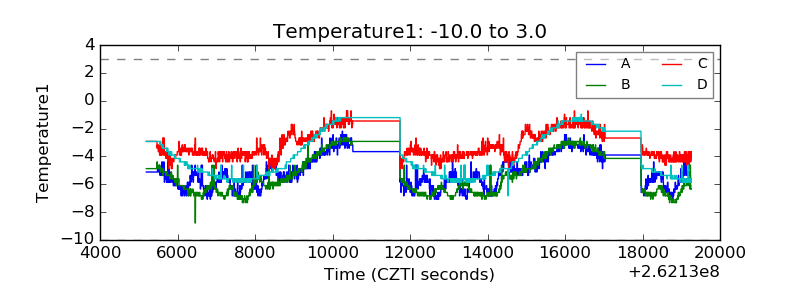 |
| Veto HV Monitor | 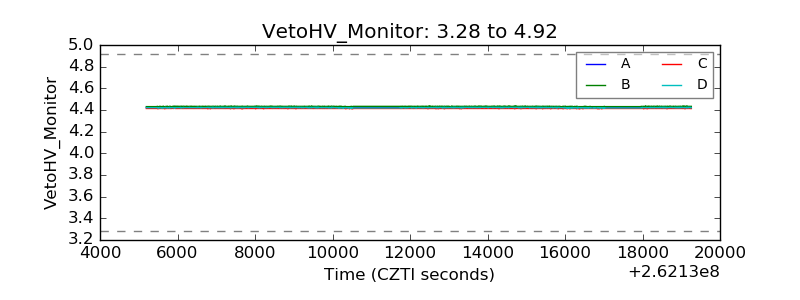 |
| Veto LLD | 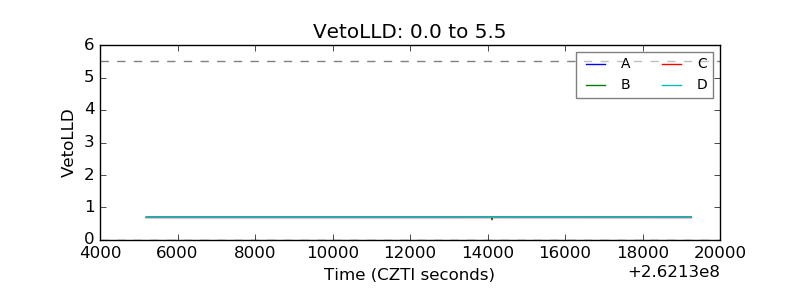 |
| Alpha Counter | 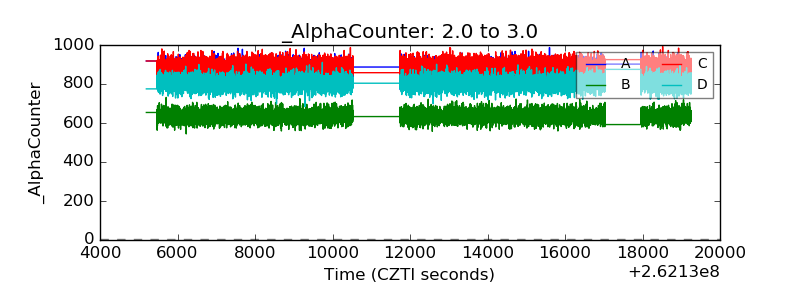 |
| _CPM_Rate | 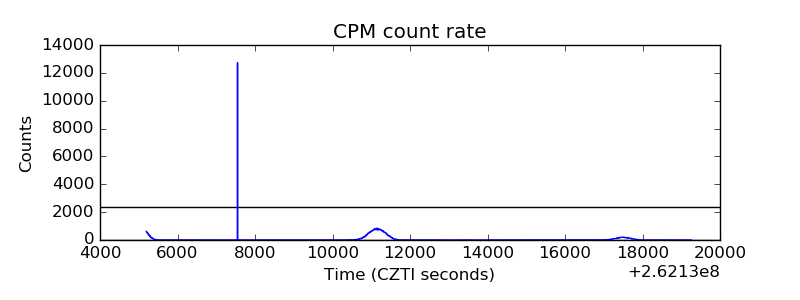 |
| CZT Counter | 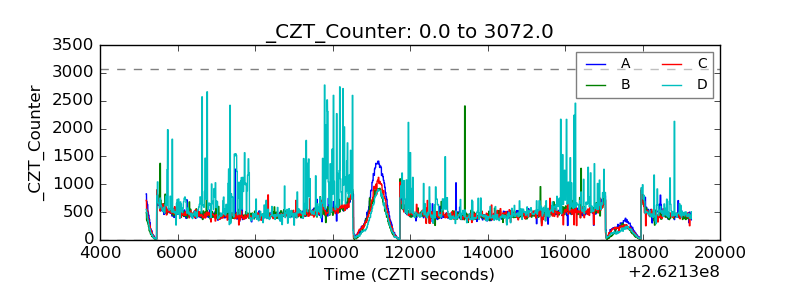 |
| +2.5 Volts monitor | 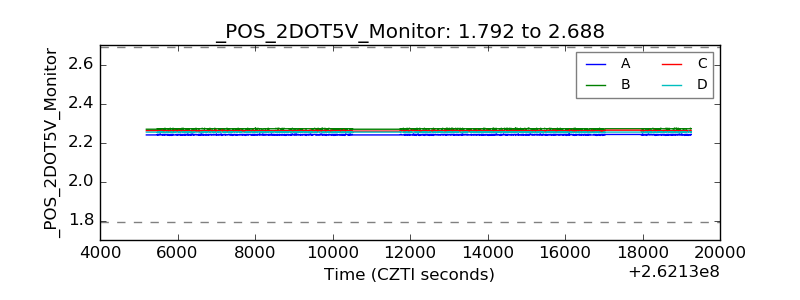 |
| +5 Volts monitor |  |
| _ROLL_ROT | 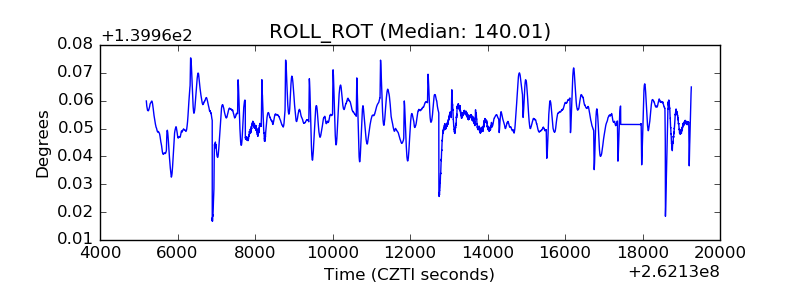 |
| _Roll_DEC | 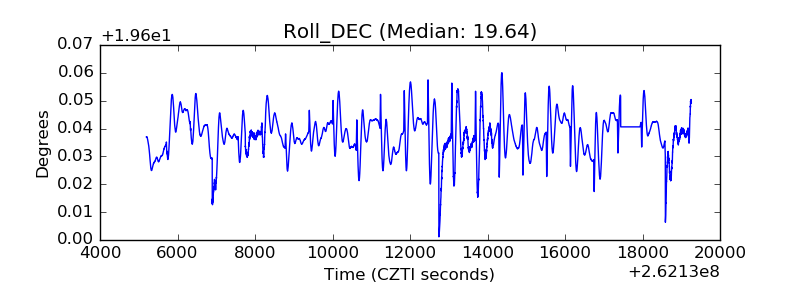 |
| _Roll_RA | 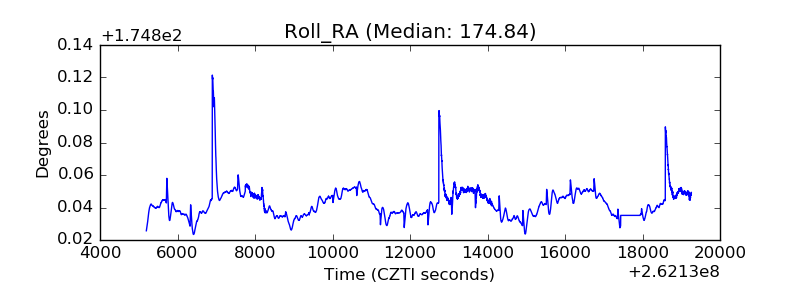 |
| Veto Counter | 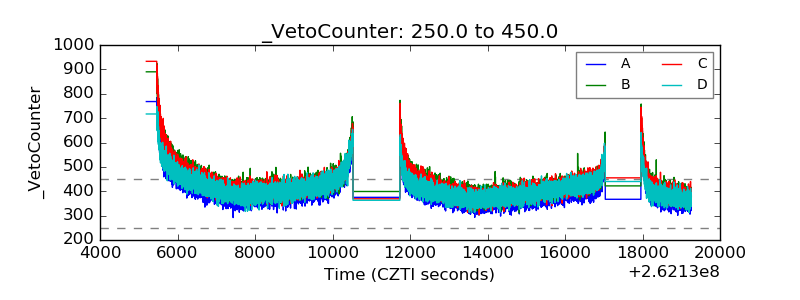 |